5034
How temperature and immersion liquid affect the relaxation properties in articular cartilage samples?1Department of Technical Physics, University of Eastern Finland, Kuopio, Finland, 2Oulu University Hospital, Oulu, Finland, 3A.I. Virtanen Institute for Molecular Sciences, University of Eastern Finland, Kuopio, Finland, 4Imaging Center, Kuopio University Hospital, Kuopio, Finland
Synopsis
Keywords: Cartilage, Cartilage
Motivation: Preclinical measurement series of articular cartilage samples are often time-consuming. Thus, knowledge about changes in relaxation properties of cartilage during measurements and depending on the sample handling is important.
Goal(s): To study the effect of storage temperature and immersion liquid on the relaxation properties of articular cartilage.
Approach: T1, T2, and adiabatic T1rho relaxation times were measured for 28 cartilage-bone samples at five timepoints and analyzed by linear regression.
Results: T1 and adiabatic T1rho relaxation times increased over time, while T2 varied. Immersion in phosphate-buffered saline instead of signal-free perfluoropolyether increased the relaxation times in superficial cartilage.
Impact: The study increases understanding on how the relaxation properties within ex vivo cartilage samples change over time. The results obtained here should be considered when planning future studies utilizing such samples.
Introduction
In preclinical specimen studies of musculoskeletal tissues, the samples are often fresh or freeze-preserved until measurements, instead of formaldehyde-fixed. Furthermore, scan time is often not considered as a limiting factor and thus the measurements can be quite time consuming when multiple contrasts and multiple modalities are used1,2. Thus, it is important to understand how the relaxation properties of samples are altered after the samples are prepared and whether the sample handling procedures affect the measurement observations. This is of high importance especially when results from different measurement series are compared to each other or to results obtained in in vivo conditions.In an earlier study, it was noted that the relaxation times in articular cartilage tissue samples were decreased after 15 hours storage in room temperature compared to fresh cartilage3. However, the study did not address how fast the change occurs or if the change could be diminished by storage conditions.
This study aims to assess how the relaxation times change after thawing the samples and when different sample handling conditions are applied. Comparisons are made for T1, T2, and adiabatic T1rho relaxation times in superficial and in deep cartilage.
Materials and Methods
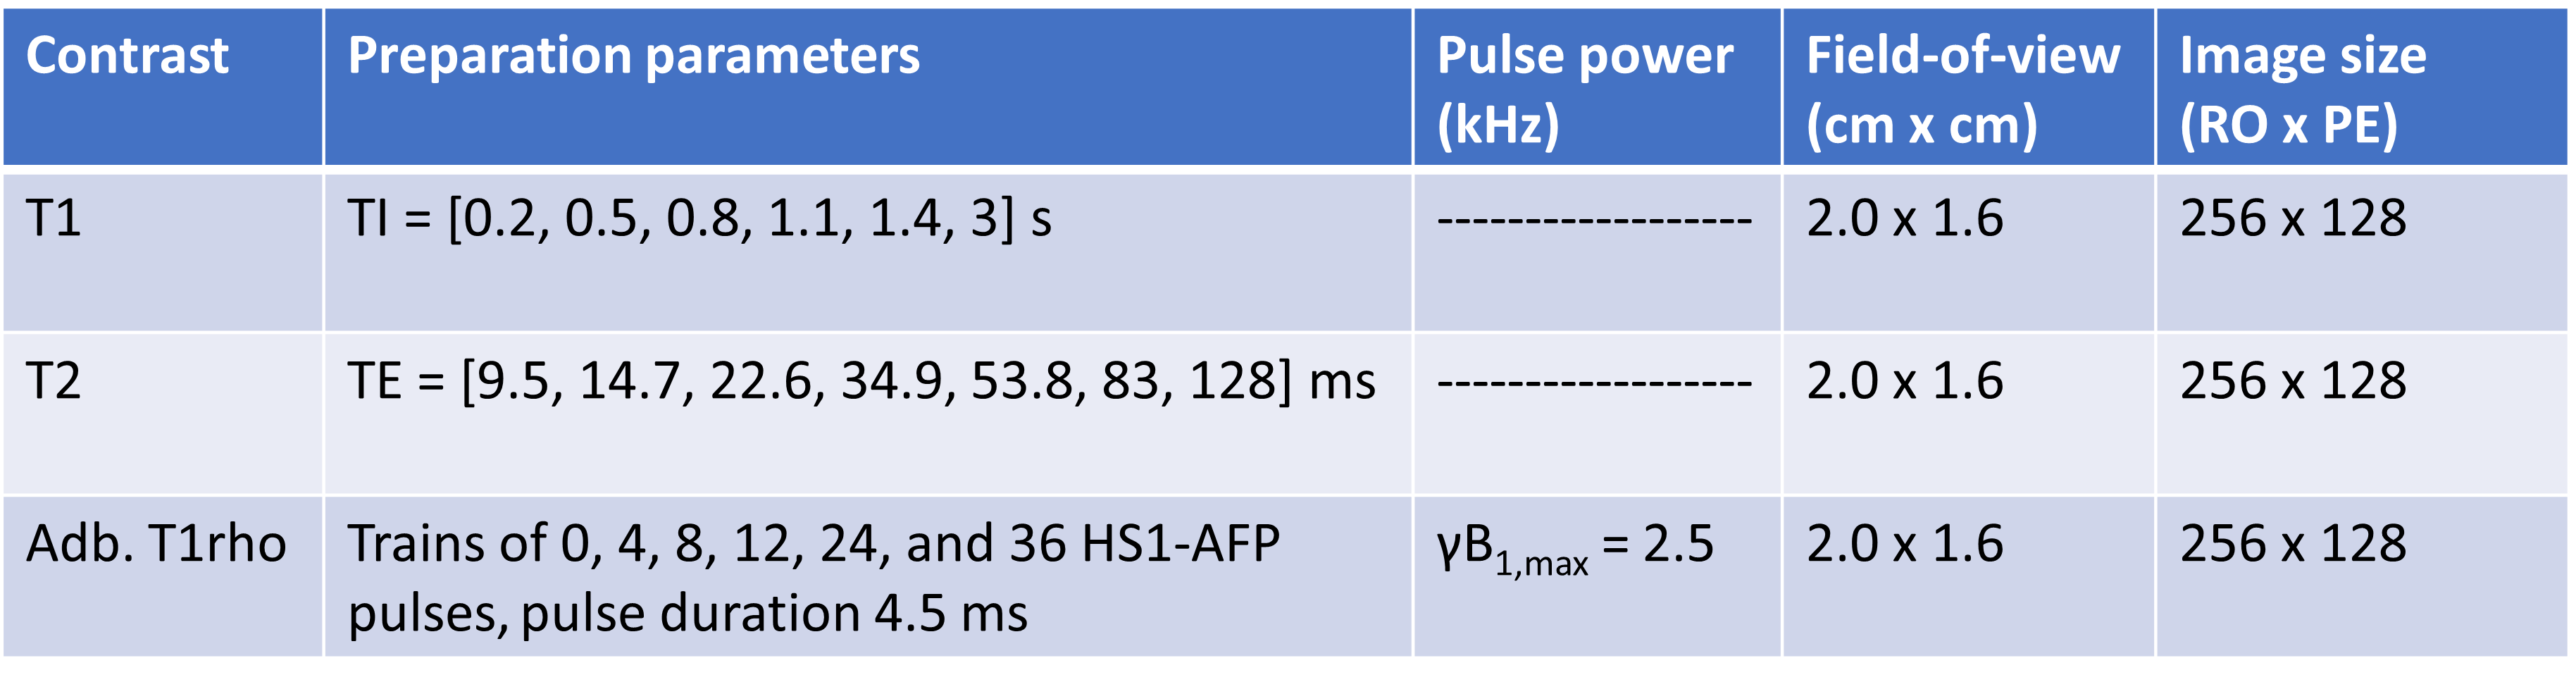
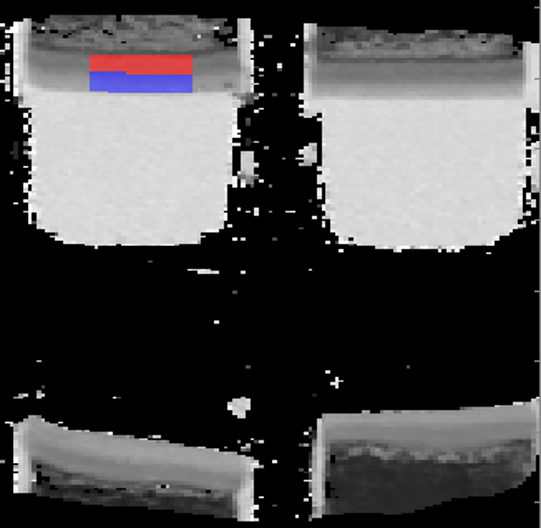
Total of 28 cartilage-bone samples were harvested from two bovine knee joints obtained from a local supermarket. The samples were divided into four groups by storage temperature (room temperature vs. fridge) and immersion liquid (phosphate buffered saline (PBS) with enzyme inhibitors vs. signal-free perfluoropolyether (PFPE)). The samples were cryopreserved fresh in -20°C temperature after preparation, as that has not been shown to affect the relaxation properties3,4. The samples were scanned 0, 3, 8, 24, and 48 hours after thawing. The measurements were performed in a 9.4T small bore MRI scanner (Varian) using a magnetization prepared fast spin echo sequence. Variety of magnetization preparations were utilized to acquire data for T1, T2, and adiabatic T1rho relaxation time mapping (Table 1).Relaxation time maps were computed using pixelwise two-parametric mono-exponential fitting to the magnitude data obtained from the measurements. Regions-of-interest (ROIs) were drawn to the superficial and deep cartilage regions in such way that the ROIs split the cartilage in two halves depth-wise (Fig. 1). Special care was taken to not include pixels containing PBS in the superficial ROIs. Mean values within the ROIs for each relaxation time were gathered at each timepoint. Linear regression models were fitted to these mean values to analyze temporal changes.
Results
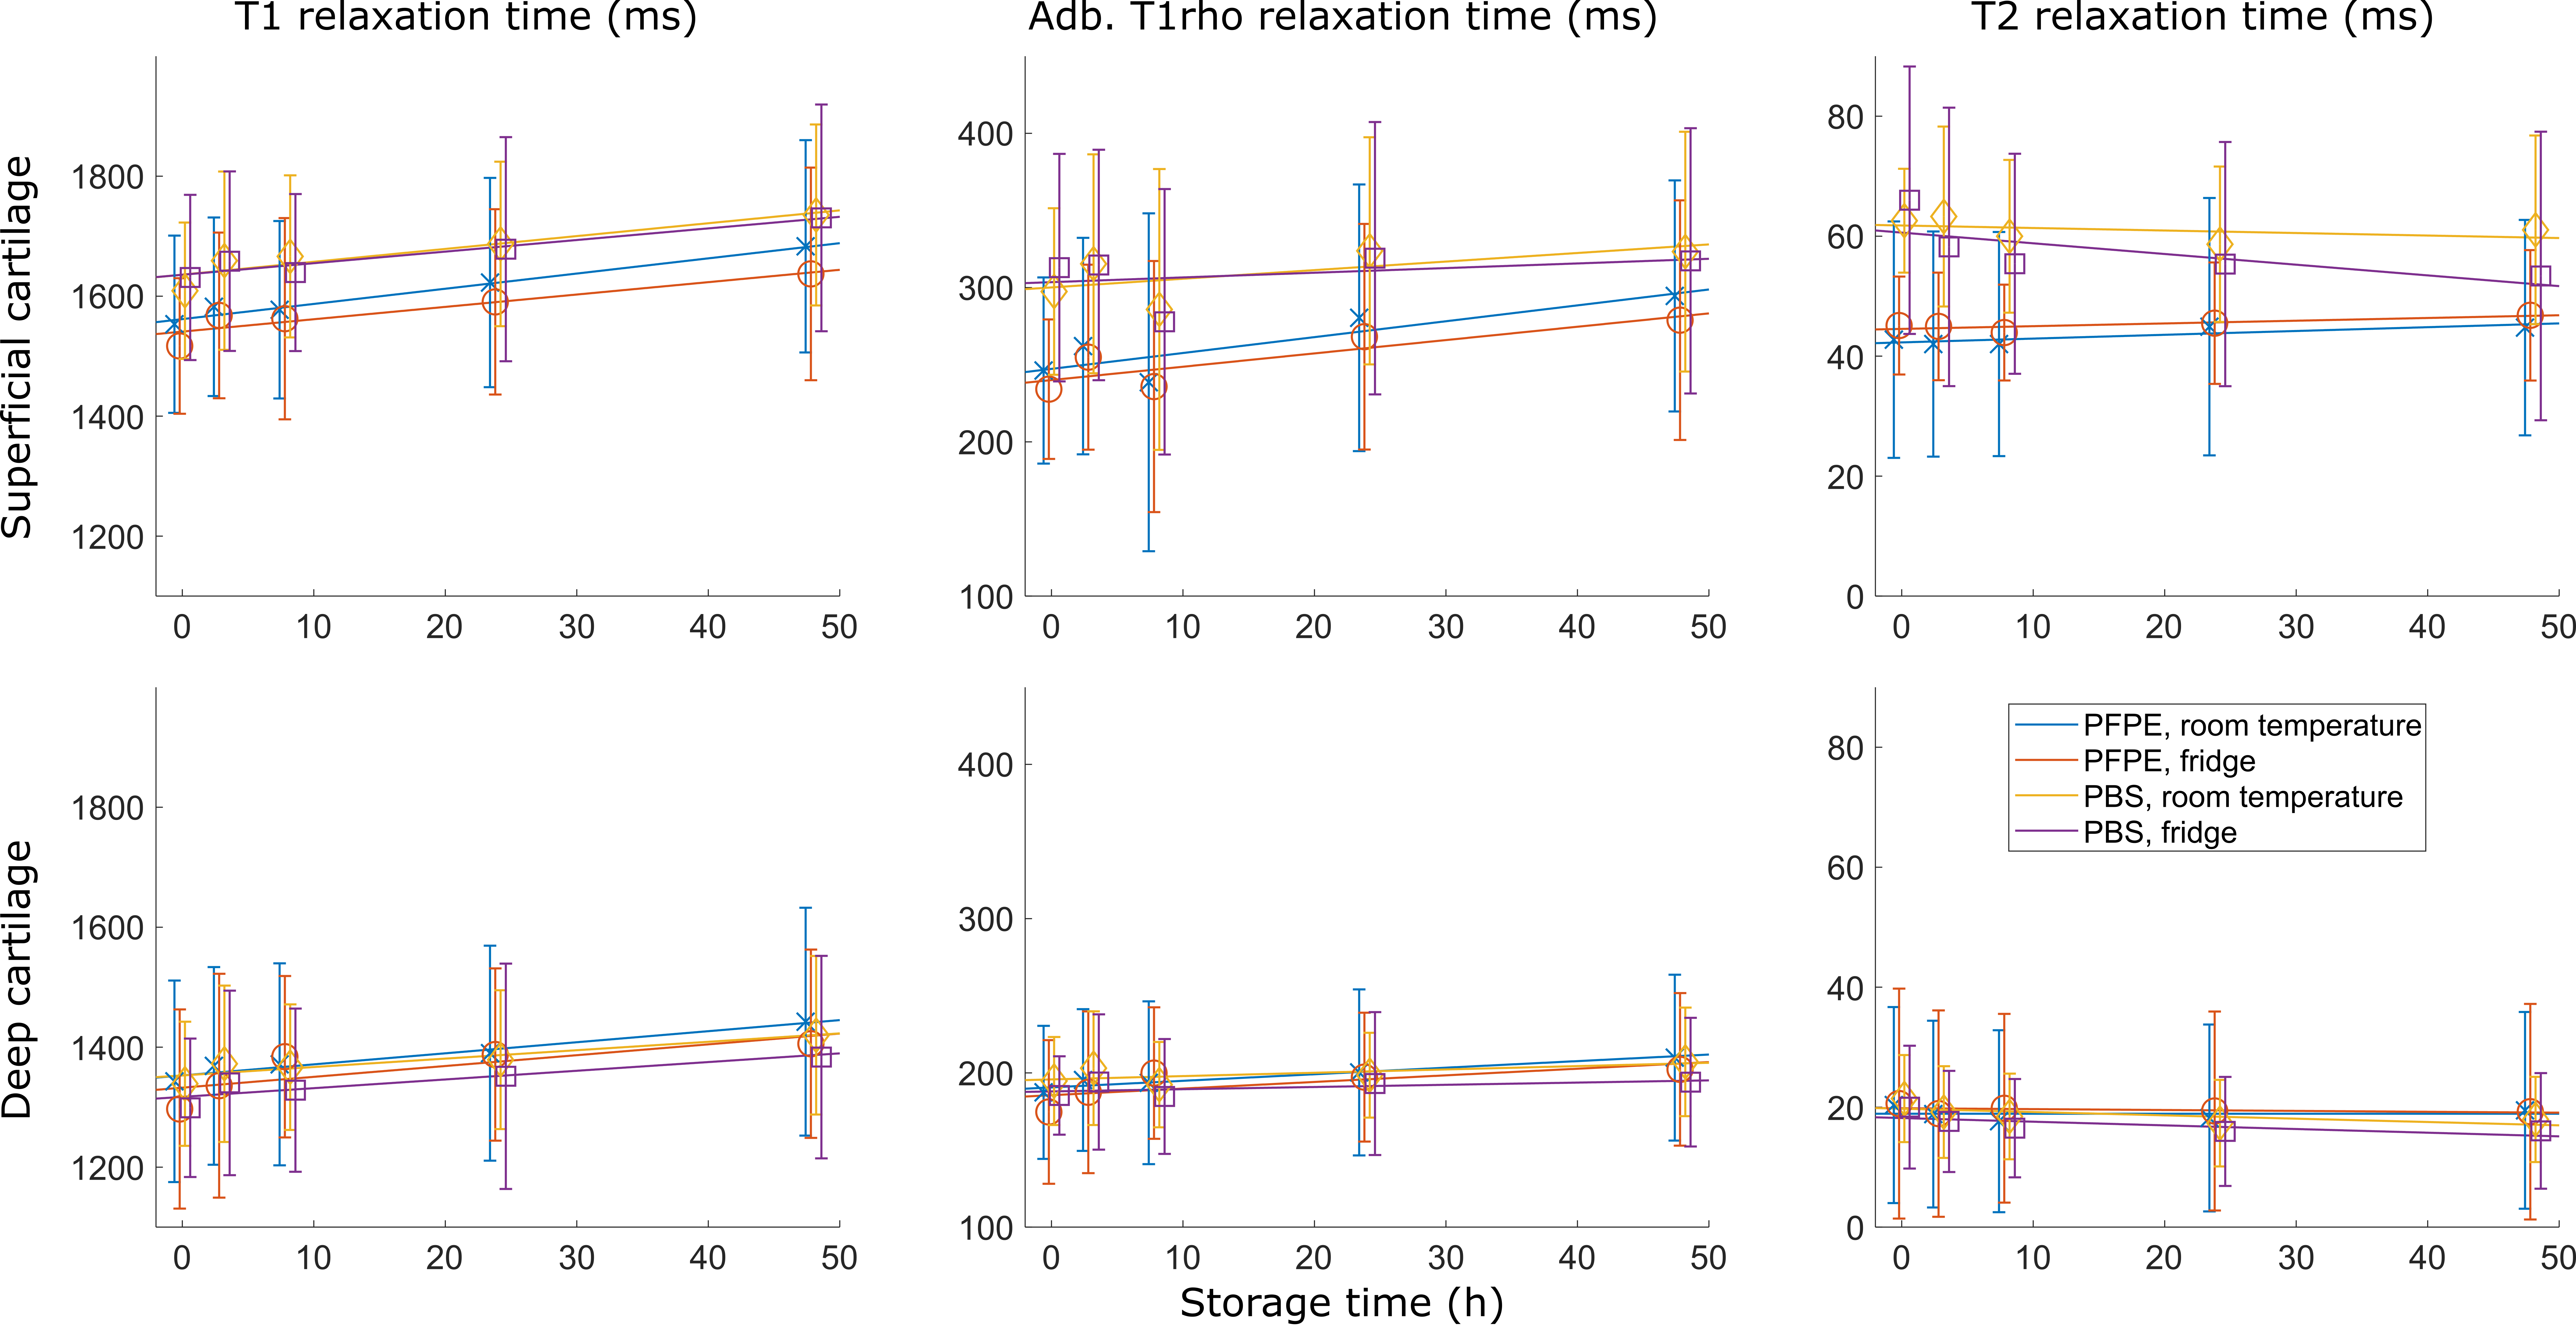
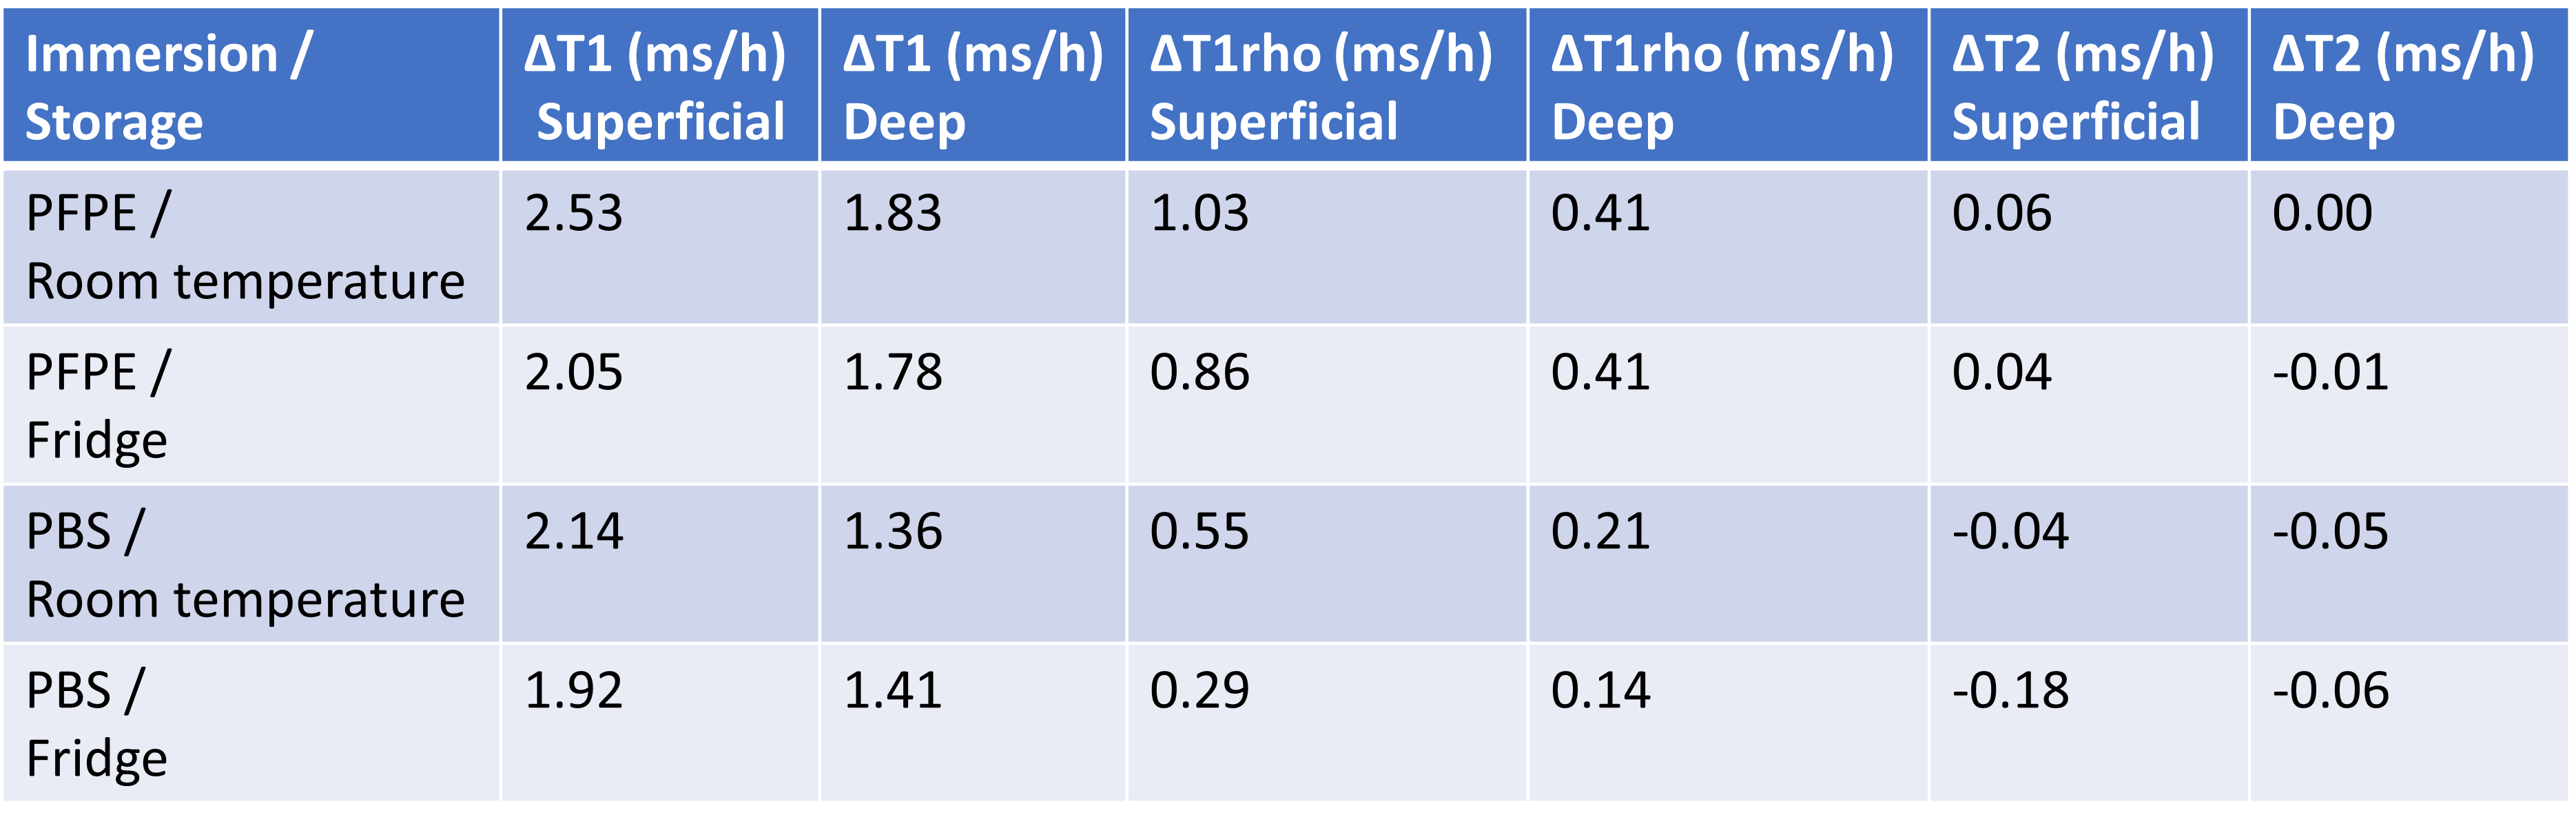
It was noted that T1 and adiabatic T1rho relaxation times increased over time in all the groups, although for adiabatic T1rho the change was slower for the PBS-immersed samples (Fig. 2, Table 2). Temporal behavior of T2 relaxation times was more variable across the different groups (Fig. 2, Table 2). The superficial relaxation times were clearly elevated in the samples that were immersed in PBS irrespective of the measurement timepoint (Fig. 2).Discussion and Conclusions
The T1 and adiabatic T1rho relaxation times increased steadily over time, which could indicate steady disintegration of cartilage extracellular matrix during the measurements. However, the observation differs from our earlier study, where the relaxation times decreased 5-15% in 15 hours of room temperature storage while immersed in PFPE3. In the previous study, however, fresh samples were utilized instead of cryopreserved ones, potentially indicating differences in the starting properties of fresh and cryopreserved tissues5. However, in our earlier study, no relaxation time differences were noted between the cryopreserved and fresh samples at the starting point3. In this study, decrease was quite interestingly only noted for the T2-relaxation time of the PBS-immersed samples, indicating that it was caused by something else than tissue dehydration, as tissue dehydration should reduce also T1 relaxation time6.Observing longer superficial relaxation times in the PBS-immersed samples compared to PFPE-immersed ones was somewhat expected, as immersion into PBS effectively prevented the dehydration of the sample surface. On the other hand, presence of signal-producing liquid could have increased the observed relaxation times via partial-volume effect. It might also be possible that the PBS immersion overhydrated the superficial cartilage.
Considering the obtained results, we recommend that the time between sample preparation and start of the MRI measurements should be clearly stated in future studies to make comparison between studies easier. Moreover, care should be taken when comparing studies with different immersion liquids, as immersion in signal-producing media clearly elevated superficial relaxation times and thus can have an impact on the interpretation of the results.
Acknowledgements
The funding from the Research Council of Finland (grants: #325146 and #354693) and from the Finnish Cultural Foundation (grant: #65211960) is gratefully acknowledged. Authors thank the Kuopio Biomedical Imaging Unit (BIU) for providing infrastructure for this study.References
1. Kajabi AW, Casula V, Sarin JK, et al. Evaluation of articular cartilage with quantitative MRI in an equine model of post-traumatic osteoarthritis. J Orthop Res. 2021;39(1):63-73. doi:10.1002/jor.24780
2. Kajabi AW, Casula V, Ojanen S, et al. Multiparametric MR imaging reveals early cartilage degeneration at 2 and 8 weeks after ACL transection in a rabbit model. J Orthop Res. 2020;38(9):1974-1986. doi:10.1002/jor.24644
3. Nykänen O, Hänninen NE, Nissi MJ. How pre-processing procedure affects relaxation properties of ex vivo articular cartilage? In: Proceedings of the 28th Annual Meeting of ISMRM. ; 2020:2819.
4. Fishbein KW, Canuto HC, Bajaj P, Camacho NP, Spencer RG. Optimal methods for the preservation of cartilage samples in MRI and correlative biochemical studies. Magn Reson Med. 2007;57(5):866-873. doi:10.1002/mrm.21189
5. Laouar L, Fishbein K, McGann LE, Horton WE, Spencer RG, Jomha NM. Cryopreservation of porcine articular cartilage: MRI and biochemical results after different freezing protocols. Cryobiology. 2007;54(1):36-43. doi:10.1016/j.cryobiol.2006.10.193
6. Wan L, Searleman AC, Ma Y, et al. The effect of cartilage dehydration and rehydration on quantitative ultrashort echo time biomarkers. Quant Imaging Med Surg. 2023;13(10):6942-6951. doi:10.21037/qims-23-359
Figures