5033
T2 relaxometry of foot muscles in young patients with Charcot-Marie-Tooth disease: comparison between centres and scanner vendors1University College London, London, United Kingdom, 2University of Iowa, Iowa, IA, United States, 3Centro Clinico NeMO Trento, Trento, Italy, 4Great Ormond Street Hospital, London, United Kingdom, 5National Hospital for Neurology and Neurosurgery, London, United Kingdom
Synopsis
Keywords: Muscle, Relaxometry, T2 mapping
Motivation: Current clinical use of quantitative MRI biomarkers for the assessment of neuromuscular disease is limited by accuracy and reliability
Goal(s): To develop a robust processing strategy for multi-vendor muscle-water T2 mapping (T2m) in foot muscle
Approach: A multi-component CPMG extended phase graph signal model was used to determine T2m and apparent fat fraction (ffa) in fat-infiltrated foot muscle using maximum likelihood estimation
Results: Stable estimates of foot muscle T2m and ffa were obtained in patients with Charcot-Marie-Tooth disease and healthy controls, at baseline and 1 year follow up. In patients, T2m and ffa were both elevated at each time point
Impact: T2m and ffa obtained from CPMG images using extended phase graph modelling and maximum likelihood estimation may be sensitive measures of neuromuscular pathology
Introduction
In many neuromuscular diseases the dominant pathological pathway involves intra-muscular fat infiltration, making determination of the remaining muscle tissue-water T2 (T2m), a measure potentially sensitive to active disease processes, challenging. One method proposed to achieve this is multi-component analysis of CPMG multi-echo imaging data1-3. We have improved the existing methods by implementing a multi-component slice-profile compensated extended phase graph (EPG) model of the CPMG signal, consisting of two fat signal components with fixed parameters, and the remaining unknown parameters determined by maximum likelihood estimation (MLE)4. Muscles of the foot become involved early in disease progression in young patients. In the current work we applied our method to foot data in a prospective cohort study of patients with Charcot-Marie-Tooth disease (CMT) and matched healthy controls (CTR), scanned at baseline and 1 year follow up in 3 centres and using scanners from 2 vendors.Methods
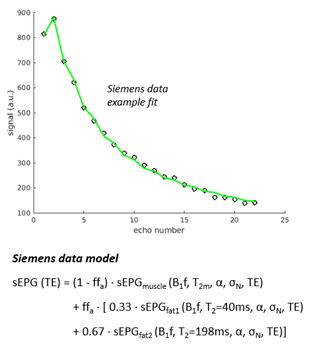
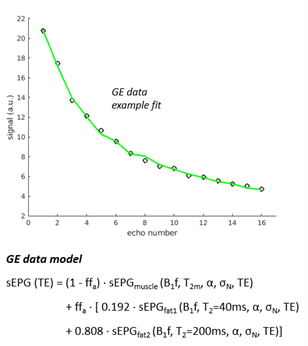
Participant groups comprised: CMT (n=22, mean age 13.1, 45% male) and CTR (n=14, mean age 14.5, 36% male). Patients were of the most common subtype CMT1A, recruited from the inherited neuropathy cohorts at the UCL Queen Square Centre for Neuromuscular Diseases (UCL-QSCMD), at Great Ormond Street Hospital (GOSH), and at the University of Iowa Carver College of Medicine. 3T MRI images were acquired from the left foot using a foot coil and a multi-echo spin-echo sequence. UCL-QSCMD/GOSH: Siemens Prisma, TR=3500ms, 22 TEs from 10-220ms with 10ms interval, 5 x 6 mm slices, in-plane resolution 1.2x1.2mm. Iowa: GE Discovery MR750, TR=3500ms, 16 or 8 TEs of variable intervals close to 10ms, 5 x 12mm slices, in-plane resolution 0.73x0.73mm. The foot muscle area was manually segmented on a central coronal slice using ITK-snap software. For Siemens data a multi-component slice profile-corrected EPG model (Figure 1) was fitted to the data using MLE in a custom-written MATLAB tool, to estimate T2m, the B1 field error factor (B1f) , apparent fat fraction (ffa), overall amplitude (α) and Rician noise SD (σN). The fixed 2-component fat signal model parameters were determined in a preliminary calibration as mean values estimated from 4 subcutaneous fat ROIs in 8 representative subjects. A similar process was repeated for GE data using 3 subcutaneous fat ROIs in 16 representative subjects, leading to an amended model (Figure 2). Quality control was applied based on fit-quality criteria (R2, goodness of fit), B1 field variation correction (spatial regularisation) and physical meaningfulness of fitted values (bound or extreme values) to exclude compromised fits. For comparison, mean cross-sectional muscle fat-fraction was determined independently by 3-point Dixon MRI (ffDixon). Corrections were applied to both ffDixon (fat multi-peak spectrum1) and ffa for magnetization transfer and T1 effects.Results
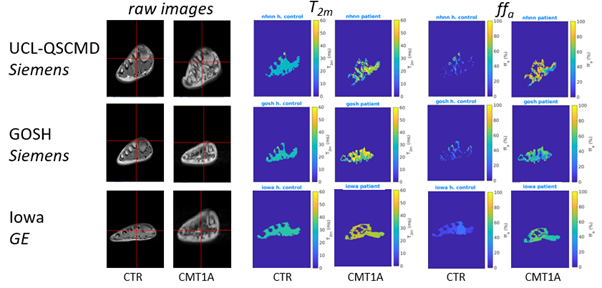
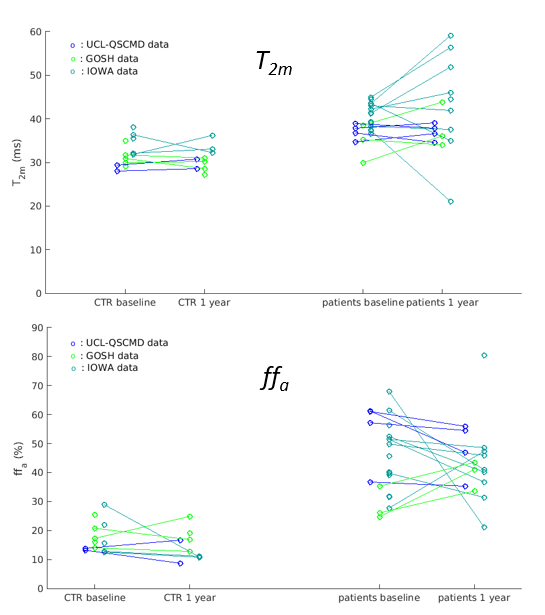
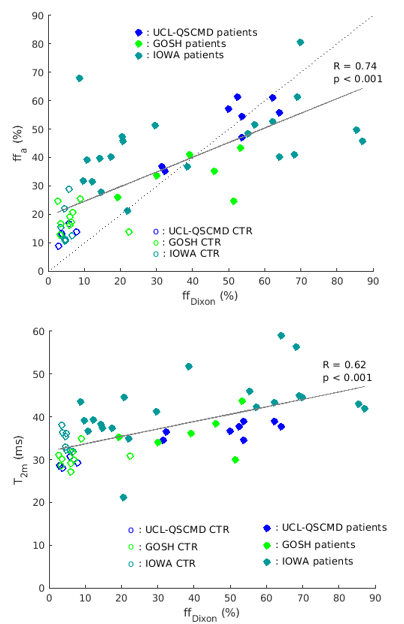
Mean T2m and ffa were calculated for all subjects (Figure 3). Cross-sectional foot muscle group mean ± SD T2m at baseline/1 year follow up were 32.3 ± 3.2ms / 30.9 ± 2.7ms and 39.2 ± 3.7ms / 41.0 ± 9.4ms in controls and patients respectively. The values for ffa were 17.7 ± 5.4% / 14.6 ± 5.1% in controls and 45.2 ± 13.1% / 44.0 ± 13.1% in patients. Mean T2m and ffa were significantly higher both at baseline (p=0.008 and p<0.001 vs. controls respectively) and at 1 year (p=0.005 and p<0.001) (Figure 4). Across vendors, T2m values tended to be higher on the GE scanner compared to the Siemens scanners (reaching significance for Iowa baseline controls vs. UCL-QSCMD baseline controls (p=0.04) and vs. GOSH 1 year controls (p=0.02). ffa values were not significantly different between vendors. 3-point Dixon obtained ff distributions were qualitatively similar, showing significant correlation with ffa also quantitatively, and to a lesser degree with T2m (Figure 5).Discussion
By fitting an advanced model to CPMG data, we have obtained broadly consistent foot muscle T2m and ffa estimates across sites and vendors in the CTR group, and evidence of disease-associated elevated T2m and ffa in patients. Despite using a signal model accounting for the specific RF pulse slice-selection profile, differences between vendors were observed, likely reflecting engineering and pulse sequence implementation variations. CPMG-obtained ffa were qualitatively consistent with those from Dixon MRI, but there were systematic differences quantitatively despite corrections. T2m also correlated with ffDixon, unlike other studies5, which may reflect a possible manifestation of the particular disease.Conclusion
Quantitative MRI of foot muscles as a potential biomarker in CMT is feasible and may be useful for monitoring treatment in younger people. T2m and ffa obtained from CPMG images using these methods may be sensitive measures of neuromuscular pathology.Acknowledgements
This study was funded by the Muscular Dystrophy Association (MDA510281). Supported by the National Institutes of Neurological Diseases and Stroke and office of Rare Diseases (U54NS065712) and the Muscular Dystrophy Association (MDA510281).References
1. AZZABOU, N., LOUREIRO DE SOUSA, P., CALDAS, E. & CARLIER, P. G. 2015. Validation of a generic approach to muscle water T2 determination at 3T in fat-infiltrated skeletal muscle. J Magn Reson Imaging, 41, 645-53.
2. LEBEL, R. M. & WILMAN, A. H. 2010. Transverse relaxometry with stimulated echo compensation. Magn Reson Med, 64, 1005-14.
3. MARTY, B., BAUDIN, P. Y., REYNGOUDT, H., AZZABOU, N., ARAUJO, E. C., CARLIER, P. G. & DE SOUSA, P. L. 2016. Simultaneous muscle water T2 and fat fraction mapping using transverse relaxometry with stimulated echo compensation. NMR Biomed, 29, 431-43.
4. ZAFEIROPOULOS, N, 2018. Improved muscle T2 estimation by maximum-likelihood parameter estimation using an extended-phase-graph signal model with locally estimated Rician noise levels. ISMRM 2018 abstract 2763.
5. ZAFEIROPOULOS, N, 2019 Extended phase graph model based tissue-water T2 estimation from CPMG image data in fat-infiltrated skeletal muscle: application in amyotrophic lateral sclerosis and Kennedy’s disease. ISMRM 2019 abstract 1275.
Figures