5032
Evaluation of bone marrow fat content and fatty acid composition using quantitative MRI combined with metabonomics in diabetic rabbits1Renmin Hospital of Wuhan University, Wuhan, China, 2GE Healthcare, Beijing, China
Synopsis
Keywords: Bone, Diabetes
Motivation: Bone marrow is a key target for diabetes mellitus.
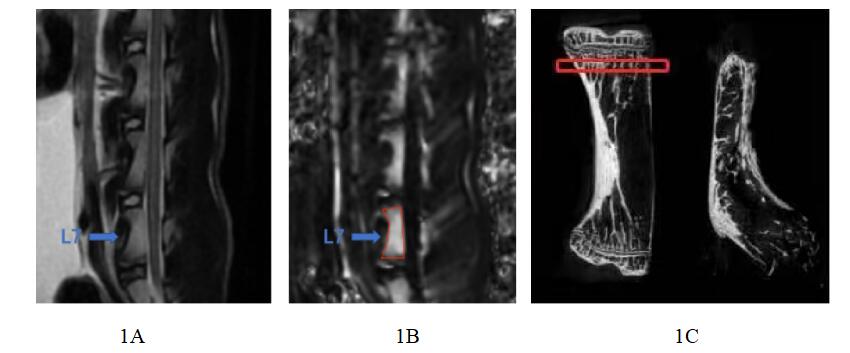
Goal(s): Quantitative assessment of fat content in lumbar bone marrow and trabecular microstructural changes in alloxan-induced diabetics rabbits.
Approach: Iterative decomposition of water and fat with echo asymmetry and least-squares estimation quantitation sequence (IDEAL-IQ), micro computed tomography (Micro-CT), and gas chromatography-mass spectrometry (GC-MS) were employed.
Results: IDEAL-IQ and GC-MS techniques are capable of detecting changes in fat content and variations in fatty acid composition during the early stages of diabetic bone marrow.
Impact: The fat content and fatty acid composition in the bone marrow plays an important role in bone metabolism in diabetic patients.
INTRODUCTION
Diabetes mellitus causes skeleton abnormality as the secondary complication [1,2]. Impaired skeleton increases fat volume and composition in bone marrow. Diabetes leads to an imbalanced ratio of bone marrow fatty acids to unsaturated fatty acids[3]. In other words, bone marrow fat plays a role in lipid storage, skeletal remodeling, metabolic homeostasis, and mechanical function[4] and could be a biomarker to monitor the diabetes-induced bone disease progress and reflect treatment effectiveness. Therefore, it is important to effectively quantify bone marrow fat content and fatty acid composition for comprehend bone metabolism in patients with diabetes.METHODS
Twenty male Japanese white rabbits were randomly assigned to either the diabetic group (n=10) or the control group (n=10). The rabbits were induced with alloxan as diabetes. IDEAL-IQ was used to assess the content of bone marrow fat in the rabbit lumbar vertebrae at four-week later after diabetes was developed. Repeated measures ANOVA was employed to compare the difference of fat fraction (FF) between the diabetics and control groups at different time points. Once significantly altered FF in the diabetic group compared to the control group, the rabbit lumbar spine were collected for Micro-CT examination, histopathological examination, and GC-MS analysis. The differences of FF, Micro-CT trabecular bone morphometric parameters, and histopathological parameters between groups at the same time point were compared using independent sample t-tests or Mann-Whitney U tests. For GC-MS data processing, multivariate principal component analysis (PCA) and orthogonal partial least-squares discriminant analysis (OPLS-DA) were conducted to generate a model for distinguishing the diabetic group from the control. The variable importance in the projection (VIP) value for each fatty acid in the model was calculated. Values were considered statistically significant when P < 0.05.RESULTS
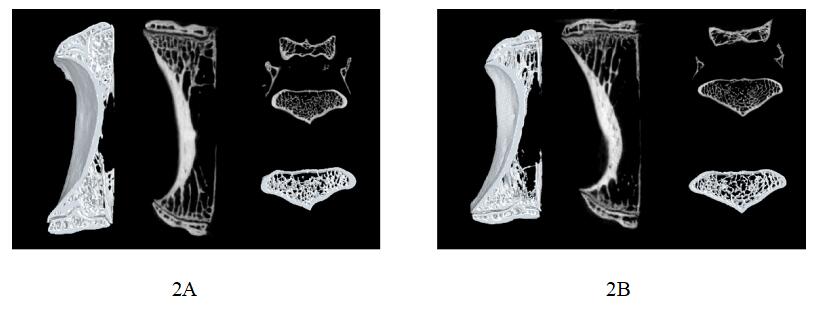
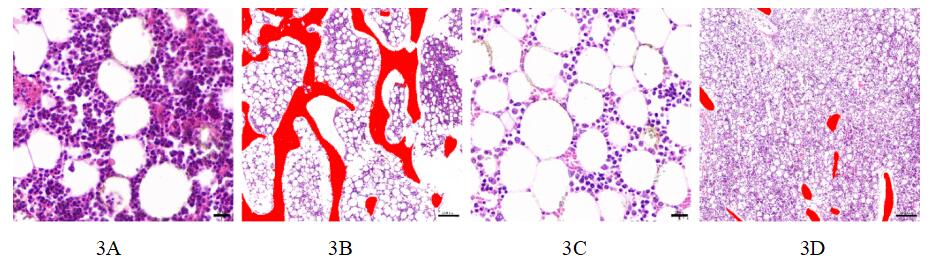
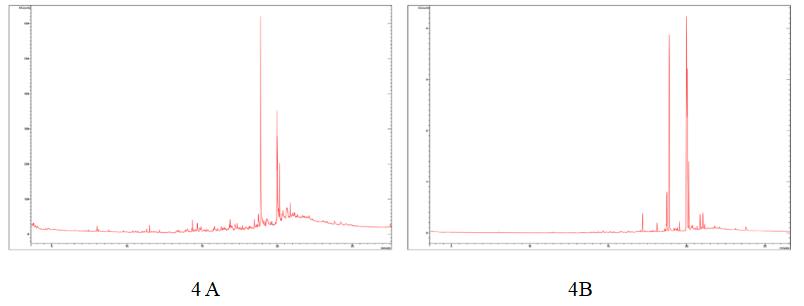
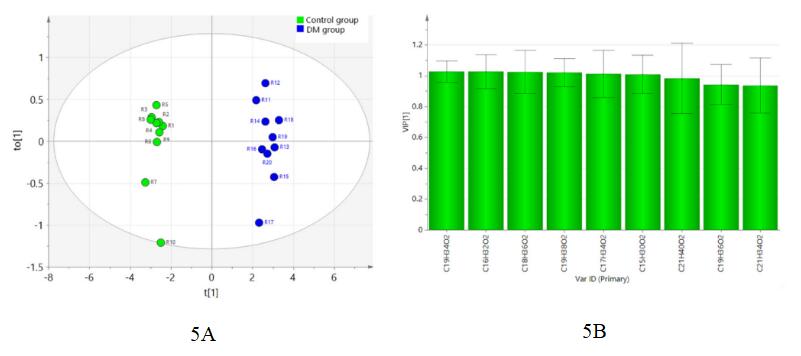
The bone marrow fat content in the diabetes group exhibited an increasing trend over time with statistical differences between time points (P<0.05) but not in the control group between each time pint (P>0.05). Specifically, at Week 16, a statistically significantly different FF of lumbar bone marrow was observed between the diabetic and control groups (40.5 ± 1.841 vs. 22.9 ± 1.524; P <0.05). Micro-CT analysis revealed overall decreased BMD, BV, BV/TV, BS, Tb.Th, Tb.N in the diabetic group compared to the control group. Additionally, the diabetic group exhibited significantly higher SMI and Tb.Sp than the control group at week 16 (P<0.05). Histopathological analysis at week 16 indicated that there was a significant increase in the number of adipocytes in the diabetic lumbar vertebral bone marrow compared to the control group (61.6±9.629 vs. 126.2±18.207; P<0.001). Additionally, Pearson's test revealed a strong correlation between the IDEAL-IQ-computed fat fraction and the histopathological adipocyte count at week 16 (r=0.921; P<0.01). Furthermore, the OPLS-DA model successfully distinguished between the control and diabetic groups, with an R2Y value of 0.994 and a Q2Y value of 0.978. Nine fatty acids (linoleic acid, pentacanoic acid, nechetaic acid, stearic acid, palmitic acid, myritic acid, cis-11-eicosenoic acid, oleic acid, arachidonic acid) were identified as the most distinguishable factors between the two groups. The diabetes group exhibited lower levels of six fatty acids (linoleic acid, pentacanoic acid, nechetaic acid, myritic acid, cis-11-eicosenoic acid, oleic acid) and higher levels of three fatty acids (stearic acid, palmitic acid, arachidonic acid) in the diabetic bone marrow than the control group.DISCUSSION
CONCLUSION
Acknowledgements
Funding Information: This study received support from the National Natural Science Foundation of China (Grant Numbers 81871332 and 82171895) and the Interdisciplinary Innovative Talents Foundation from Renmin Hospital of Wuhan University.References
[1] Cheng K, Guo Q, Yang W, et al. Mapping Knowledge Landscapes and Emerging Trends of the Links Between Bone Metabolism and Diabetes Mellitus: A Bibliometric Analysis From 2000 to 2021[J]. Front Public Health,2022,10:918483.
[2] Zheng Y, Rostami HAM, Ghafouri Z, et al. Bone deficits in children and youth with type 1 diabetes: A systematic review and meta-analysis[J]. Bone,2022,163:116509.
[3] Patsch J M, Li X, Baum T, et al. Bone marrow fat composition as a novel imaging biomarker in postmenopausal women with prevalent fragility fractures[J]. J Bone Miner Res,2013,28(8):1721-1728.
[4] Scheller E L, Cawthorn W P, Burr A A, et al. Marrow Adipose Tissue: Trimming the Fat[J]. Trends in Endocrinology & Metabolism,2016,27(6):392-403.
Figures