5025
Improved depiction of habenula with optimized high-resolution STAGE1radiology department, Bethune First Hospital of Jilin University, Changchun, China, 2Department of Biomedical Engineering, Wayne State University, Detroit, Michigan, MI, United States, 3MR Scientific Marketing, Diagnostic Imaging, Siemens Healthineers Ltd, Beijing, China, 4School of Nursing, Jilin University, Changchun, China
Synopsis
Keywords: Psychiatric Disorders, Psychiatric Disorders, habenula;depressive disorder;STAGE
Motivation: The visualization and identification of humans habenula is particularly challenging in vivo MR imaging due to its subcortical location and small size
Goal(s): To achieve visualization and quantitative analysis of the habenula
Approach: In this work we performed a high-resolution strategically acquired gradient echo protocol at 3T for visualization habenula
Results: We achieved high-definition visualization of habenula, and provided a quantitative multi-parametric characterization of the habenula microstructure in vivo
Impact: We performed an optimized high-resolution sequence, which used to guide future studies optimizing the visualization of habenula. The standardized nature of quantitative MR measurements also provide a baseline from a healthy cohort against which to assess pathological differences.
Introduction
• The habenula is a small, epithalamic brain structure situated between the mediodorsal thalamus and the third ventricle. It plays an important role in the reward circuitry of the brain and is implicated in psychiatric conditions, such as depression [1]. The importance of the habenula for human cognition and mental health make it a key structure of interest for neuroimaging studies. The visualization and identification of the habenula is particularly challenging in vivo MR imaging [2-3]. STAGE imaging offers the potential to create a standardized brain imaging protocol providing four pieces of quantitative tissue property information and multiple types of qualitative information. We aimed to visualize and quantitative analysis the habenula using three-dimensional multi-echo strategically acquired gradient echo (STAGE) sequence.Methods
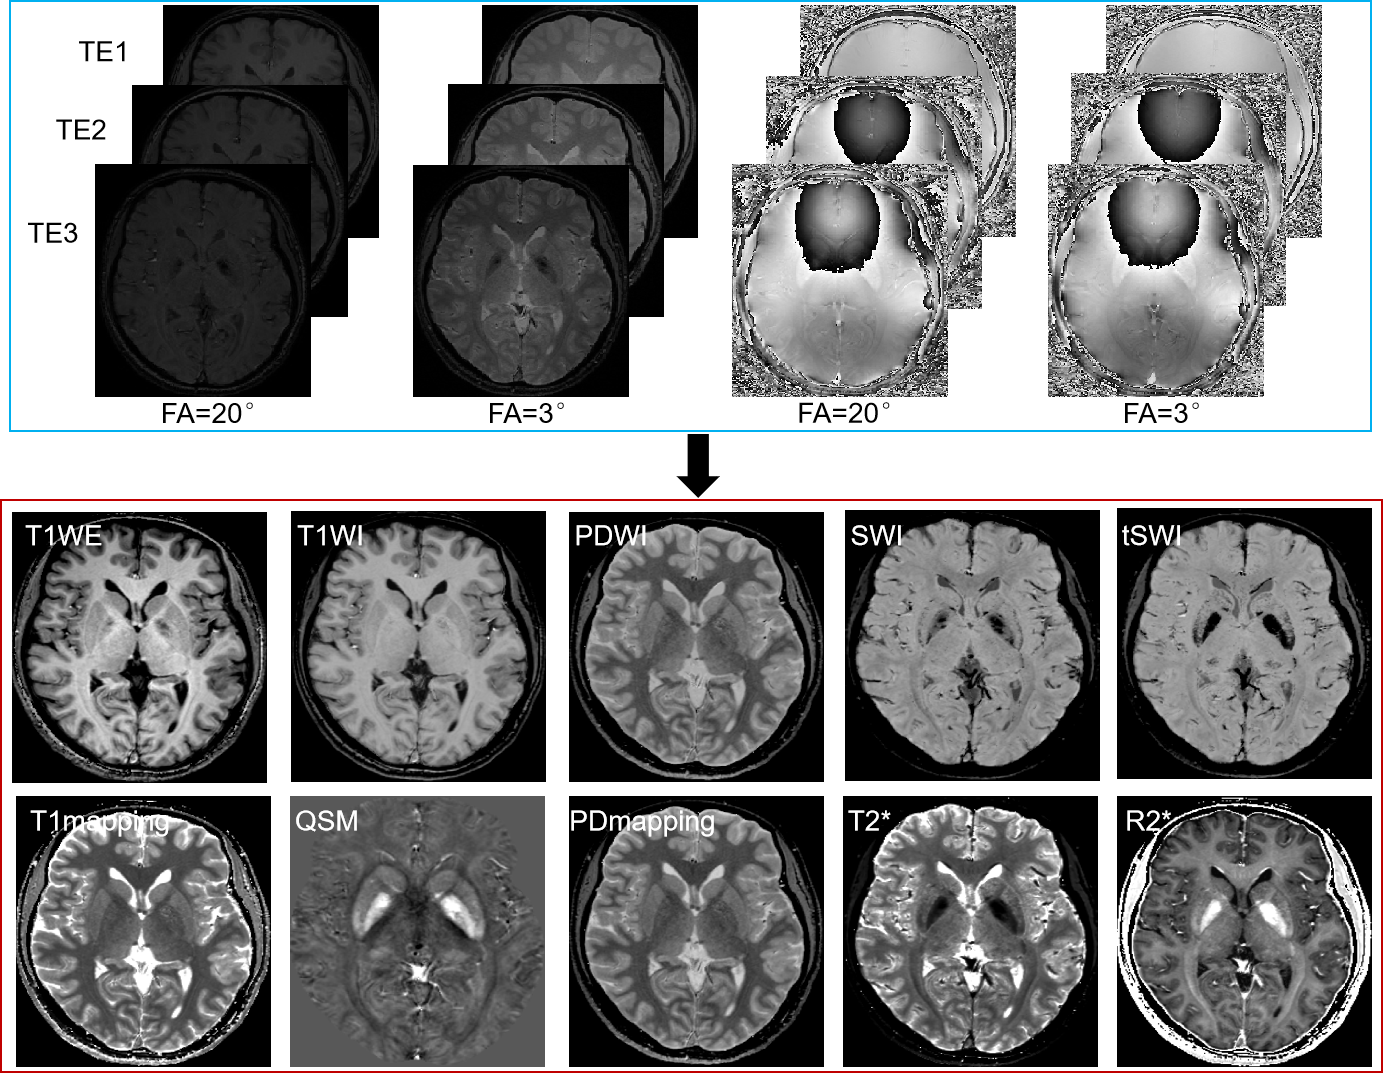
20 healthy participants (25±8.9 years old) who performed on a 3T MRI scanner (MAGNETOM Vida, Siemens Healthineers, Germany) with a 64-channel head-and-neck coilwas used to acquire whole brain STAGE data (TR = 29ms, TE = 8.5 ms, 15.5 ms, and 22.5 ms, flip angles (FA) = 3 and 20, resolution 0.67 mm × 0.67 mm × 1.0 mm, FOV = 256 mm × 192 mm, pixel bandwidth = 130 Hz/pixel, matrix = 416 × 312, and total scan time = 13 min). The qualitative image and quantitative mapping were obtained using STAGE 3.2.4 software (SpinTech MRI, Bingham Farms, MI, USA) (Figure 1). Qualitative image quality and visibility of habenula anatomical features were analyzed by 3 radiologists using a 5-point scale. The scores were defined as: 1- the Hb was not visible; 2- the Hb was poorly visible with fuzzy borders; 3- the Hb was clearly differentiable from the third ventricle but not from the thalamus; 4- the Hb was better visible with clear borders; and 5- the Hb was well-defined and clearly differentiable. Quantitative values and volume were also measured in whole habenula. An intraclass correlation coefficient (ICC) was calculated to assess the interrater reliability of the delineation of the habenula.Results
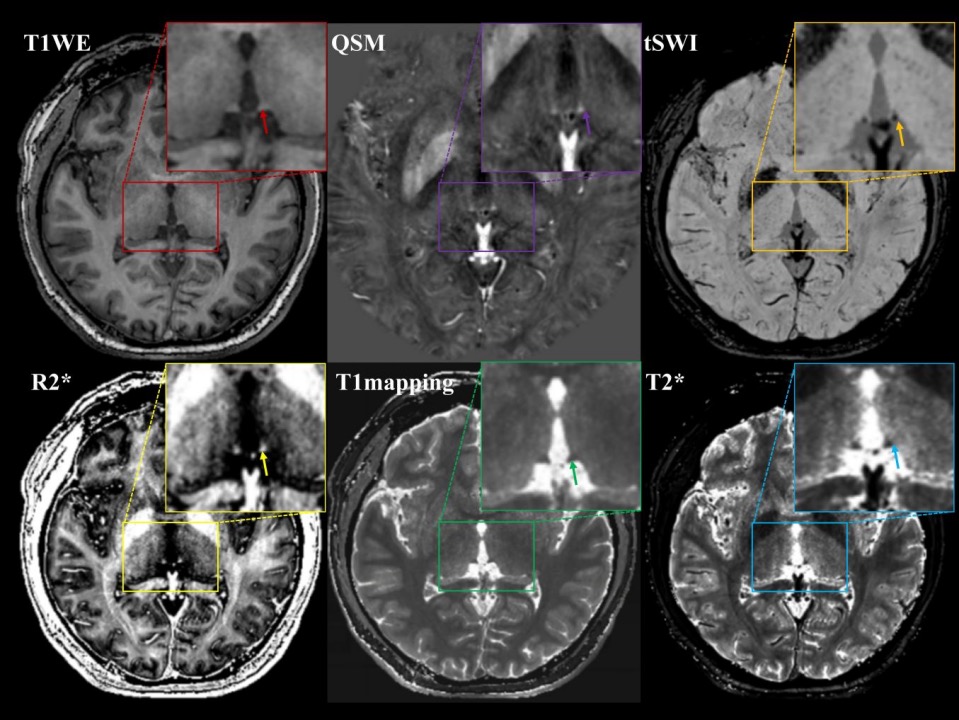
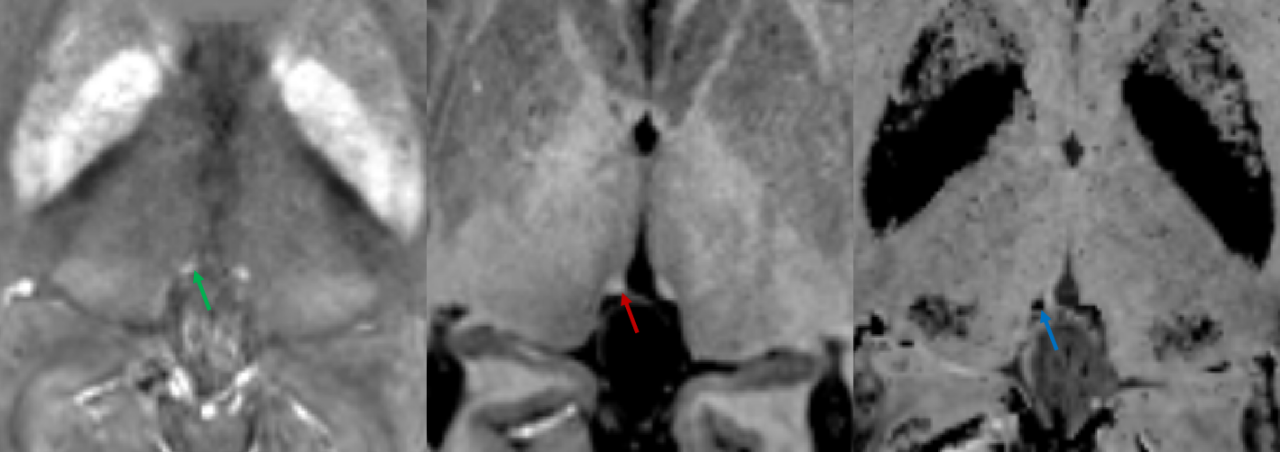
The habenula had consistent boundaries and clearly visualization (T1WE, tSWI) as well as accurate quantification (T1 mapping, QSM, R2* mapping and T2* mapping) across the various qualitative and quantitative images from STAGE sequence. QSM and tSWI can clearly definite the lateral habenula (Figure 2). The intraclass correlation coefficient (ICC) for agreement in subjective scores, quantitative values measurements and volume estimation between raters were more than 0.87.Discussion
STAGE provided a qualitative and quantitative multi-parametric characterization that may be useful for future sequence optimization to enhance visualization of the habenula, and additionally provides reference values for future studies investigating pathological differences.Conclusion
STAGE imaging protocol to provide a clear definition and accurate quantification of the habenula and provide groundwork for the future development of an imaging surrogate for the habenula to study various psychiatric diseases.Acknowledgements
This work was supported by the National Natural Science Foundation of China (grant number: 82102143).References
1. Yang Y, Cui Y, Sang K, et al. Ketamine blocks bursting in the lateral habenula to rapidly relieve depression. Nature 2018;7692:317-322.
2. Strotmann B, Heidemann RM, Anwander A, et al. High-resolution MRI and diffusion-weighted imaging of the human habenula at 7 tesla. J Magn Reson Imaging 2014;4:1018-1026.
3. Lawson RP, Drevets WC, Roiser JP. Defining the habenula in human neuroimaging studies. Neuroimage 2013;64:722-727.
Figures