5023
Objective Depression Diagnosis derived from Effective Connectivity through Dynamic Causal Modelling1Electrical Engineering, Eindhoven University of Technology, Eindhoven, Netherlands, 2Donders Centre for Cognitive Neuroimaging, Donders Institute for Brain, Cognition and Behaviour, Radboud University, Nijmegen, Netherlands, 3Epilepsy Center Kempenhaeghe, Heeze, Netherlands
Synopsis
Keywords: Psychiatric Disorders, fMRI (resting state), Neuropsychiatric disorders, effective connectivity, neurodynamics
Motivation: The diagnosis of major depressive disorder (MDD) currently involves subjectivity, but an objective test based on a measurement is desired.
Goal(s): To obtain effective connections between brain networks from functional MRI that both allow MDD to be diagnosed and offer clinically relevant insight.
Approach: Stochastic Dynamic Causal Modelling is applied to the time series of resting-state networks. The most discriminative connections are found through Bayesian Model Reduction and Chi-Square feature selection. These connections are used for classification using machine learning.
Results: Eight clinically relevant effective connections result in 94% leave-one-out cross-validation accuracy, which resulted in 100% accuracy on a separate test set.
Impact: The discriminative ability of the eight resulting effective connections aid understanding of MDD's pathophysiology. Furthermore, the results may inspire researchers to investigate the eight most discriminative connections on other datasets, which can lead to an objective diagnostic biomarker for MDD.
Introduction
While an objective diagnosis of major depressive disorder (MDD) progressing from a measurement is desired1, the diagnosis is still based on criteria prone to subjectivity2. Functional magnetic resonance imaging (fMRI) provides measurements of the brain over time, which allows the blood-oxygen-level-dependent (BOLD) signal to be extracted. The BOLD signal serves as a proxy of neuronal activity, which has been analyzed for diagnostic purposes and biomarker discovery3. Where most studies look at functional connectivity between regions of interest (ROIs)4, we think effective connectivity (EC), i.e. causal relations rather than correlations, allows a deeper understanding of MDD’s underlying pathophysiology. While data-driven methods to extract causal relations like Granger causality5, 6 are more commonly used for EC, we leveraged Friston’s biologically-inspired method titled stochastic Dynamic Causal Modelling 7, 8 (sDCM) as it is tailored to neuronal activity. Though some studies have applied DCM to MDD4, 9, 10, this is, to our knowledge, the first study that applies sDCM on resting-state networks (RSNs) to obtain effective connections capable of diagnosing MDD. The most discriminative connections relate to MDD’s symptoms, which may show merit in the discovery of a biomarker. This is also important in the light of trauma, as depression is the most common neuropsychiatric disorder following traumatic brain injury11.Methods
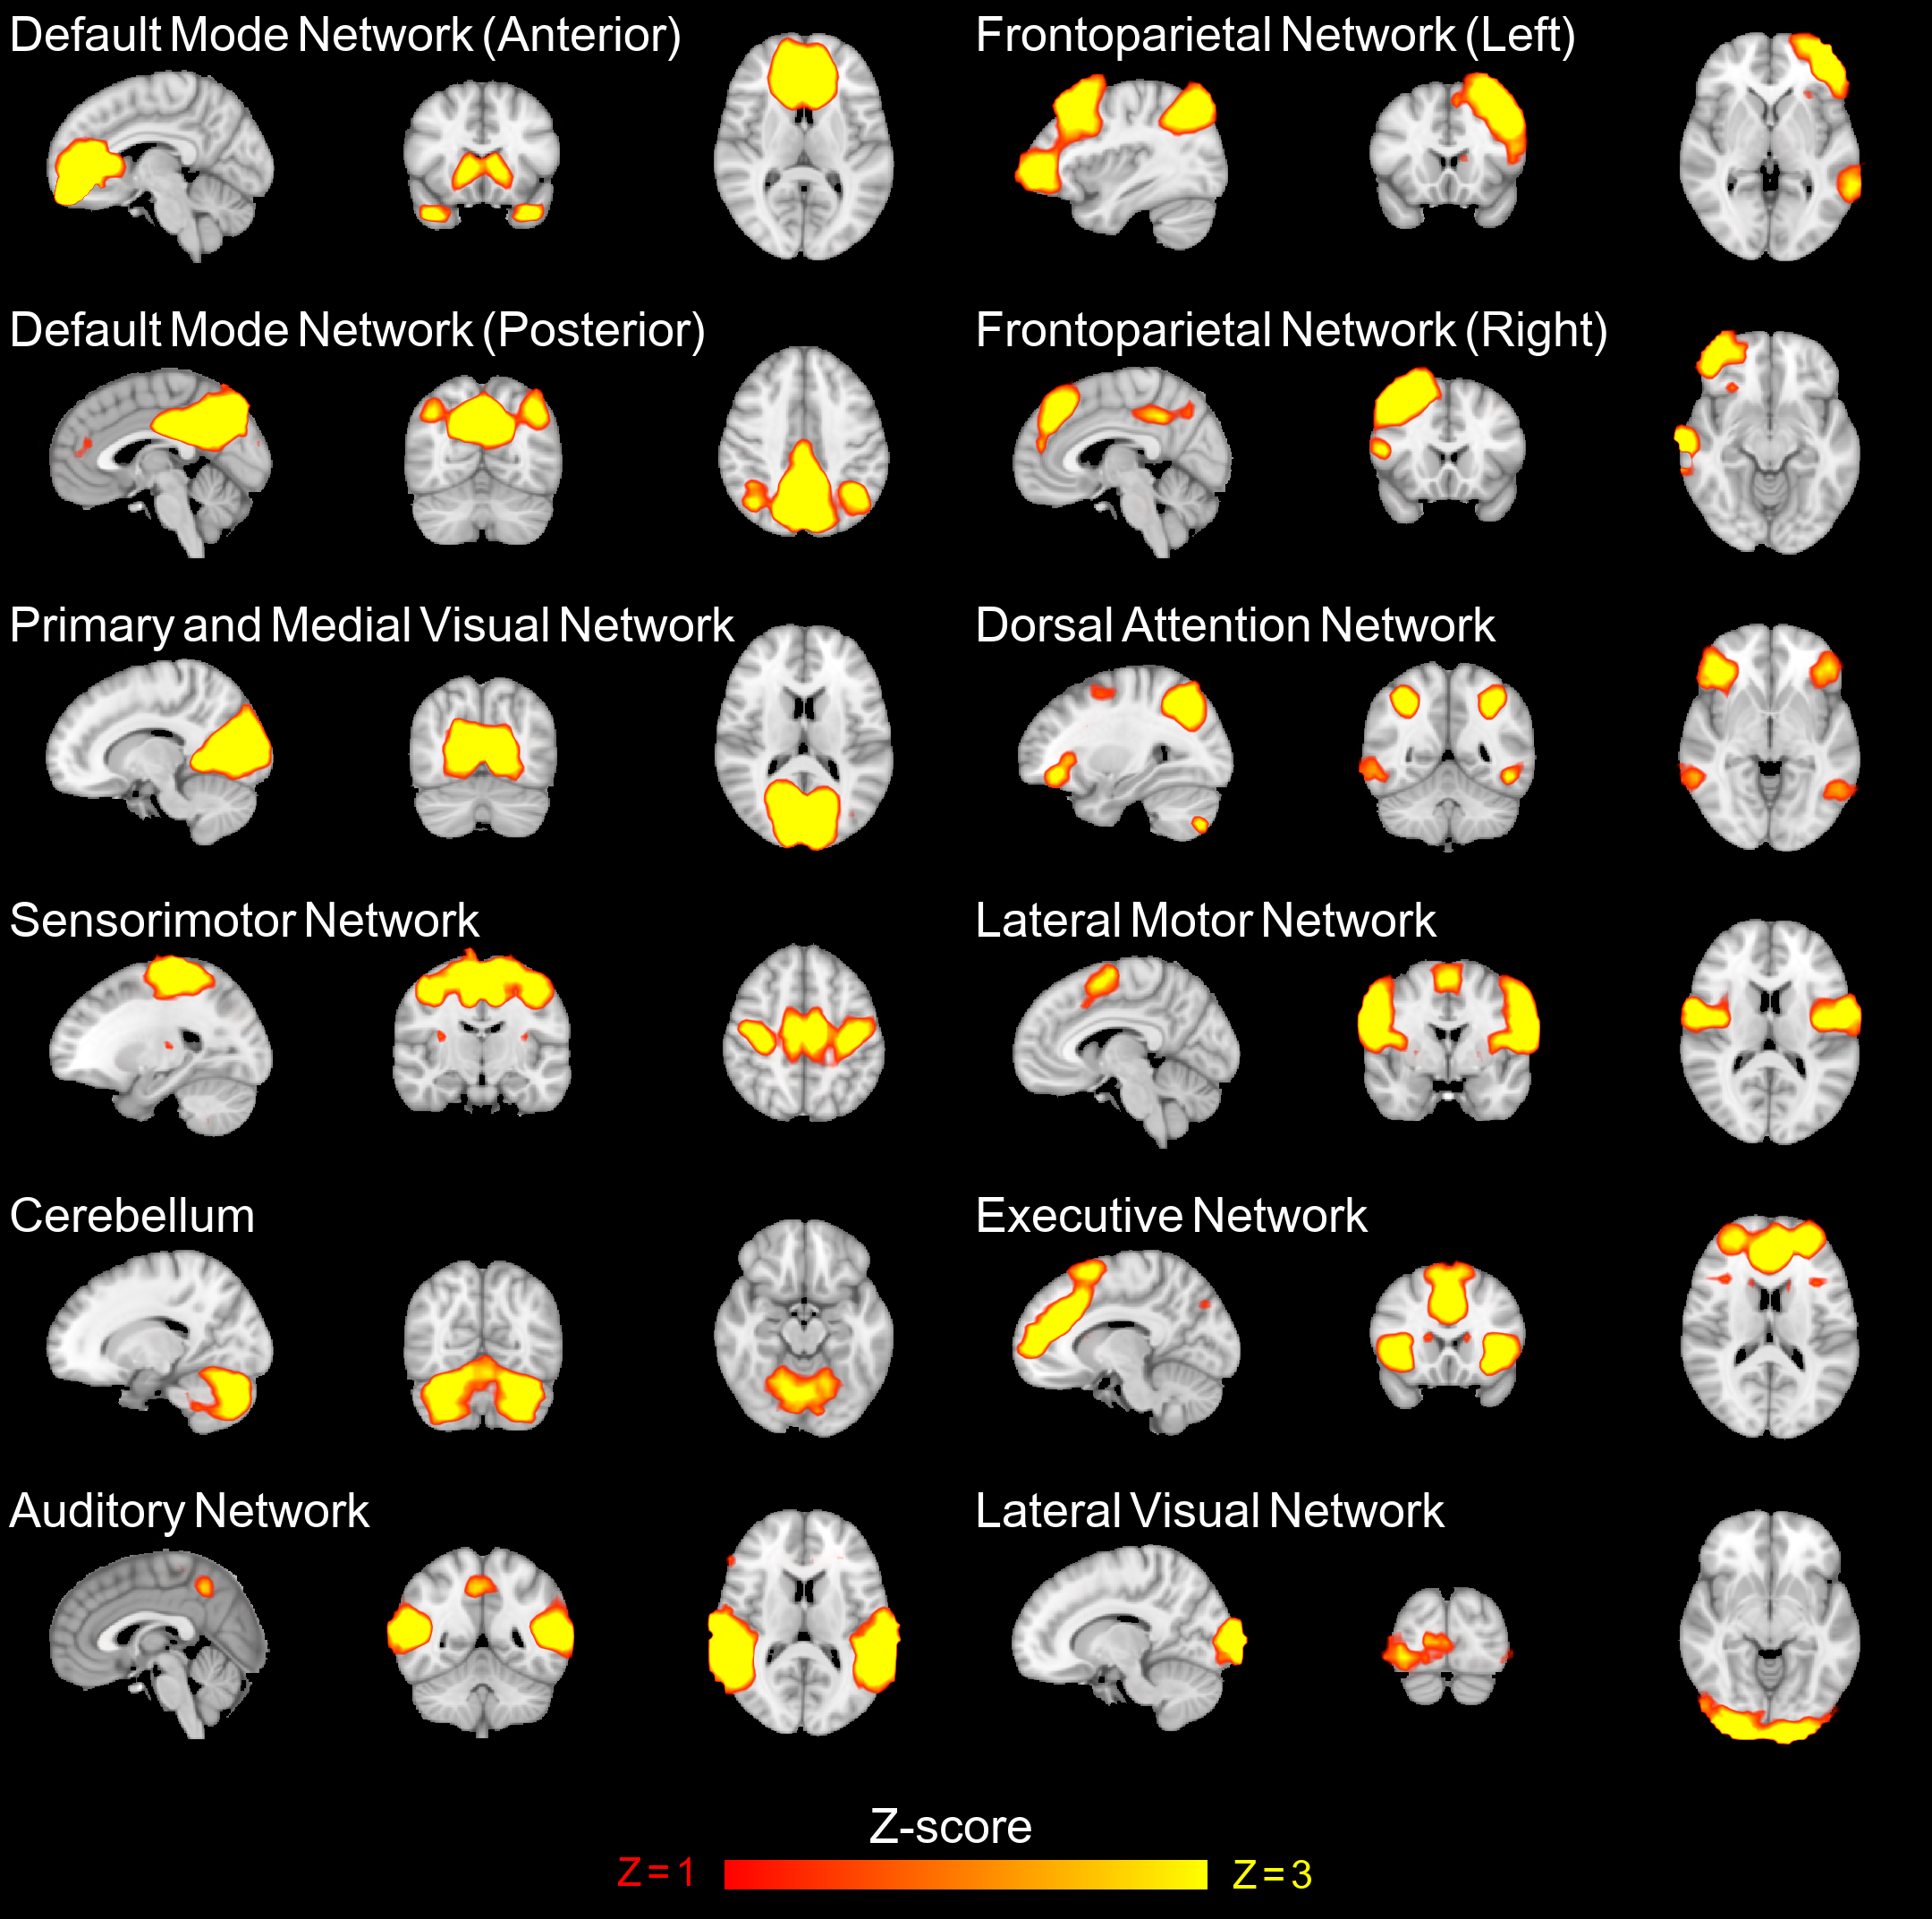
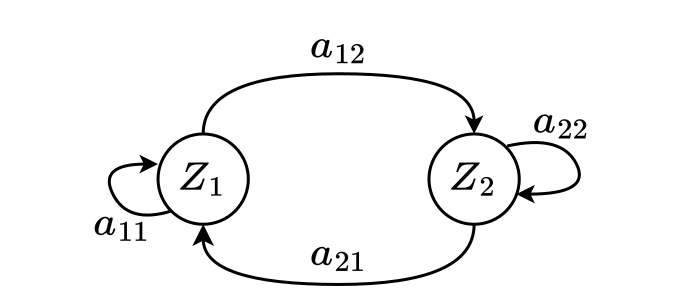
BOLD time series are adopted6, which represent the activity of each RSN (Fig. 1) in time per individual. Effective connections (matrix $$$A$$$) are estimated following sDCM’s neuronal-inspired model (Fig. 2). A hemodynamic model is used to generate a signal from $$$A$$$ based on assumed biophysical influences and noise. The generated signal is then assessed on what percentage of the variance of the observed BOLD signal it explains. The group-average effective connections $$$A_{MDD}$$$ and $$$A_{control}$$$ are obtained from each individual’s $$$A$$$ using Parametric Empirical Bayes12. Bayesian Model Reduction9 is used to eliminate non-contributing connections. The contributing effective connections are further reduced using Chi-Square feature selection. Multiple classifiers (SVM, KNN, Trees) are trained and validated using leave-one-out cross-validation (LOOCV) on 70% of the dataset. The trained and validated models are tested on the 30% hold-out data. The selected features are discussed with a neurologist for clinical interpretation.Results
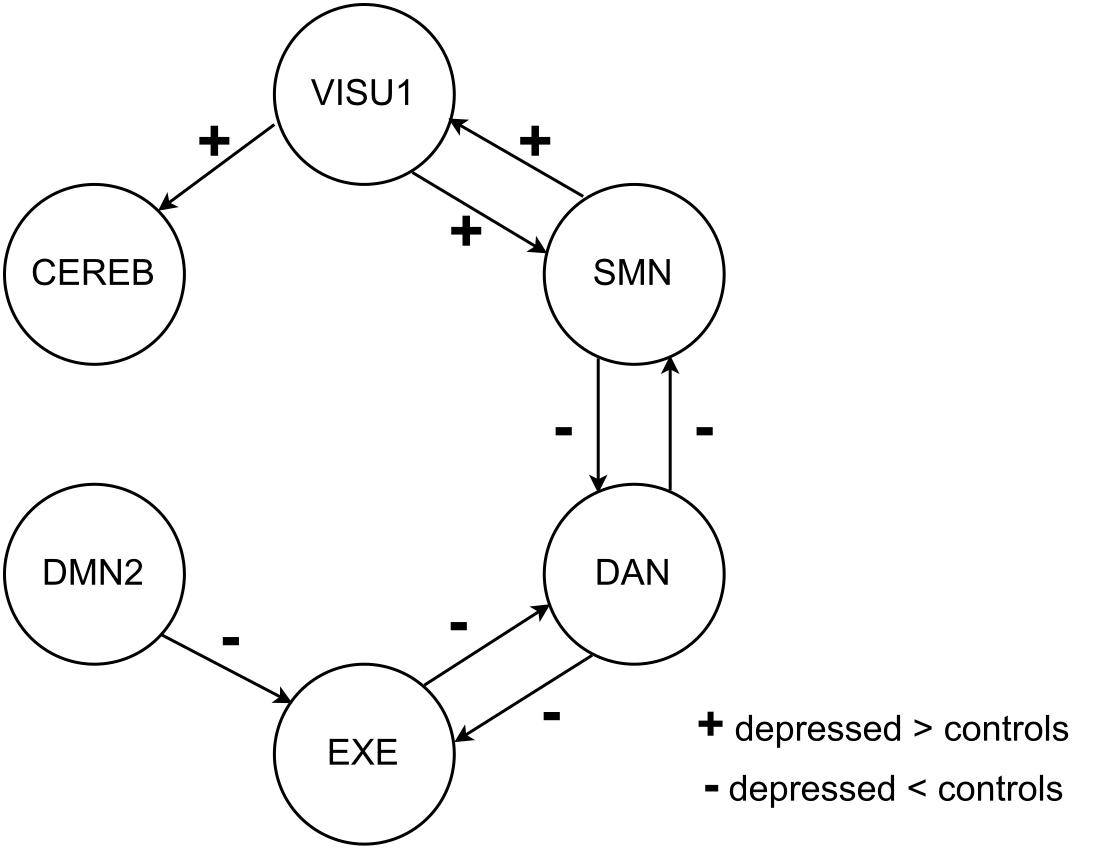
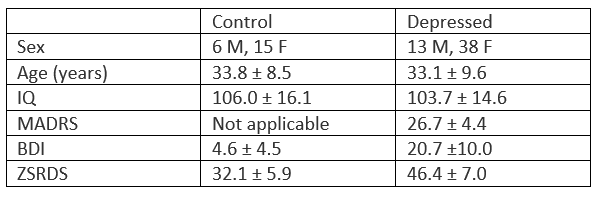
Analyses were performed using DCM12.5 in SPM12 for Matlab R2023a. The open-source dataset13 comprises 51 individuals with MDD and 21 healthy controls. Demographic and clinical data are listed in Table 1. The fitted sDCM models explained between 75% and 90% of the variance in the participant's BOLD signals, making them good models. Bayesian Model Reduction and Chi-Square feature selection resulted in eight effective connections that were consistently the most discriminative between the groups. These connections are shown in Fig. 3 and their weights are used for classification. The results of LOOCV and performance on the separate test set are listed in Table 2. A linear support vector machine performed best in LOOCV and obtained 100% accuracy on the test set.Discussion
While the results of the methodology are promising, they are obtained on a dataset that does not incorporate cross-site heterogeneity. MDD is a heterogeneous disorder and different MRI scan protocols may add further heterogeneity. Therefore, future work should investigate if (a subset of) the same effective connections (Fig. 3) can reproduce the discriminative ability shown in this study. What could indicate that these connections are in the right direction is clinical interpretation. Depressed people tend to lack initiation which can be linked to a lower excitatory connection between the default mode network and the executive network. Furthermore, inhibitory connections from and to the dorsal attention network can be linked to distractibility and a loss of pleasure in normal activities. The connection between the sensorimotor network and the dorsal attention network is not surprising as both relate to information processing. The cause and effect of MDD cannot be disentangled from these results, but the differences in connections are in line with part of the observations and symptoms of MDD2.Conclusion
The identified effective connections show clinical interpretability and the capability to discriminate between individuals with major depressive disorder and healthy controls. If the same effective connections can be reproduced on other datasets, this is a major stride toward an objective biomarker for major depressive disorder.Acknowledgements
No acknowledgement found.References
- Insel T, Cuthbert B, Garvey M, et al. Research domain criteria (RDoC): toward a new classification framework for research on mental disorders. American Journal of Psychiatry. 2010;167(7):748-751.
- American Psychiatric Association. Diagnostic and statistical manual of mental disorders: DSM-5. American Psychiatric Publishing; 2013.
- Wang L, Hermens DF, Hickie IB, et al. A systematic review of resting-state functional-MRI studies in major depression. Journal of Affective Disorders. 2012;142(1-3):6-12.
- Pilmeyer J, Huijbers W, Lamerichs R, et al. Functional MRI in major depressive disorder: A review of findings, limitations, and future prospects. Journal of Neuroimaging. 2022;32(4):582-595.
- Yang C, Xiao K, Ao Y, et al. The thalamus is the causal hub of intervention in patients with major depressive disorder: Evidence from the Granger causality analysis. NeuroImage: Clinical. 2022;103295.
- Cîrstian R, Pilmeyer J, Bernas A, et al. Objective biomarkers of depression: A study of Granger causality and wavelet coherence in resting‐state fMRI. Journal of Neuroimaging. 2023;33(3):404-414.
- Friston KJ, Harrison L, Penny W. Dynamic causal modelling. Neuroimage. 2003;19(4):1273-1302.
- Friston KJ, Kahan J, Biswal B, et al. A dcm for resting state fmri. Neuroimage. 2014;94:396-407.
- Li G, Liu Y, Zheng Y, et al. Large‐scale dynamic causal modeling of major depressive disorder based on resting‐state functional magnetic resonance imaging. Human Brain Mapping. 2020;41(4):865-881.
- Geng X, Xu J, Liu B, et al. Multivariate classification of major depressive disorder using the effective connectivity and functional connectivity. Frontiers in Neuroscience. 2018;12:38.
- Albrecht JS, Barbour L, Abariga S, et al. Risk of depression after traumatic brain injury in a large national sample. Journal of Neurotrauma. 2019;36(2):300-307.
- Zeidman P, Jafarian A, Seghier M, et al. A guide to group effective connectivity analysis, part 2: Second level analysis with PEB. Neuroimage. 2019;200:12-25.
- Bezmaternykh DD, Melnikov ME, Savelov AA, et al. Resting state with closed eyes for patients with depression and healthy participants. OpenNeuro. April 2020. https://openneuro.org/datasets/ds002748/versions/1.0.0. Accessed December 13, 2022.
Figures