5021
Increased Intracortical T1w/T2w Ratio in Patients with Chronic Schizophrenia1Medical Scientist Training Program, New York University. Grossman School of Medicine, New York, NY, United States, 2Bernard and Irene Schwartz Center for Biomedical Imaging, Department of Radiology, New York University Grossman School of Medicine, New York, NY, United States, 3Center for Advanced Imaging Innovation and Research (CAI2R), Department of Radiology, New York University Grossman School of Medicine, New York, NY, United States, 4Vilcek Institute of Graduate Biomedical Sciences, New York University Grossman School of Medicine, New York, NY, United States, 5SUNY Downstate Health Sciences University, New York, NY, United States
Synopsis
Keywords: Psychiatric Disorders, Psychiatric Disorders, Schizophrenia
Motivation: While dysmyelination is known to occur in white matter in schizophrenia, studies characterizing intracortical myelin in vivo are limited.
Goal(s): Our goal was to quantify intracortical myelin in chronic schizophrenia (SZ) vs. healthy controls (HC), and to correlate myelination with volumetric changes.
Approach: We used T1w/T2w ratio to map cortical myelin.
Results: We found decreased cortical volume but increased T1w/T2w ratio in frontal and temporal regions in SZ vs. HC. Apart from potentially increased ectopic myelin content, increased T1w/T2w in patients may also reflect iron deposition or presence of glial cells which contain high intracellular iron.
Impact: Characterizing intracortical myelin will help refine the dysmyelination hypothesis of schizophrenia. Our results in a chronic schizophrenia group support this hypothesis and further suggest potential abnormalities in cortical iron and glial cells.
Introduction
Schizophrenia has been proposed to be a disease of dysmyelination and dysconnectivity1,2. Genetic and post-mortem histologic studies of white matter in schizophrenia have demonstrated dysregulation of myelination-related genes, abnormalities in myelin, and decreased number of oligodendrocytes3,4. Diffusion tensor imaging studies found decreased fractional anisotropy of subcortical white matter in chronic but not first-episode schizophrenia relative to matched healthy controls, suggesting progressive demyelination in schizophrenia among other microstructural pathologies5,6. However, studies investigating grey matter myelin content in schizophrenia are more limited.Using quantitative magnetization transfer imaging, our group recently found cortical myelin abnormalities associated with disease duration8. T1-weighted (T1w)/T2-weighted (T2w) ratio is another method of mapping cortical myelin, by increasing myelin contrast-to-noise ratio9. Both increased and decreased T1w/T2w were reported to date in schizophrenia versus comparison healthy control (HC) participants. Lower T1w/T2w was found in both grey and white matter in schizophrenia vs. healthy controls, with lower T1w/T2w associated with more positive symptoms10. Increased T1w/T2w in first-episode psychosis patients was reported by Wei et al.11. The aim of this study was to use T1w/T2w and cortical volume to characterize changes in intracortical myelin in fifteen chronic schizophrenia (SZ) patients vs. nineteen healthy controls (HC). We hypothesized that there will be decreased T1w/T2w reflecting pathological demyelination in chronic schizophrenia.
Methods
Participants were right-handed males between 35-55 years old. All participants completed diagnostic testing by a neuropsychologist. Imaging was performed using a 12-channel coil on a 3T Trio Siemens whole-body scanner. T1w and T2w images were acquired using MP-RAGE and T2-SPACE sequences, respectively. Image processing was done using Freesurfer and FSL. We used the Desikan-Killiany atlas for cortical parcellation12. Mean T1w/T2w and volumes were calculated for 68 cortical regions using FreeSurfer. Statistical analysis and data visualization was done using RStudio. Between-groups differences in regional volume and mean T1w/T2w were assessed using independent sample t-tests. For each cortical region, Pearson’s correlations were used to assess the relationship between cortical volume and T1w/T2w. Tests were considered significant at p<0.01 and reaching trend level at p<0.05.Results
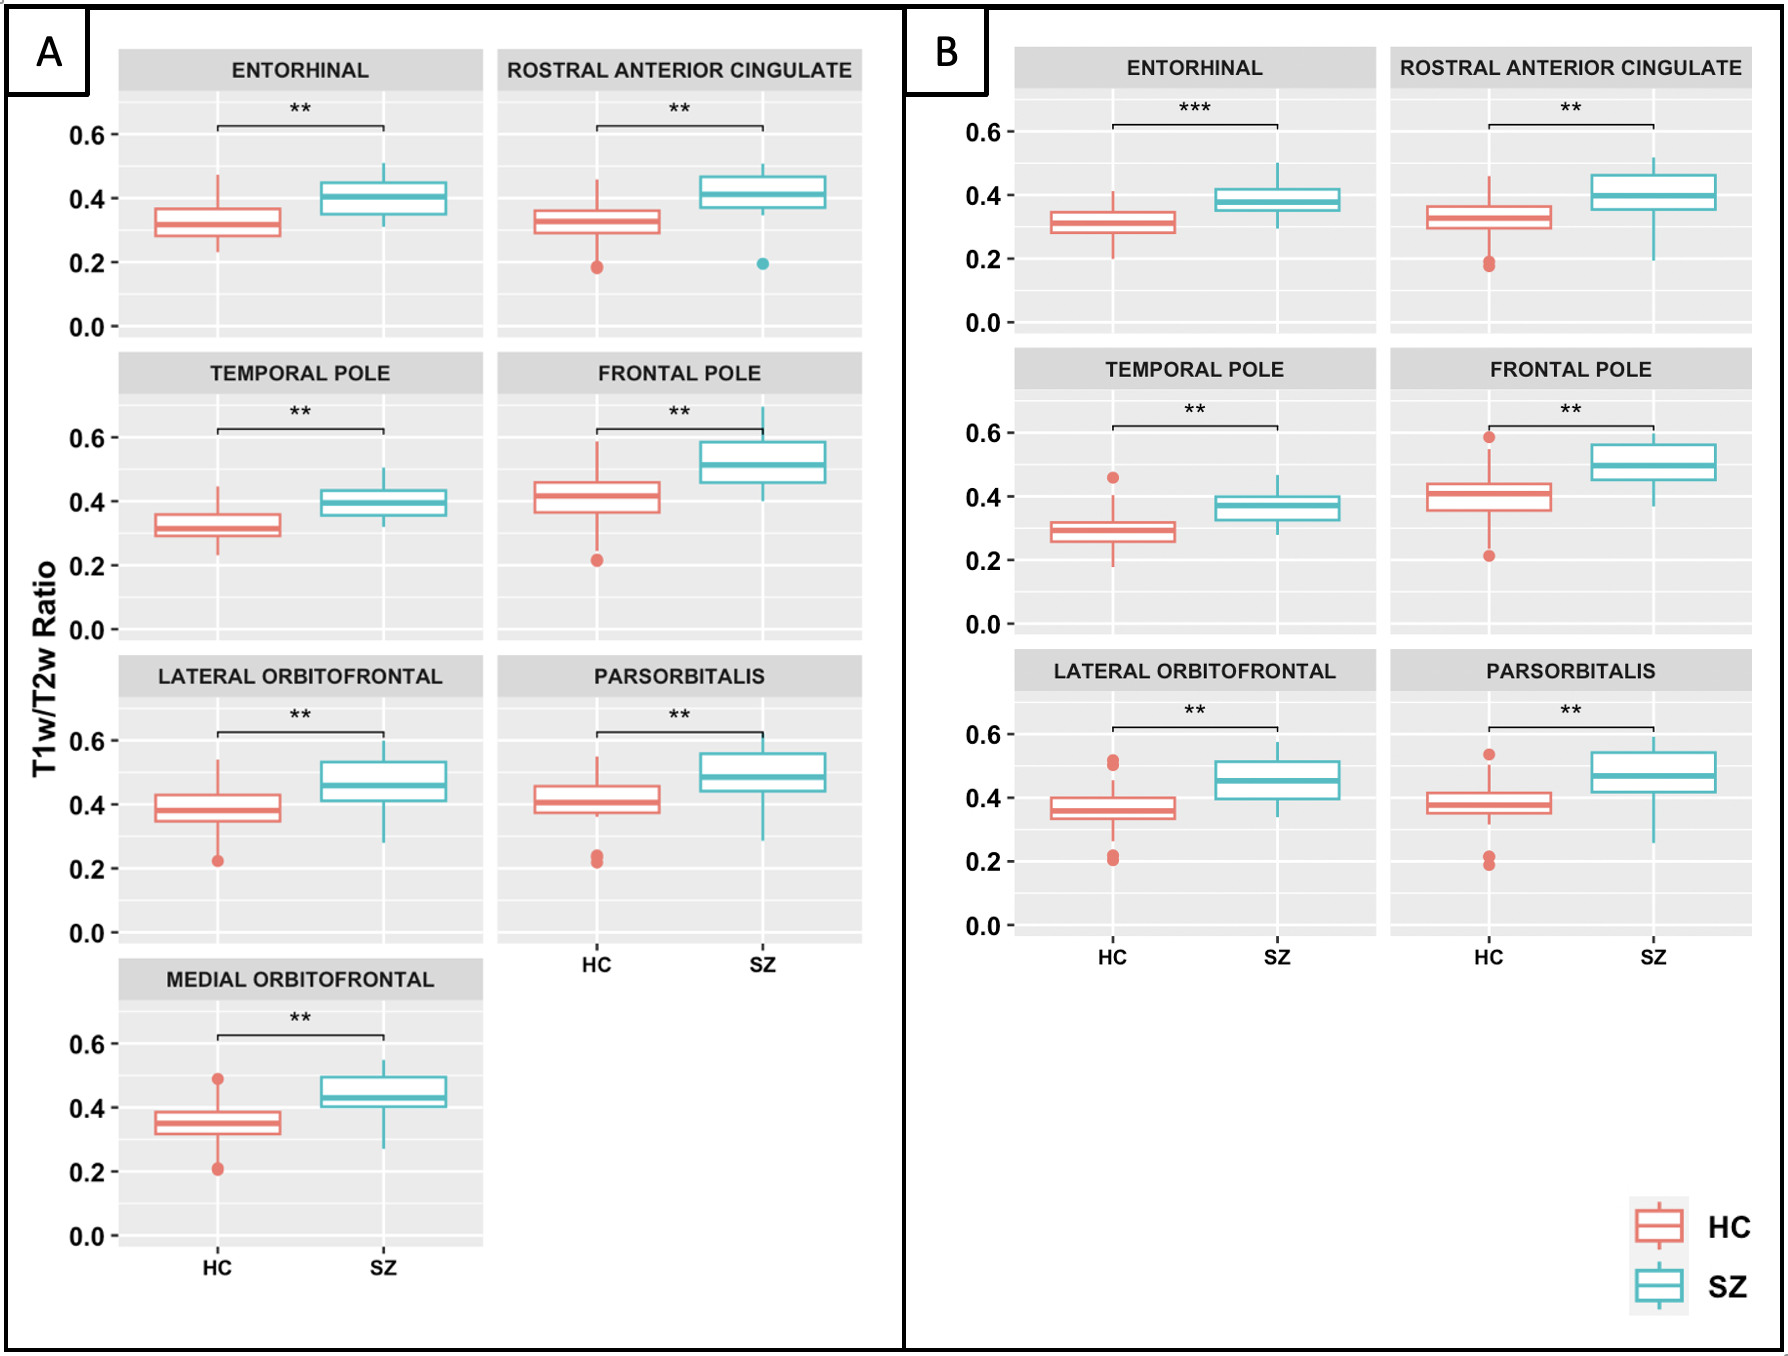
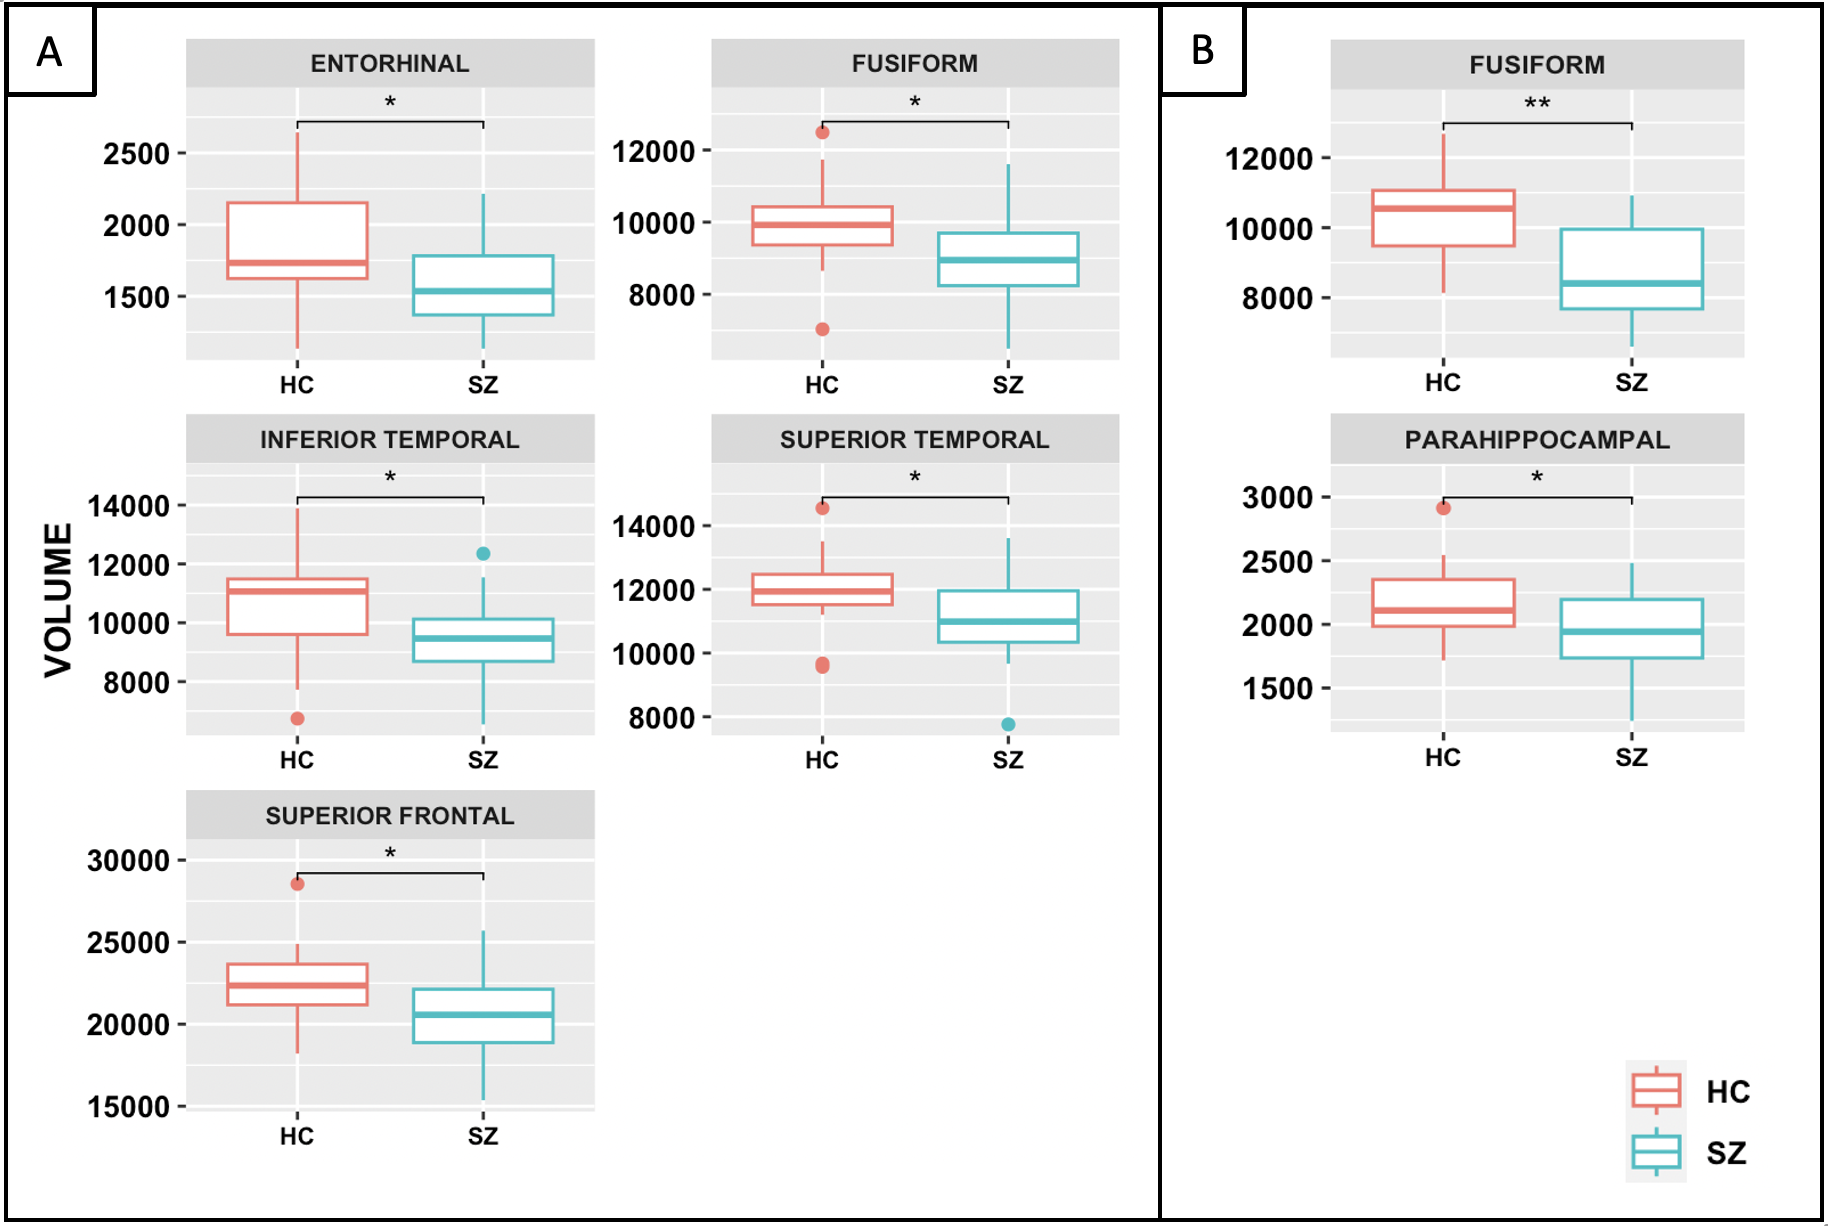
Mean T1w/T2w ratio was significantly increased in SZ vs. HC participants in temporal (bilateral entorhinal and temporal pole), frontal (bilateral orbitofrontal prefrontal cortices, parsorbitalis, and frontal pole), and rostral anterior cingulate cortical regions (p<0.01, Figure 1). Cortical volumes were decreased at trend level in SZ compared with HC in anterior temporal (left inferior and superior temporal gyri), medial temporal (bilateral fusiform and right parahippocampal gyri, left entorhinal cortex), and frontal cortical regions (left superior frontal gyrus) (p<0.05, Figure 2). Trend-level correlations (p<0.05) were found between volume and T1w/T2w ratio in the left paracentral (r=0.47), right postcentral (r=0.34), and right superior frontal (r=0.38) cortices.Discussion
Between-group differences in volume were found in temporal and prefrontal cortical regions consistent with previous literature on grey matter volumetric changes in schizophrenia13. Increased T1w/T2w ratio is an unexpected finding, but decreased overall cortical volumes suggest that myelin content may not necessarily be increased. Cortical volumes and T1w/T2w ratio were weakly correlated in only three regions, suggesting that differences in volumes and T1w/T2w between groups may reflect distinct processes.One possible explanation of our results is increased presence of ectopic myelin or intracellular myelin debris in glial cells. A post-mortem study demonstrated that microglia and astrocytes participate in phagocytosis of myelin in schizophrenia but not healthy control white matter2. Microglia were found to phagocytose myelin sheaths, and depletion of microglia led to excess myelin sheaths and ectopic spherical ensheathment of neuronal bodies in zebrafish14.
Alternatively, increased T1w/T2w might be caused by the presence of iron. Iron colocalizes with myelin in the cortex, and it decreases T2 and increases T1 relaxation times15. T1w/T2w was found to be positively correlated with amyloid deposition in cognitively normal subjects, with lower T1w/T2w in a high vs. low amyloid group16. The authors posited that iron attachment to amyloid plaques may perturb local fields to sufficiently affect tissue susceptibility and MR relaxation times. Increased T1w/T2w may also suggest the increased presence of local glial cells, which are normally iron-rich, possibly indicating active cortical remyelination17. Increased microglial activity in schizophrenia relative to healthy controls18 as well as the presence of activated astrocytes19 have been previously reported.
Conclusion
We found decreased volume and increased T1w/T2w in frontal and temporal cortical regions in patients with chronic schizophrenia. This may be evidence of the presence of ectopic myelin, cortical iron deposition, or increased local glial cells. Further studies are needed to examine these hypotheses.Acknowledgements
This work was supported in part by the National Institutes of Health awards R21MH085228, R01MH10896, 5T32GM136573, and was performed under the rubric of the Center for Advanced Imaging Innovation and Research (CAI2R, www.cai2r.net), an NIBIB National Center for Biomedical Imaging and Bioengineering (NIH P41 EB017183).References
- Mighdoll, M. I., Tao, R., Kleinman, J. E., & Hyde, T. M. (2015). Myelin, myelin-related disorders, and psychosis. Schizophrenia research, 161(1), 85-93.
- Uranova, N. A., Vikhreva, O. V., Rachmanova, V. I., & Orlovskaya, D. D. (2011). Ultrastructural alterations of myelinated fibers and oligodendrocytes in the prefrontal cortex in schizophrenia: a postmortem morphometric study. Schizophrenia research and treatment, 2011.
- Hakak, Y., Walker, J. R., Li, C., Wong, W. H., Davis, K. L., Buxbaum, J. D., ... & Fienberg, A. A. (2001). Genome-wide expression analysis reveals dysregulation of myelination-related genes in chronic schizophrenia. Proceedings of the National Academy of Sciences, 98(8), 4746-4751.
- Davis, K. L., Stewart, D. G., Friedman, J. I., Buchsbaum, M., Harvey, P. D., Hof, P. R., ... & Haroutunian, V. (2003). White matter changes in schizophrenia: evidence for myelin-related dysfunction. Archives of general psychiatry, 60(5), 443-456.
- Friedman, J. I., Tang, C., Carpenter, D., Buchsbaum, M., Schmeidler, J., Flanagan, L., ... & Davis, K. L. (2008). Diffusion tensor imaging findings in first-episode and chronic schizophrenia patients. American Journal of Psychiatry, 165(8), 1024-1032.
- Peters, B. D., Blaas, J., & de Haan, L. (2010). Diffusion tensor imaging in the early phase of schizophrenia: what have we learned?. Journal of psychiatric research, 44(15), 993-1004.
- Albert, M., Antel, J., Brück, W., & Stadelmann, C. (2007). Extensive cortical remyelination in patients with chronic multiple sclerosis. Brain pathology, 17(2), 129-138.
- Sui, Y. V., Bertisch, H., Lee, H. H., Storey, P., Babb, J. S., Goff, D. C., ... & Lazar, M. (2021). Quantitative macromolecular proton fraction mapping reveals altered cortical myelin profile in schizophrenia spectrum disorders. Cerebral Cortex Communications, 2(2), tgab015.
- Glasser, M. F., & Van Essen, D. C. (2011). Mapping human cortical areas in vivo based on myelin content as revealed by T1-and T2-weighted MRI. Journal of neuroscience, 31(32), 11597-11616.
- Iwatani, J., Ishida, T., Donishi, T., Ukai, S., Shinosaki, K., Terada, M., & Kaneoke, Y. (2015). Use of T1‐weighted/T2‐weighted magnetic resonance ratio images to elucidate changes in the schizophrenic brain. Brain and behavior, 5(10), e00399.
- Wei, W., Zhang, Y., Li, Y., Meng, Y., Li, M., Wang, Q., ... & Li, T. (2020). Depth‐dependent abnormal cortical myelination in first‐episode treatment‐naïve schizophrenia. Human brain mapping, 41(10), 2782-2793.
- Desikan RS, Segonne F, Fischl B, Quinn BT, Dickerson BC, Blacker D, ... Killiany RJ, 2006. An automated labeling system for subdividing the human cerebral cortex on MRI scans into gyral based regions of interest. Neuroimage 31 (3), 968-980. do: 10.1016/j. neuroimage.2006.01.021.
- Levitt, J. J., Bobrow, L., Lucia, D., & Srinivasan, P. (2010). A selective review of volumetric and morphometric imaging in schizophrenia. Behavioral neurobiology of schizophrenia and its treatment, 243-281.
- Hughes, A. N., & Appel, B. (2020). Microglia phagocytose myelin sheaths to modify developmental myelination. Nature neuroscience, 23(9), 1055-1066.
- Fukunaga, M., Li, T. Q., van Gelderen, P., de Zwart, J. A., Shmueli, K., Yao, B., ... & Duyn, J. H. (2010). Layer-specific variation of iron content in cerebral cortex as a source of MRI contrast. Proceedings of the National Academy of Sciences, 107(8), 3834-3839.
- Yasuno, F., Kazui, H., Morita, N., Kajimoto, K., Ihara, M., Taguchi, A., ... & Nagatsuka, K. (2017). Use of T1-weighted/T2-weighted magnetic resonance ratio to elucidate changes due to amyloid β accumulation in cognitively normal subjects. NeuroImage: Clinical, 13, 209-214.
- Reinert, A., Morawski, M., Seeger, J., Arendt, T., & Reinert, T. (2019). Iron concentrations in neurons and glial cells with estimates on ferritin concentrations. BMC neuroscience, 20(1), 1-14.
- Bloomfield, P. S., Selvaraj, S., Veronese, M., Rizzo, G., Bertoldo, A., Owen, D. R., ... & Howes, O. D. (2016). Microglial activity in people at ultra-high risk of psychosis and in schizophrenia: an [11C] PBR28 PET brain imaging study. American Journal of Psychiatry, 173(1), 44-52.
- Catts, V. S., Wong, J., Fillman, S. G., Fung, S. J., & Shannon Weickert, C. (2014). Increased expression of astrocyte markers in schizophrenia: association with neuroinflammation. Australian & New Zealand Journal of Psychiatry, 48(8), 722-734.
- Bartzokis, G. (2011). Neuroglialpharmacology: white matter pathophysiologies and psychiatric treatments. Frontiers in Bioscience-Landmark, 16(7), 2695-2733.
- McKenna, F. F., Miles, L., Babb, J. S., Goff, D. C., & Lazar, M. (2019). Diffusion kurtosis imaging of gray matter in schizophrenia. Cortex, 121, 201-224.
Figures