5019
Medial temporal lobe grey and white matter differences in late-life depression: a combined structural and multi-shell diffusion MRI analysis1KU Leuven, Leuven, Belgium
Synopsis
Keywords: Psychiatric Disorders, Diffusion/other diffusion imaging techniques
Motivation: Multi-tissue characterization of structural alterations in late-life depression (LLD) is mainly based on structural MRI and diffusion tensor imaging.
Goal(s): To investigate medial temporal lobe (MTL)-related structural alterations using advanced diffusion MRI (dMRI) models and their association with MTL grey matter (GM) volume.
Approach: Multi-shell dMRI using constrained spherical deconvolution probabilistic tractography, diffusion kurtosis imaging and fixel-based analysis to investigate alterations in the uncinate fasciculus, cingulum bundle, and fornix.
Results: Compared to controls, LLD patients showed differences in multiple dMRI metrics, with lower mean kurtosis in the uncinate fasciculus and fornix being correlated with lower MTL GM volume.
Impact: Advanced multi-shell diffusion MRI modelling can identify subtle white matter microstructural differences in late-life depression. Using multimodal MRI to investigate grey and white matter differences holistically in the same population can further our understanding of the neurobiology of psychiatric disorders.
INTRODUCTION
Major depressive disorder in people aged over 60 years is described as late-life depression (LLD). The most consistently reported brain abnormalities in LLD include lower grey matter (GM) volume in the medial temporal lobe (MTL) and increased white matter (WM) lesions with some studies reporting differences in diffusion tensor imaging (DTI) metrics [1]. The relationship between GM and WM microstructural alterations in patients with LLD is unclear. Here we characterize MTL structural differences in LLD more precisely using advanced diffusion magnetic resonance imaging (dMRI) models to overcome some limitations of the DTI model and investigate associations between GM and WM differences in patients with LLD.METHODS
3D T1w structural MRI data (1 mm3 resolution) and multishell dMRI (2.5 mm3 resolution; b-values 0, 700, 1000 and 2000 s/mm2 with 12, 20, 32 and 60 isotropically distributed gradient directions respectively) were collected in 68 participants from the Leuven Late-Life Depression Study [2]: 31 patients with LLD (mean age 72.2 years; 21 female; mean Geriatric Depression Score, GDS 21.1; mean Mini-Mental State Examination, MMSE score 25.9) and 37 non-depressed controls (mean age 70.6 years, 22 female, mean GDS score 2.7; mean MMSE score 28.9). To assess GM volume differences between LLD and controls we used an independent t-test applied to CAT12- derived left and right hemisphere MTL volumes (summed hippocampus and amygdala volume defined by the Neuromorphometrics Atlas and normalized using total intracranial volume). To assess WM microstructural differences, we performed bundle-specific analysis of apparent fibre density and fibre density cross-section using MRTrix3 and diffusion kurtosis imaging (DKI) metrics: mean (MK), axial (AK) and radial kurtosis (RK) using DIPY in three MTL-related WM bundles bilaterally: the uncinate fasciculus (UF), cingulum, and fornix, reconstructed using constrained spherical deconvolution tractography [5]. We used fixel-based and voxel-based analyses with family wise error (FWE) correction using connectivity-based fixel enhancement and threshold-free cluster enhancement (TFCE) respectively to assess group differences in the metrics. WM lesions were excluded from the analyses. Associations between MTL volume and dMRI measures were assessed using a partial correlation analysis including age as a covariate.RESULTS
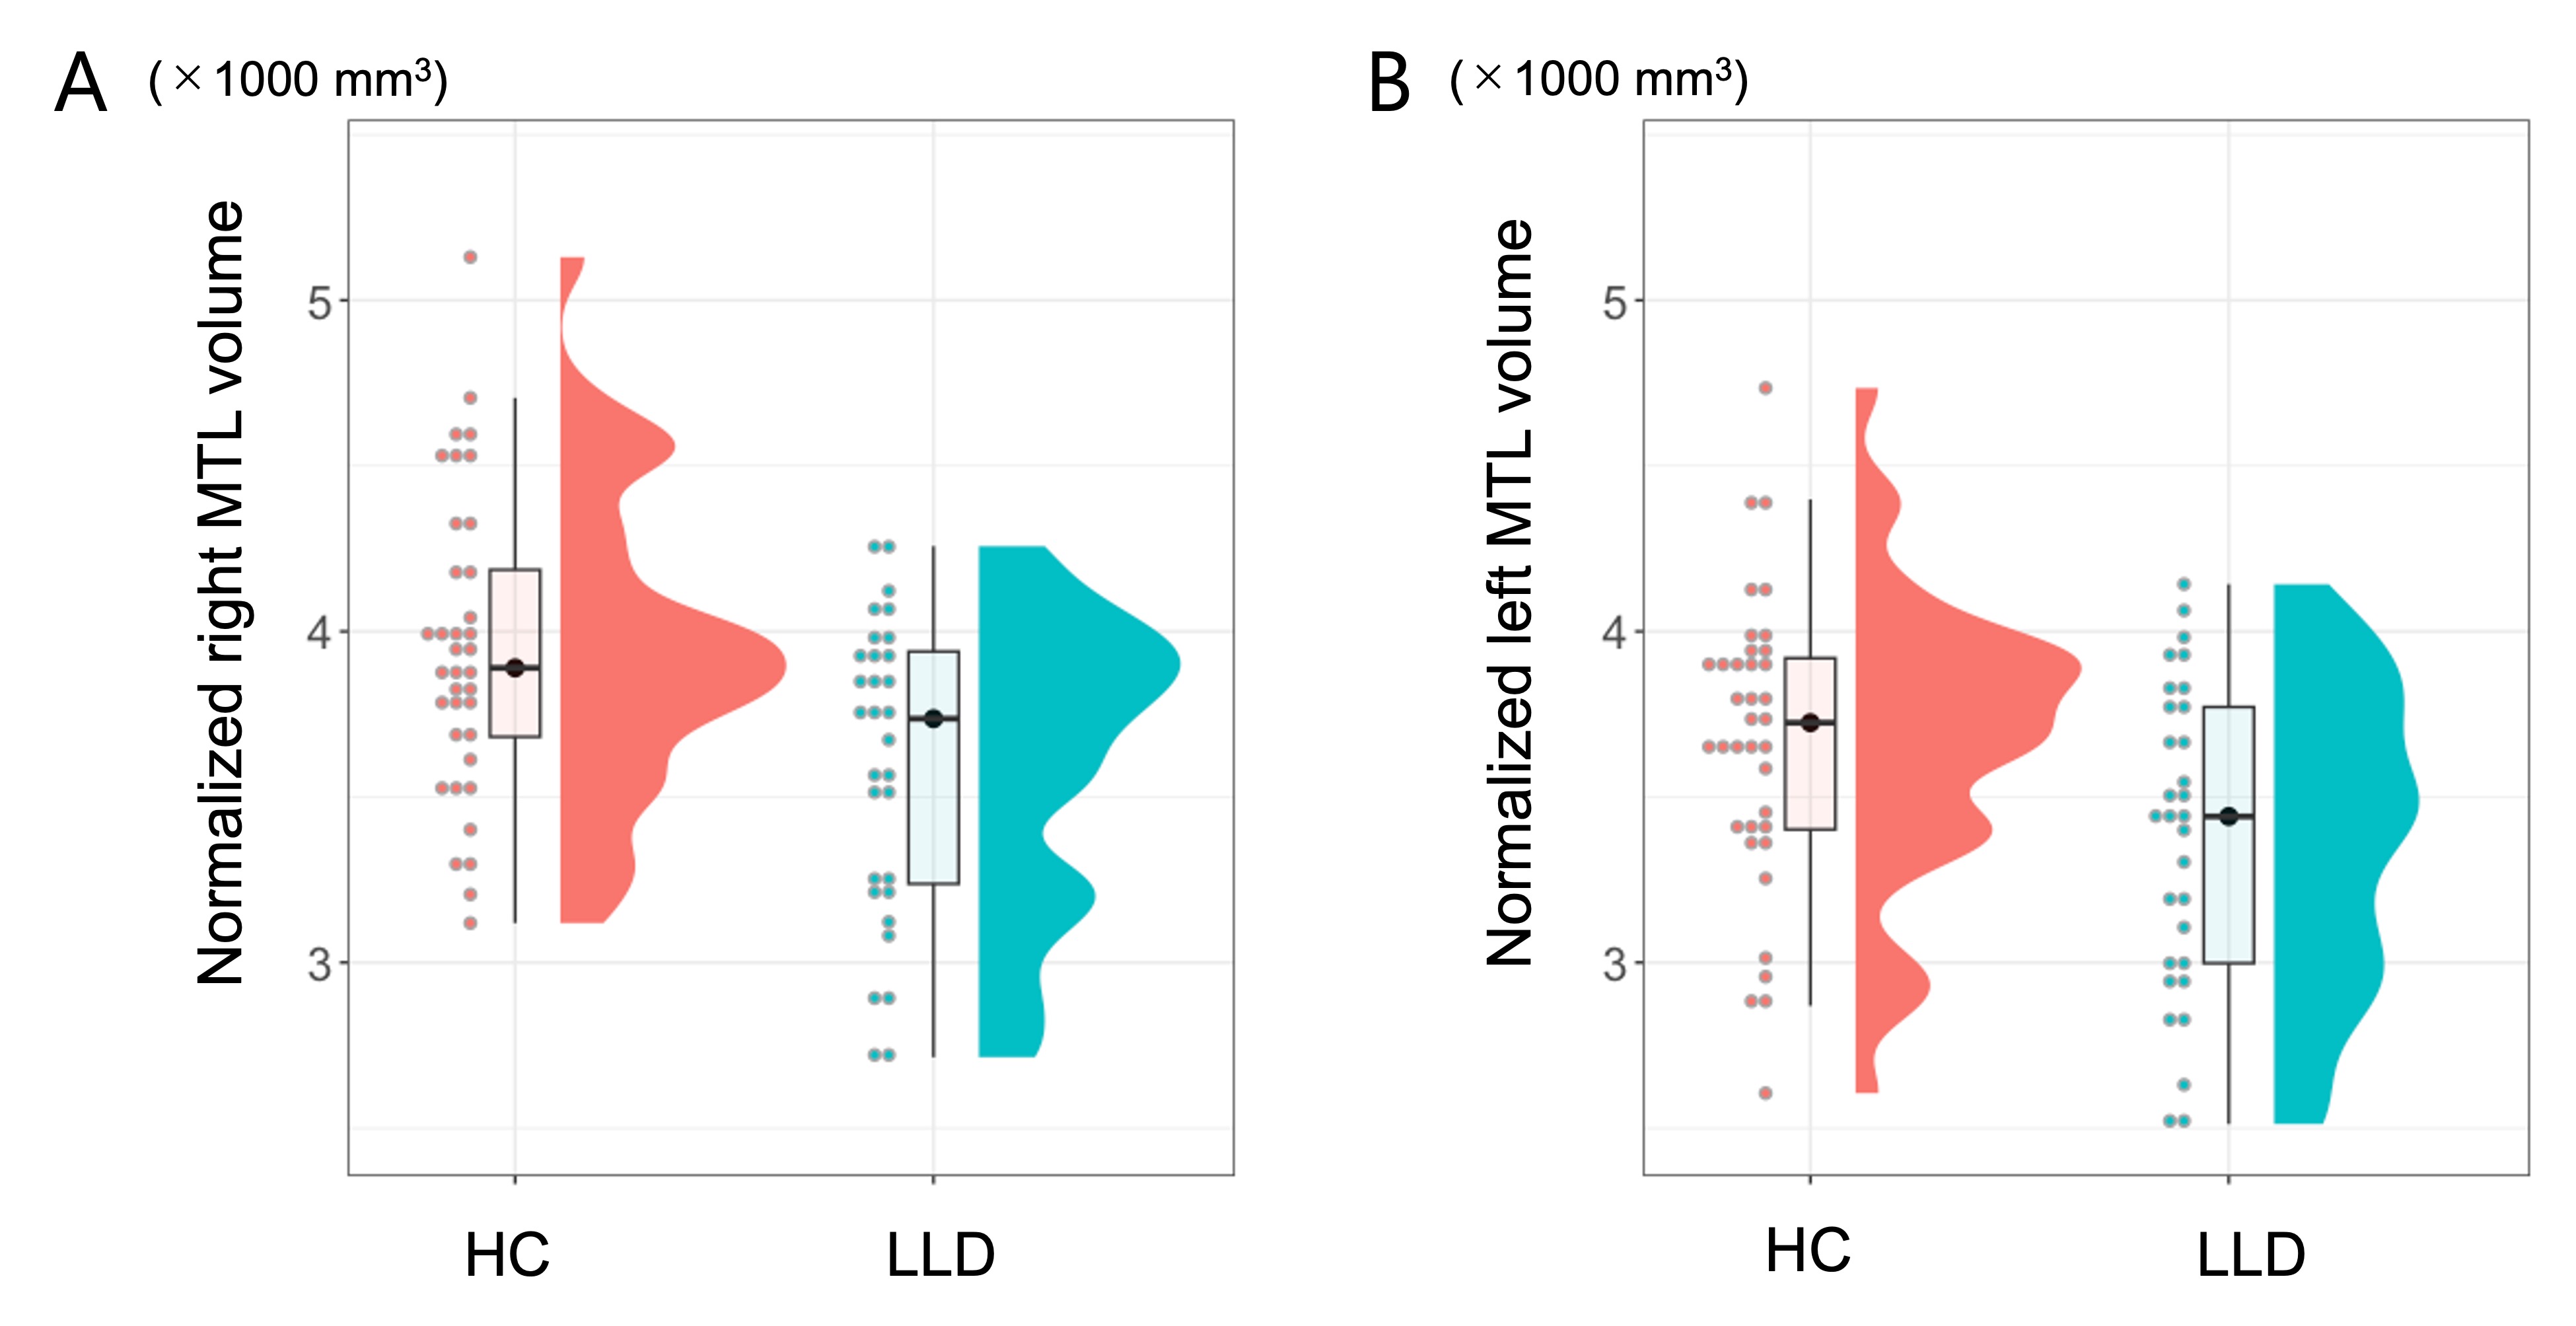
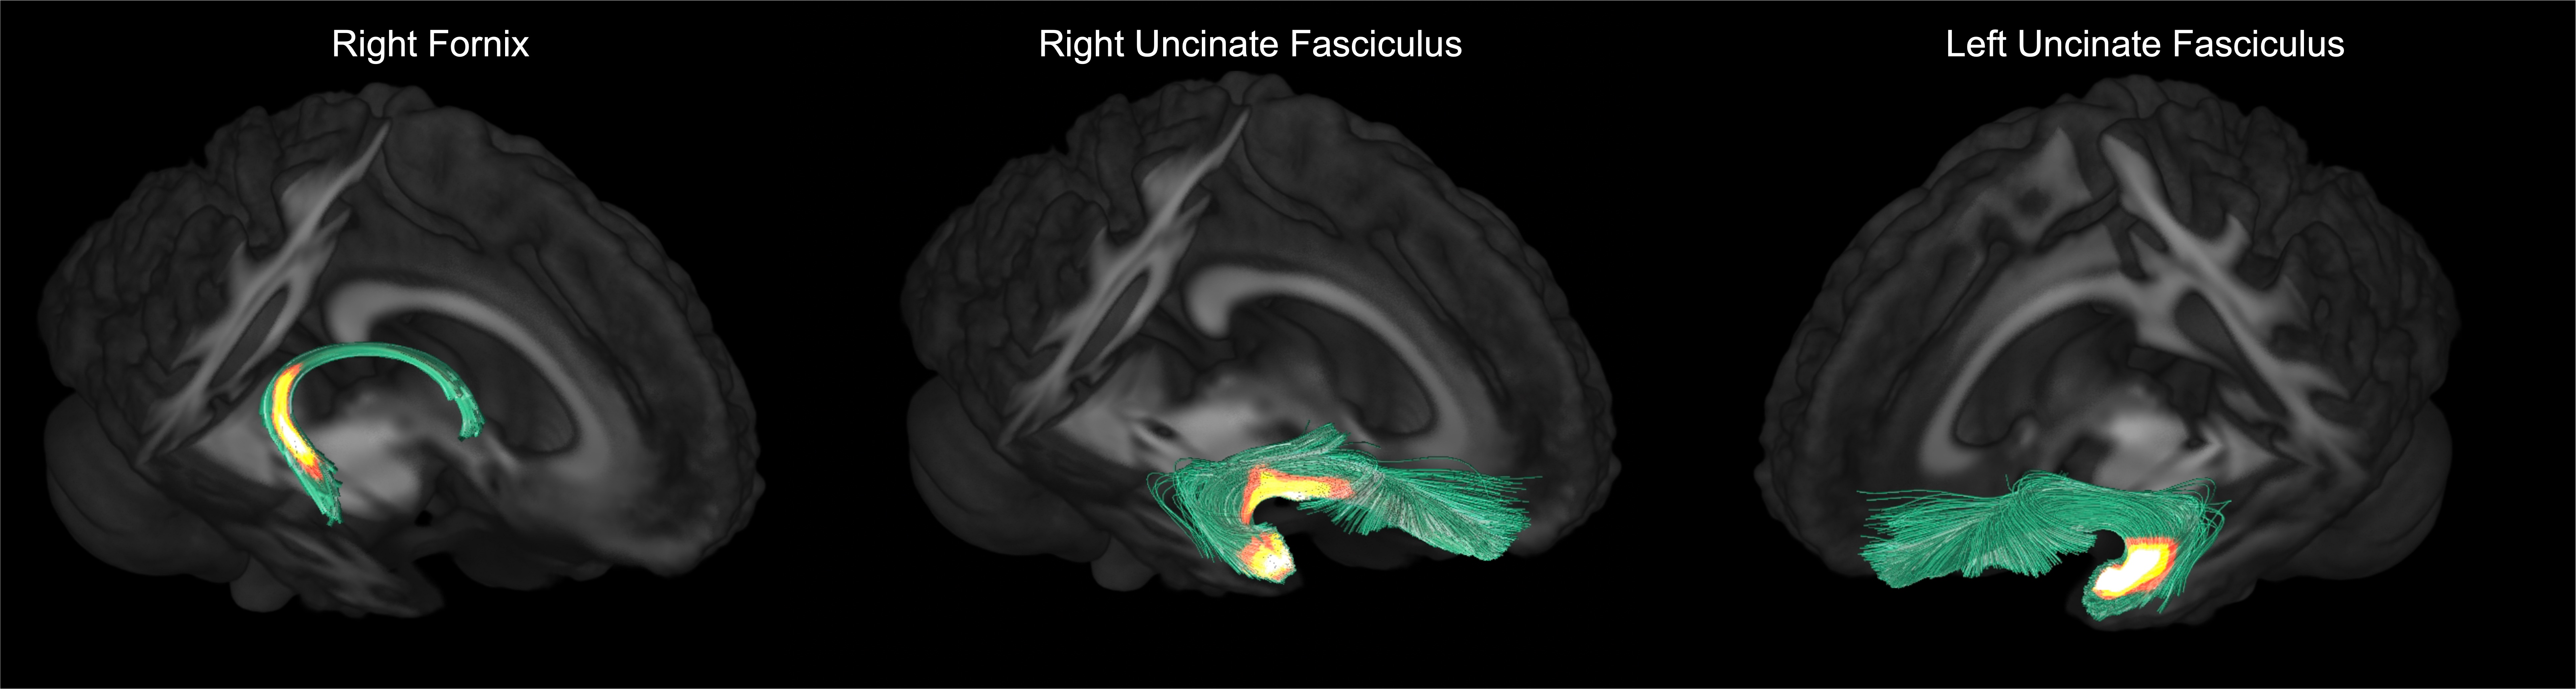
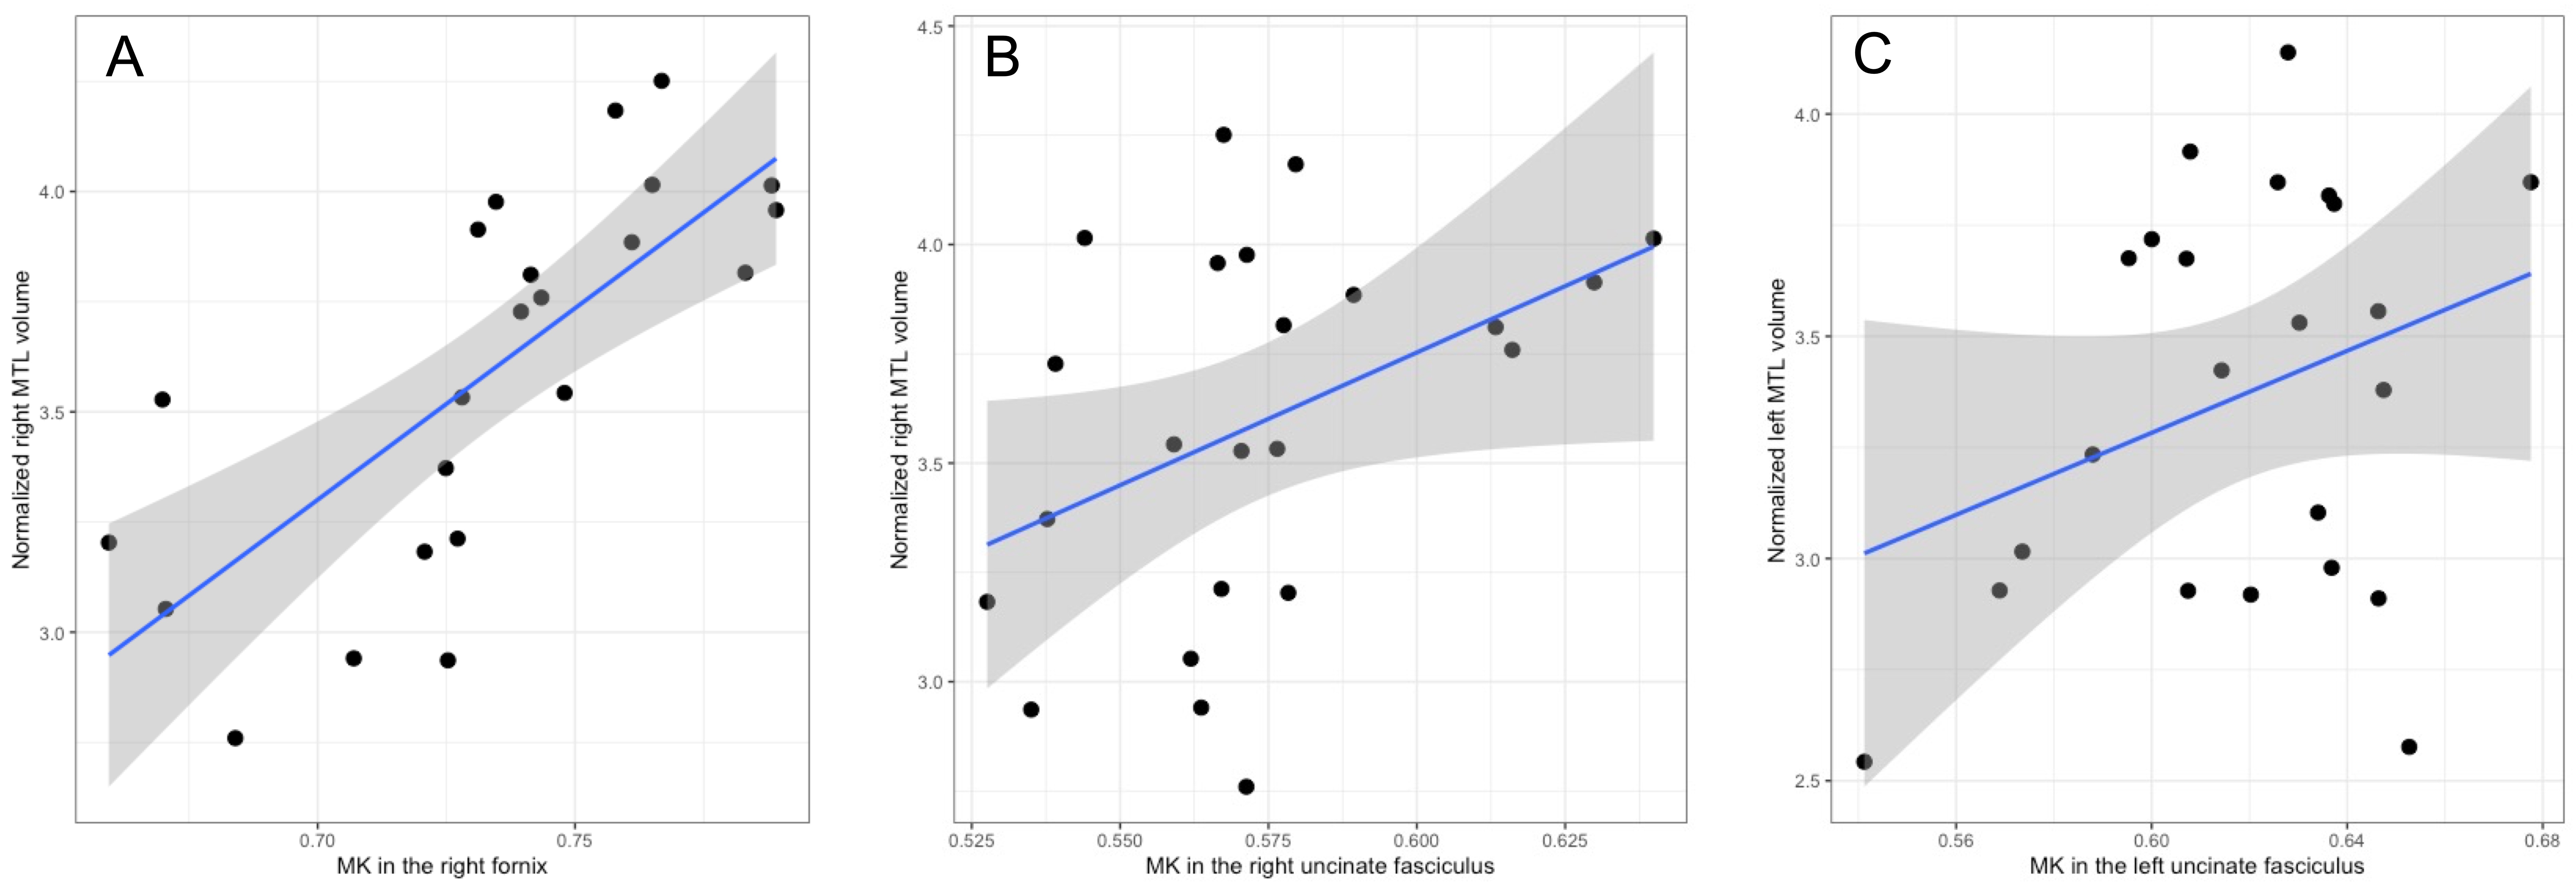
Compared with controls, normalized MTL volumes were significantly lower in patients with LLD in both the right (t=3.2, p=0.002; Cohen’s d=0.77) and left (t=2.6, p=0.01; Cohen’s d=0.63) hemisphere (Fig 1A and 1B). LLD participants had significantly lower MK, AK and RK in the UF and right fornix compared to controls. AK and RK were also lower in the left cingulum (Fig 2.) There were no significant group differences in fixel-based metrics. In patients with LLD, normalized right MTL volume was positively correlated with MK in the right fornix (p <0.001) (Fig3A), and MK in the right UF (p=0.03) (Fig 3B) but not left UF (p=0.16) (Fig 3C).DISCUSSION
Our results confirm and extend previous findings of altered MTL structure in LLD, and demonstrate the utility of advanced multishell dMRI for detecting disease-related differences in a relatively small sample. Moreover, they show a potential link between altered MTL WM microstructure and lower GM volume. Accelerated and pathological brain ageing are proposed pathophysiological mechanisms underlying LLD [6]. As long-range axons form continuous structural connections between the MTL and (sub)cortical regions in the limbic system, neurodegenerative processes resulting in axonal damage could therefore lower GM volume in these regions. However, recent work suggests only a minority of the interareal axons that comprise the bulk of white matter form direct long-range connections between functionally-linked cortical areas [7]. Accelerated biological ageing could conceivably damage interareal axons at any point along a fasciculus. This could explain both the inconsistent findings in the localization of WM differences in LLD and contribute to differences in clinical phenotype. Future work using whole brain structural connectivity analyses incorporating PET-MRI measures of synaptic density, tau, myelin content and cerebrovascular disease burden will further characterize the relationships between GM and WM structure, biological ageing and clinical characteristics in LLD.CONCLUSIONS
LLD is associated with lower MTL volume and altered WM microstructure in MTL-related frontolimbic WM bundles. Multimodal, multi-tissue characterization of brain structure can provide new insights into the neurobiology of late life depression.Acknowledgements
This study was supported by Research Foundation Flanders (FWO grant, FWO/G0C0319N), KU Leuven internal C2 funding (C24-18-095) and the Sequoia Fund for Research on Age and Mental health.References
[1] Kim, Y.K., and Han, K.M., 2021. Neural substrates for late-life depression: A selective review of structural T neuroimaging studies. Prog Neuropsychopharmacol Biol Psychiatry. 104, 110010.
[2] Emsell L, Laroy M, Van Cauwenberge M, Vande Casteele T Vansteelandt K, Van Laere K, Sunaert S, Van den Stock J, Bouckaert F, Vandenbulcke M. 2021. The Leuven late life depression (L3D) study: PET-MRI biomarkers of pathological brain ageing in late-life depression: study protocol. BMC Psychiatry. 21 (1): 64.
[3] Sexton, C.E., Mackay, C.E., Ebmeier, K.P., 2013. A systematic review and meta-analysis of magnetic resonance imaging studies in late-life depression. Am J Geriatr Psychiatry. 21(2), 184–195.
[4] De Winter, F-L., Emsell, L., Bouckaert, F., Claes, L., Jain, S., Farrar, G., Billiet, T., Evers, S., Van den Stock, J., Sienaert, P., Obbels, J., Sunaert, S., Adamczuk, K., Vandenberghe, R., Van Laere, K., Vandenbulcke, M. 2017. No Association of Lower Hippocampal Volume With Alzheimer's Disease Pathology in Late-Life Depression. Am J Psychiatry. 174 (3), 237–245.
[5] Radwan, A.M., Sunaert, S., Schilling, K., Descoteaux, M., Landman, B.A., Vandenbulcke, M., Theys, T., Dupont, P., Emsell, L. 2022. An atlas of white matter anatomy, its variability, and reproducibility based on constrained spherical deconvolution of diffusion MRI. Neuroimage. 254, 119029.
[6] Szymkowicz SM, Gerlach AR, Homiack D, Taylor WD. 2023. Biological factors influencing depression in later life: role of aging processes and treatment implications. 13 (1): 160.
[7] Rosen BQ, Halgren E. 2022. An estimation of the absolute number of axons indicates that human cortical areas are sparsely connected. PLoS Biol. 20 (3), e3001575
Figures