5015
LiverMap®: the choice for screening the onset and progression of chronic liver conditions1Body Digital Pte Ltd, Singapore, Singapore, 2Institute of Radiology - Abdominal Imaging, University of Sao Paulo, Sao Paulo, Brazil, 3MRI Studio Pty Ltd, Perth, Australia
Synopsis
Keywords: Liver, Liver
Motivation: MRI methods for screening onset of fatty liver disease are lacking owing to the inability to isolate the earliest grades of inflammation, ballooning and fibrosis.
Goal(s): To demonstrate the validity and reproducibility of liver multi-component relaxometry (LiverMap®) in screening onset of liver pathologies at both 1.5T and 3.0T.
Approach: Patient cohorts comprised a validation cohort with 106 biopsy-proven MASLD patients and 16 healthy volunteers, and a reproducibility cohort of 30 volunteers with and without MASLD.
Results: LiverMap® distinguished the onset of liver pathologies with AUROCs above 0.94, a repeatability CoV of 1.7%, and a reproducibility CoV of 3.5%.
Impact: LiverMap® is a new approach to screen and monitor progression of chronic liver conditions in ~10 minutes scan time. In metabolic associated steatohepatitis, LiverMap® reliably distinguishes the onset of five key liver pathologies - fat, iron, inflammation, ballooning and fibrosis.
Introduction
Chronic liver conditions exhibit several pathological features that challenge the ability of current MRI techniques to identify the early onset of disease owing to persistent inflammation. For instance, metabolic dysfunction associated steatotic liver disease (MASLD) manifests initial inflammation and ballooning before fibrosis. However, current MRI methods are tuned to fibrosis quantification, overlooking early inflammatory and ballooning indicatators1-3.This abstract introduces LiverMap®, a validated and reproducible multi-component relaxometry technique for the liver, capable of detecting subtle changes in cellular microarchitecture and providing unique biomarkers for early detection of inflammation, ballooning and fibrosis.
Methods
Patient cohorts:Validity and reproducibility of LiverMap® for fatty liver disease assessment was performed on two patient cohorts. Validation of LiverMap® for mapping fat, iron, fibrosis, lobular inflammation, and ballooning was assessed on a patient cohort of 106 biopsy-proven MASLD patients plus 16 healthy volunteers. Repeatability and reproducibility were assessed on 30 volunteers with and without MASLD, with repeatability assessed on the same 3.0T scanner one week apart, and reproducibility against a 1.5T scanner on the same day.
Scanning protocol:
Multi-echo imaging was used to sample both gradient echo and spin echo decay curves in the liver. For quantification of fat and iron, a spoiled multi-gradient echo (MGRE) sequence was used with 8 echo times (ΔTE=1.2ms, TR>10.9ms, α=20°, 30s breath-hold). For the quantification of inflammation, ballooning and fibrosis, a multi-spin echo (MSE) sequence was used with 10 echo times (ΔTE=12ms, TR>3000ms, α=90°, ~5 minutes).
QMRI technique:
LiverMap® utilises multi-component relaxometry to differentiate different molecular and cellular hydrogen proton pools. For MGRE images, magnitude-based multi-peak fat-water separation was used to map the proton density fat fraction (PDFF) with distinct R2* relaxation rates for water (R2*w) and fat (R2*f)4. In MSE analysis, PDFF was integrated into a four-component R2 signal relaxation model, accounting for water in parenchymal, sinusoidal, and perisinusoidal spaces. Fibrosis assessment was linked to the mean proton density of the perisinusoidal space (PDPS), lobular inflammation to both PDPS and PDFF, and ballooning to variations one standard deviation above the mean PDPS, indicative of heterogeneity in liver microarchitecture.
Results
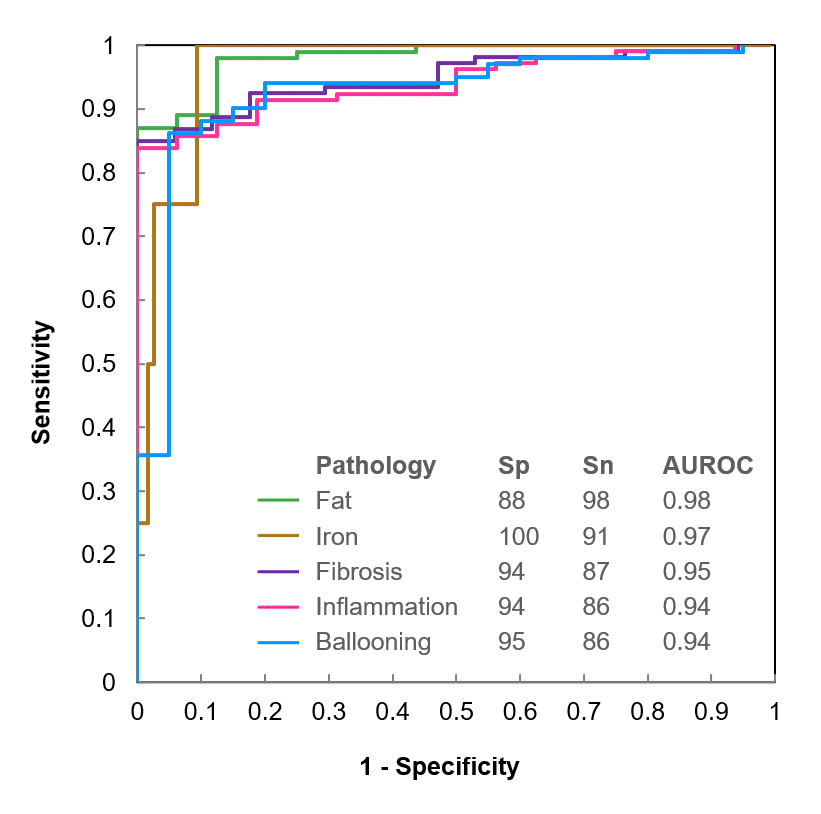
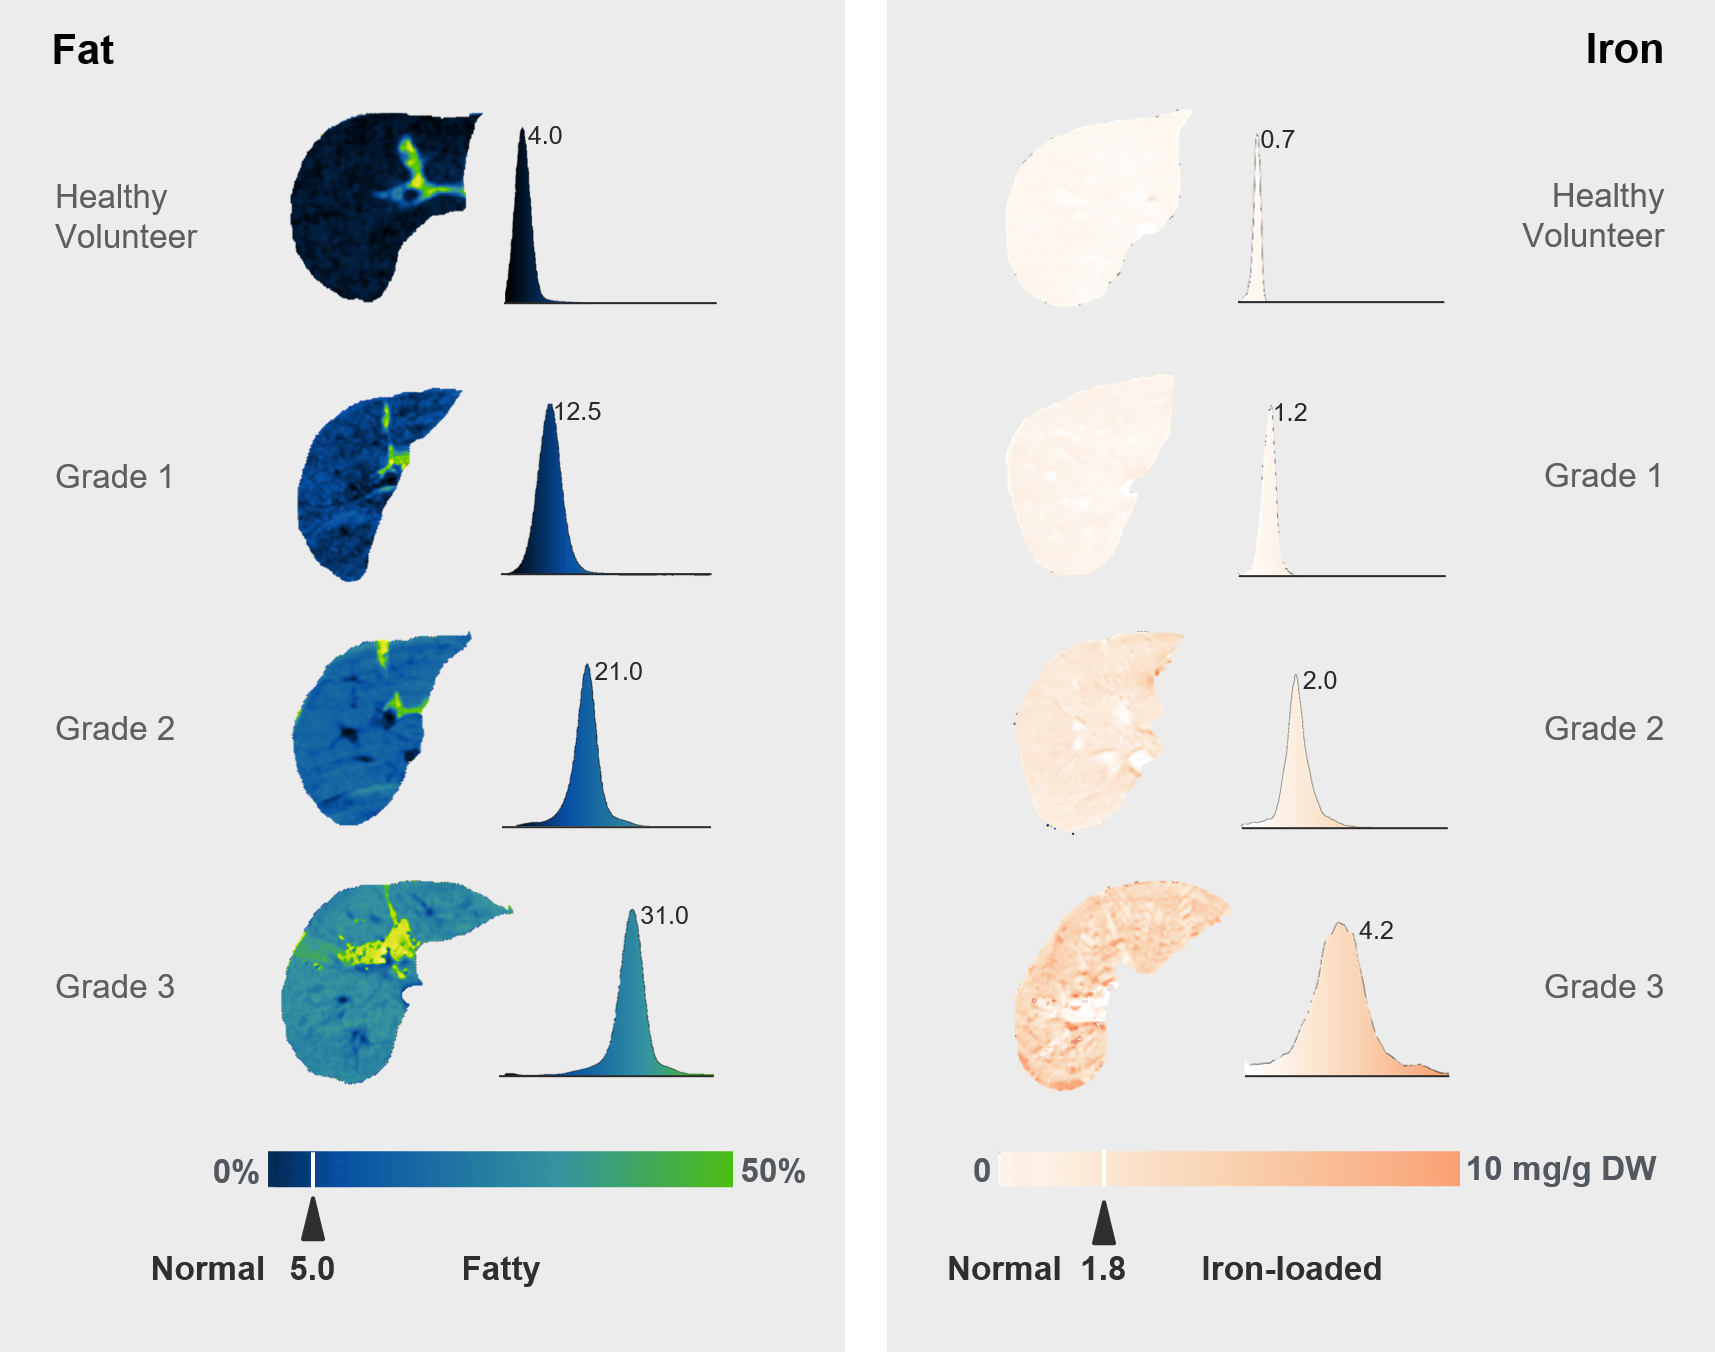
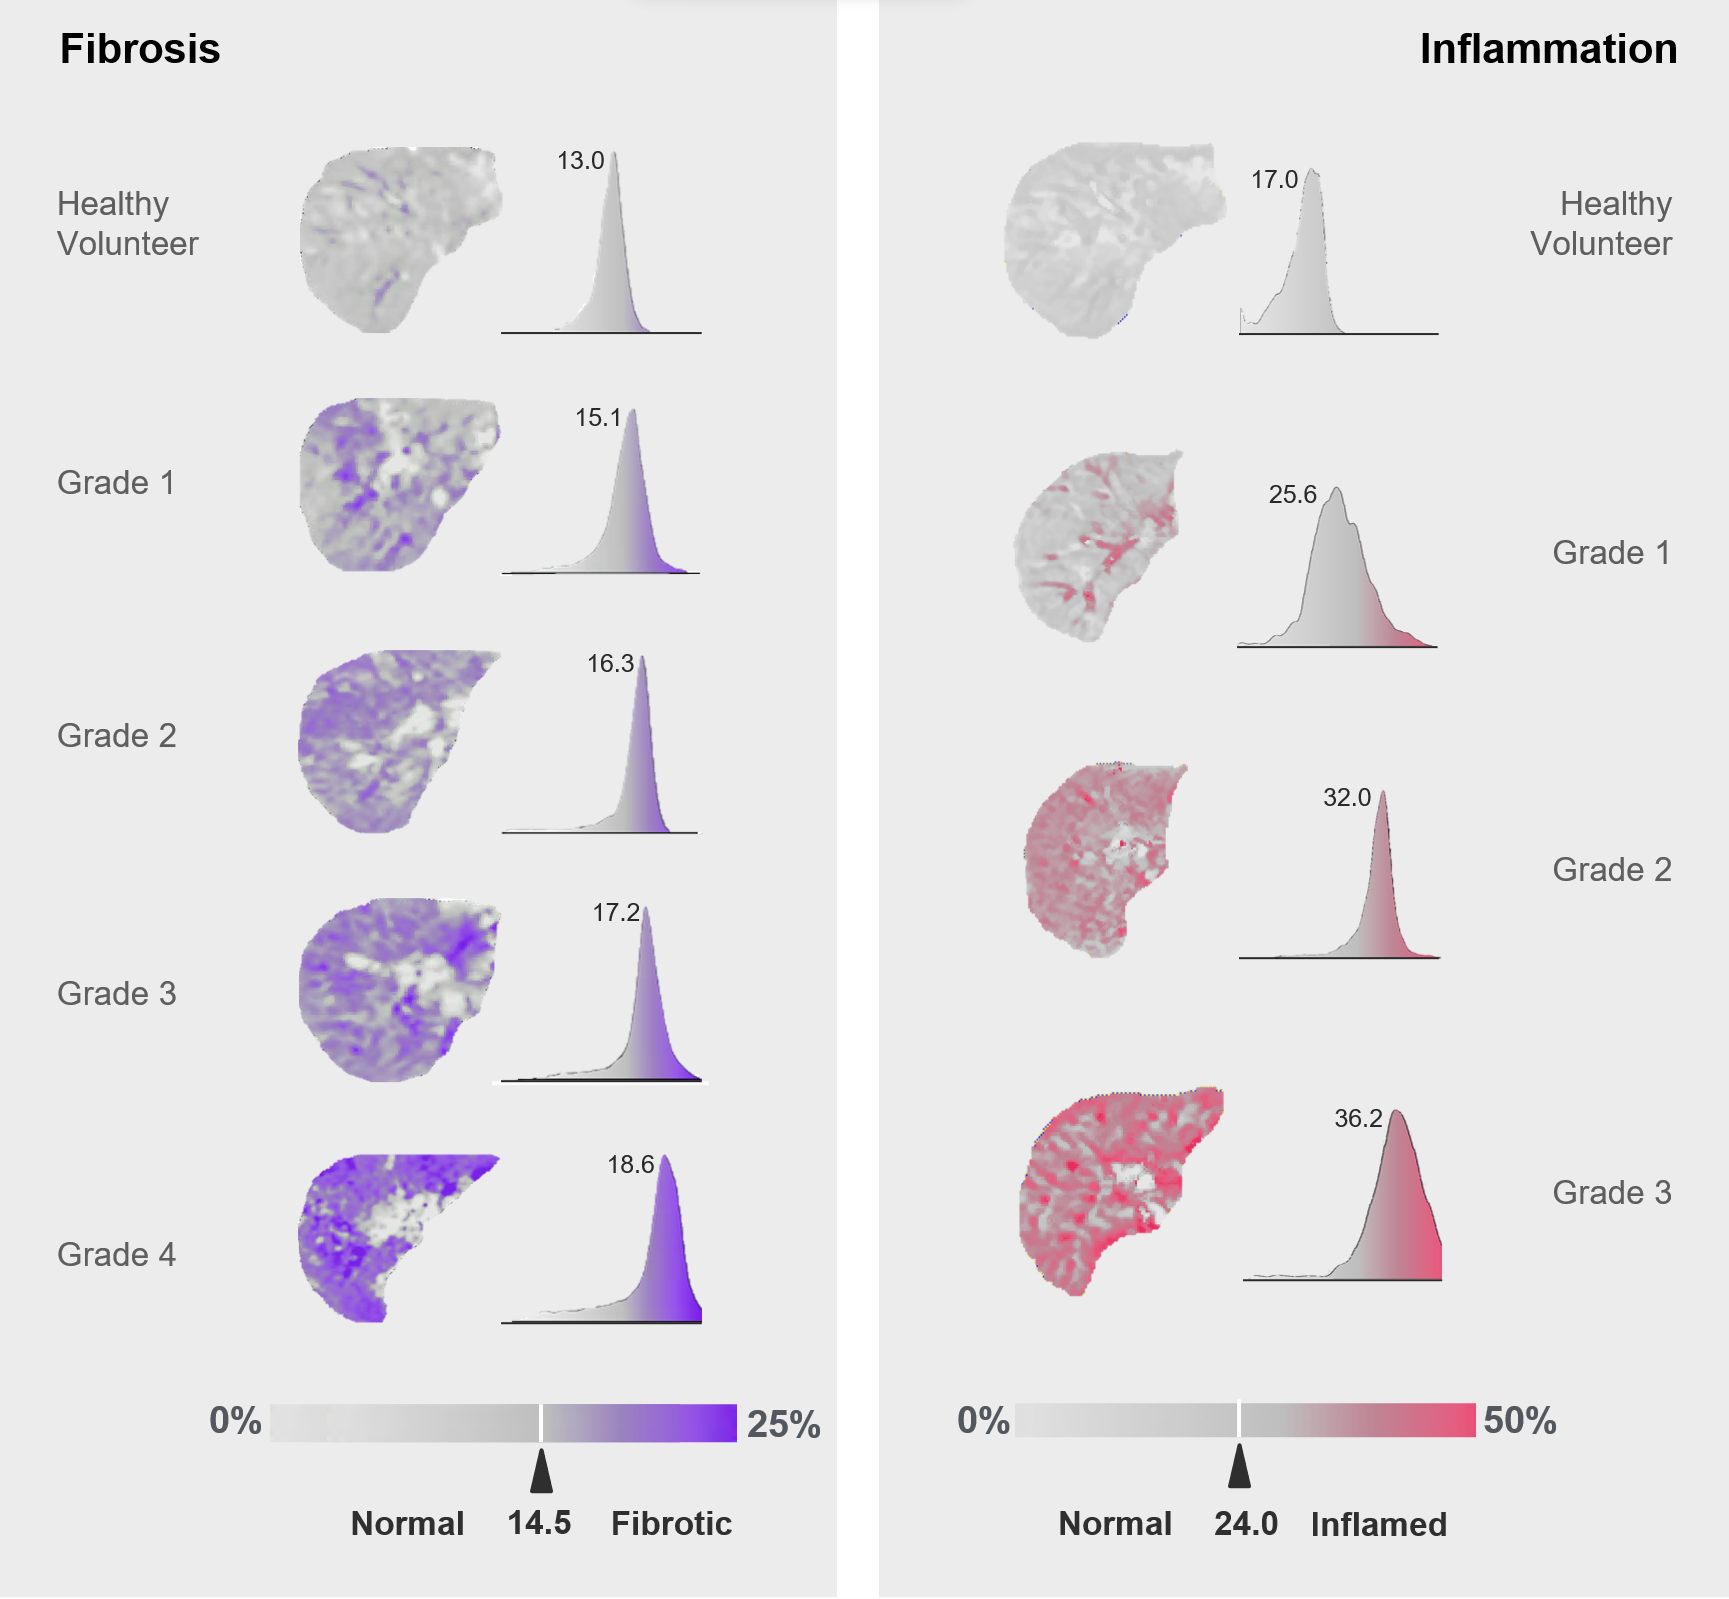
The specificity (Sp) and sensitivity (Sn) of LiverMap® in differentiating pathological tissue from normal liver in the validation cohort is shown in Figure 1. Established thresholds for normal PDFF and R2w* (iron) levels were 5% (Sp=88%, Sn=98%) and ~90 s-1 (~1.8mg.g-1 Fe D.W.5) (Sp=100%, Sn=91%), with AUROCs of 0.98 and 0.97, respectively. AUROCs for identifying lobular inflammation, ballooning, and fibrosis at grade 1 or higher from healthy liver were 0.94 (Sp=94%, Sn=86%), 0.94 (Sp=95%, Sn=86%), and 0.95 (Sp=94%, Sn=87%), respectively.In Figures 2 and 3, maps and distributions for fat (PDFF), iron (R2*), fibrosis (PDPS) and inflammation (PDPS+PDFF), are presented. These figures compare MASLD patients across different pathology grades with healthy volunteers. The distributions are predominantly Gaussian, with clearly defined peaks that track upwards with increasing grades of pathology.
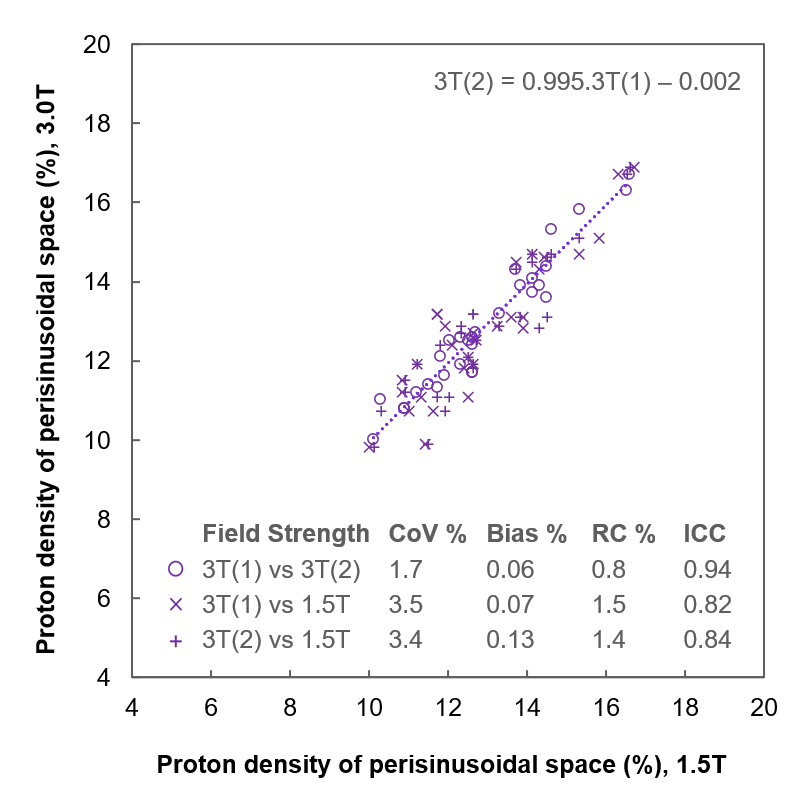
Repeatability and reproducibility of PDPS mapping is shown in Figure 4, with PDPS displaying high repeatability on consecutive 3T scans (CoV=1.7%, bias=0.06%, RC=0.8%), as well as high reproducibility with 1.5T scans conducted on the same day (CoV=3.4%, bias=0.1%, RC=1.5%).
Discussion
LiverMap® accurately quantifies onset of concomitant pathologies in steatotic liver disease, expanding upon earlier research that established its proficiency in grading disease severity4. This precision stems from multi-component relaxometry advancements that measure the volume and heterogeneity of the perisinusoidal space. Since fibrotic progression initiates in the perisinusoidal space, its proton density mapping serves as the most accurate MRI indicator of fibrosis to date. Furthermore, the aggregate proton densities of fat and the perisinusoidal space have a stronger association with lobular inflammation than with fibrosis, suggesting steatosis may be a more reliable predictor of inflammation. Additionally, liver microarchitecture distortion, known as ballooning, correlates more with variation in the proton density of the perisinusoidal space than does fibrosis or inflammation.The repeatability and reproducibility of LiverMap® for mapping proton density in the perisinusoidal space was high, similar to cT1 mapping techniques6.
Conclusion
LiverMap® offers a new approach to screen and monitor the progression of chronic liver conditions. The technique can be applied reproducibly across 1.5T and 3.0T MRI scanners and takes less than 10 minutes of scan time.Acknowledgements
We wish to acknowledge the support of The University of Sao Paulo and all scan volunteers.References
1. Liang Y, Li D. Magnetic resonance elastography in staging liver fibrosis in non-alcoholic fatty liver disease: a pooled analysis of the diagnostic accuracy. BMC Gastroenterol. 2020;20(89):1-12.
2. Andersson A, Kelly M, Imajo K, et al. Clinical Utility of Magnetic Resonance Imaging Biomarkers for Identifying Nonalcoholic Steatohepatitis Patients at High Risk of Progression: A Multicenter Pooled Data and Meta-Analysis. Clin Gastroenterol Hepatol. 2022;20:2451-2461.
3. Mesropyan N, Kupczyk P, Dold L, et al. Assessment of liver cirrhosis severity with extracellular volume fraction MRI. Scientific Reports 2022;12(9422):1-9.
4. Clark P, Oliviera C, Rocha M, et al. LiverMap®: mapping liver fibrosis, inflammation, fat and iron with multi-parametric multi-component relaxometry (mpMCR). ISMRM Workshop on MRI of Obesity & Metabolic Disorders 2019, Session 8.
5. Hernando D,Xhao R, Yuan Q, et al. Multicenter Reproducibility of Liver Iron Quantification with 1.5-T and 3.0-T MRI. Radiology 2023;306(2):e213256.
6. Bachtiar V, Kelly MD, Wilman HR, et al. Repeatability and reproducibility of multiparametric magnetic resonance imaging of the liver. PLoS ONE 2018;14(4):e0214921-12.
Figures