5007
Automated analysis of the UK Biobank MRI data for the assessment of multi-organ involvement in disease1Sir Peter Mansfield Imaging Centre, University of Nottingham, Nottingham, United Kingdom, 2NIHR Nottingham Biomedical Research Centre, Nottingham University Hospitals NHS Trust and the University of Nottingham, Nottingham, United Kingdom, 3School of Computer Science, University of Nottingham, Nottingham, United Kingdom, 4Mental Health and Clinical Neurosciences, School of Medicine, University of Nottingham, Nottingham, United Kingdom, 5Nottingham Digestive Diseases Centre, Translational Medical Sciences, School of Medicine, University of Nottingham, Nottingham, United Kingdom, 6National Heart & Lung Institute, Faculty of Medicine, Imperial College London, London, United Kingdom, 7Department of Population Health Sciences, University of Leicester, Leicester, United Kingdom, 8NIHR Leicester Respiratory Biomedical Research Centre, Glenfield Hospital, Leicester, United Kingdom, 9Lead Research Organisation: Imperial College London, London, United Kingdom
Synopsis
Keywords: Kidney, Kidney
Motivation: To understand organ changes in multimorbidity (fibrosis in two or more organs).
Goal(s): To use the MRI data in the UK Biobank (UKBB) to study multi-organ changes.
Approach: An automated pipeline to analyse the UKBB kidney MRI data, including deep learning for kidney cortex and medulla segmentation from T1 maps, alongside segmentation of the liver, spleen and pancreas to assess their T1. Analysis of 500 healthy volunteers and 235 participants with kidney, pancreas and liver disease.
Results: Multi-organ changes in addition to the primary diseased organ. For example, elevation in cortical T1 in kidney disease together with increased pancreatic and liver T1.
Impact: The automated multi-organ analysis of abdominal MRI data to study multi-organ fibrosis. In the future, this will allow investigations related to the epidemiology, risk factors (genetic and environmental) and natural history of fibrotic multimorbidity.
Introduction
Fibrosis occurs in chronic conditions such as liver cirrhosis, chronic kidney disease and chronic pancreatitis. Research has traditionally focused on fibrosis of the primary diseased organ. However, fibrotic conditions have an increased risk of co-morbidities (fibrotic multimorbidity). MRI allows quantitative assessment of fibrosis using T1 mapping. We explore abdominal MRI data in the UK Biobank (UKBB)1, a prospective population study set-up to include multi-organ MRI data of the abdomen (liver, pancreas, spleen), heart, brain and muscle, with 55K participants scanned to-date. In February 2021, dedicated kidney MRI scans were added, with data collected on ~7K participants but not yet analysed. We developed an automated pipeline to analyse the UKBB kidney MRI data using deep learning for automated segmentation of kidney cortex and medulla from T1 maps, and compared multi-organ T1 and volumes between participants with primary disease (defined from ICD10 codes) and healthy volunteers.Methods
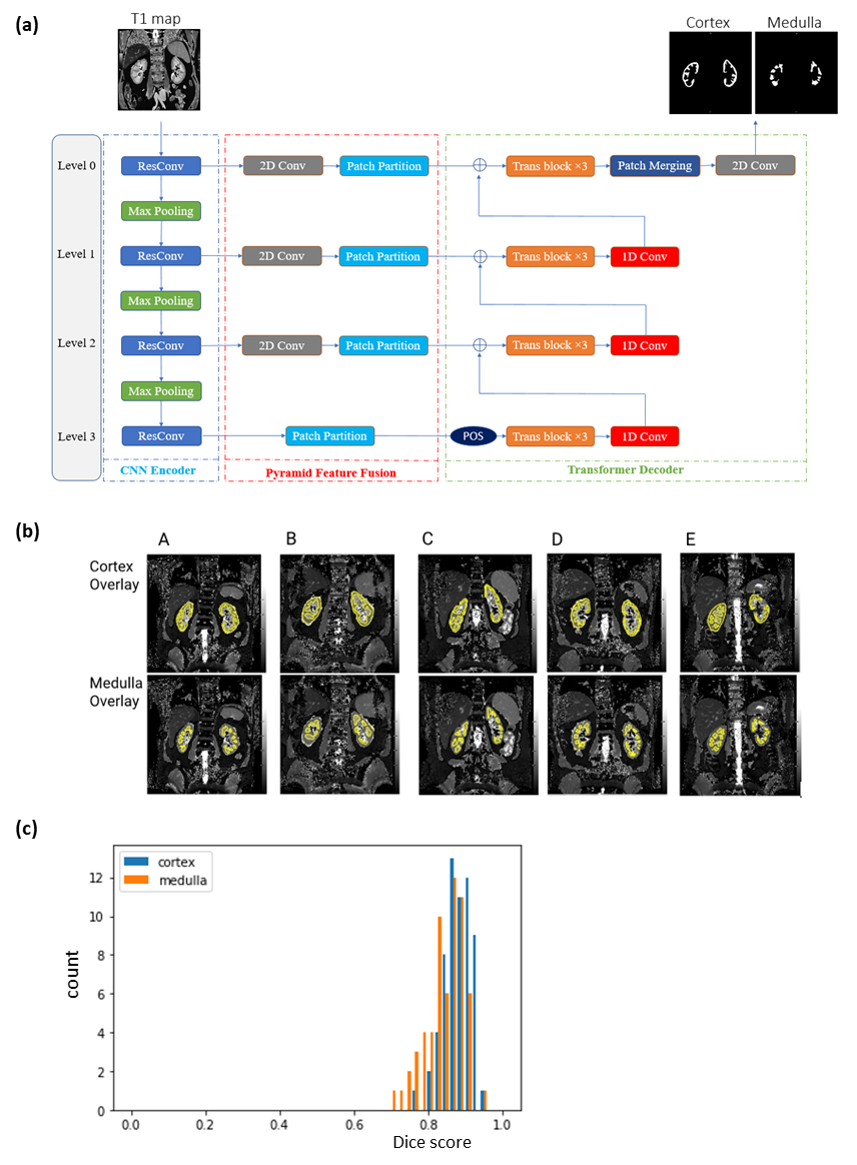
Abdominal MRI data: UKBB Siemens 1.5T abdominal imaging protocol using shortened modified look-locker inversion recovery (shMOLLI) for T1 mapping of the kidneys, liver and spleen, and pancreas; whole-body mDIXON scan for total kidney, liver and spleen segmentation and volumes; THRIVE for pancreas segmentation and volume.Automated Segmentation of Kidney T1 Maps: We applied our deep-learning based image segmentation2 to kidney T1 maps (Fig.1a). This method uses a convolutional neural network for feature extraction and Transformer for segmentation prediction in a multi-resolution manner, yielding better performance than a UNet2. Cortex and medulla masks were semi-automatically defined from T1 maps, with 223 masks used for model training, and 236 for testing to obtain a Dice score. This segmentor was applied to the kidney shMOLLI T1 maps to generate cortex and medulla masks (bound by the whole kidney segmentation, see below).
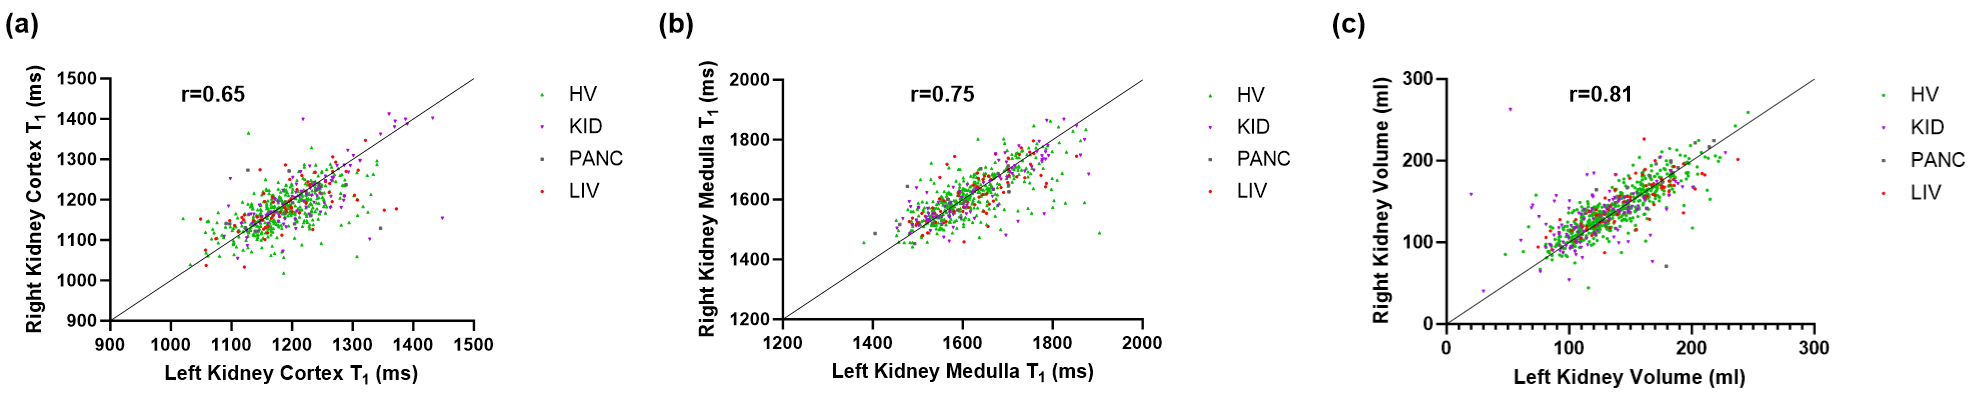
Analysis of UKBB Data: Initial analysis compared the results of 500 healthy volunteer (HV) participants (no chronic/fibrotic disease3,4) with 235 participants with disease [124 kidney (ICD10:I12-13,N08,11,14-18), 24 pancreas (ICD10:K85-86), 87 liver (ICD10:B18,22,K70-77)]. Cortex and medulla masks were applied to kidney T1 maps, and quality control (QC) assessed for right-left correlations of cortex and medulla. Automated segmentation of the mDIXON and THRIVE scans5 provided whole kidney, liver, spleen and pancreas masks for organ volume assessment, and were applied to liver, spleen and pancreas T1 maps. Differences in T1 and organ volumes between healthy controls and participants with disease were assessed.
Statistical Analysis: Data were tested for normality (Shapiro-Wilk test) and found to be predominantly non-normally distributed. Correlations were assessed using Spearman correlation. Group differences were assessed using Kruskal-Wallis and follow-up tests to compare each disease group against the controls, corrected for multiple comparisons.
Results
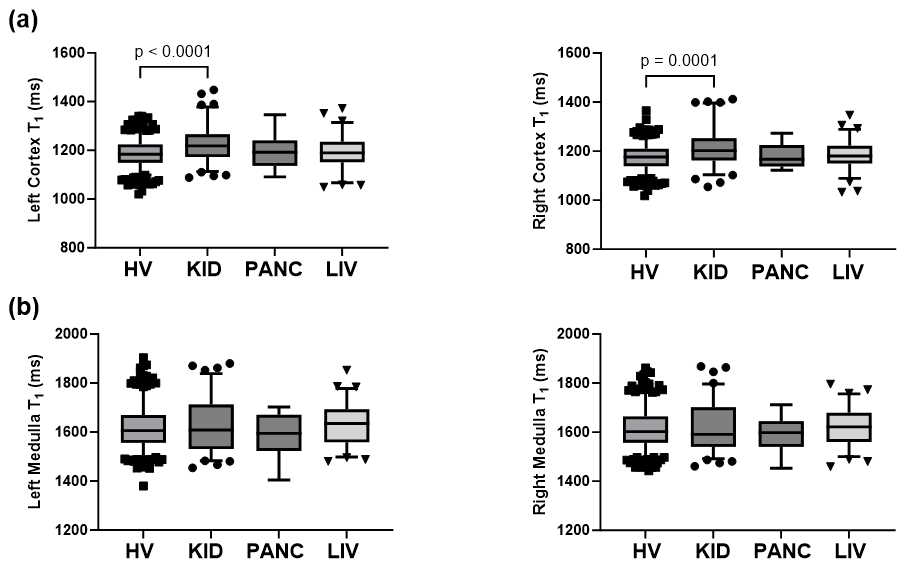
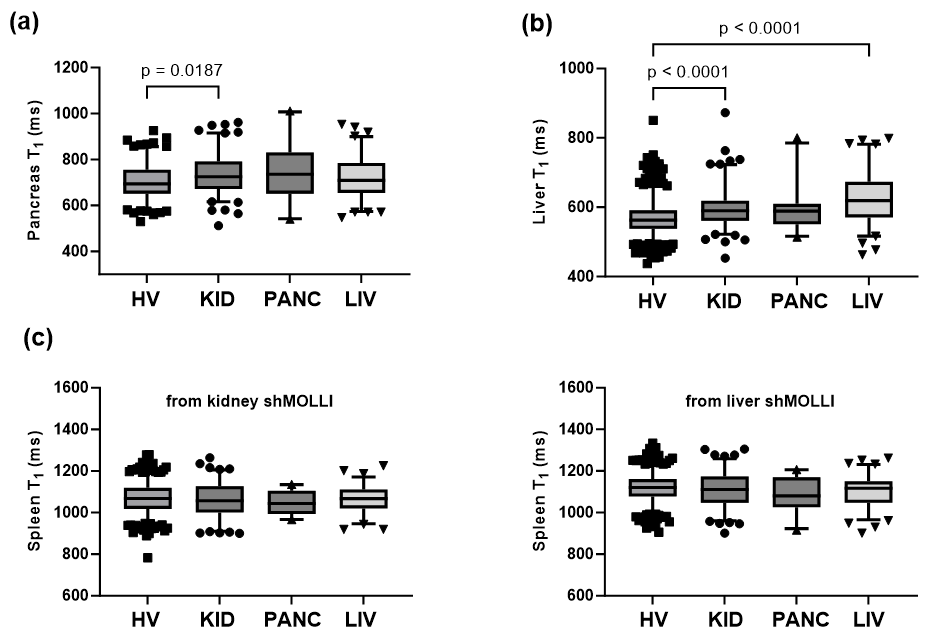
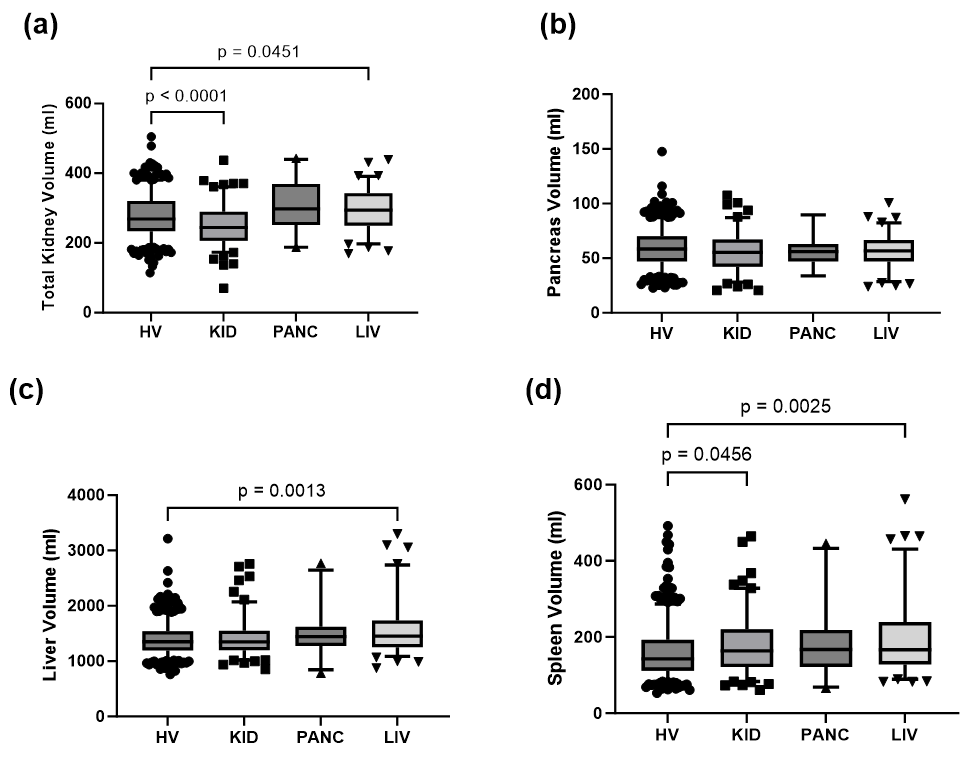
Example cortex and medulla masks generated by the segmentor overlaid on T1 maps used for testing the model are shown in Fig.1b. For the testing dataset, Dice scores for segmentation of the cortex were mean 0.87±0.05 (median 0.87) and of the medulla mean 0.81±0.07 (median 0.81) (Fig.1c). Figure 2 shows right-left kidney cortex and medulla T1 and kidney volume correlations, with a Spearman correlation coefficient of 0.65 for cortex T1, 0.75 for medulla T1 and 0.81 for kidney volume (all p<0.0001).Figures 3-5 show multi-organ T1 measures and organ volumes for each disease group. In kidney disease, renal cortex, pancreas and liver T1 were significantly higher compared with healthy controls (p≤0.001, Fig.3 and p=0.02, Fig.4a-b). In liver disease, liver T1 was significantly higher compared with the HV group (p<0.0001, Fig.4b). In participants with kidney disease, total kidney volume (TKV) was significantly smaller and spleen volume larger compared with healthy controls (p<0.0001 and p=0.046, Fig.5). In liver disease, TKV, liver and spleen volume are all increased (p=0.045, p=0.0013 and p=0.0025, Fig.5).
Discussion
This work has established a pipeline for analysis of multi-organ abdominal MRI including cortical and medullary analysis of more recently added kidney MRI measures. Data demonstrated the expected elevation in T1 in participants with disease compared with healthy volunteers. In participants with kidney disease, there was an increase in renal cortex, pancreatic and liver T1 and a reduction in TKV, highlighting the multi-organ impact alongside the primary diseased organ. Future work will develop the QC pipeline (incorporating image signal-to-noise ratio (SNR), and assessment and correction for shMOLLI T1 mapping heart rate dependence6) and consider age effects.Conclusion
An automated analysis pipeline for the UKBB kidney MRI datasets has been developed and multi-organ changes detected. Future work will apply this multi-organ pipeline to the full ~7K kidney MRI data sets, and assess abdominal T2*/R2* datasets and VIBE TKV measures. These MRI measures will be used to study its epidemiology, risk factors (genetic and environmental) and natural history.Acknowledgements
Data were provided by the UK Biobank under Project ID 43822. This study was supported by the DEMISTIFI Consortium.References
1. Littlejohns TJ, Holliday J, Gibson LM, Garratt S, Oesingmann N, Alfaro-Almagro F, Bell JD, Boultwood C, Collins R, Conroy MC, Crabtree N, Doherty N, Frangi AF, Harvey NC, Leeson P, Miller KL, Neubauer S, Petersen SE, Sellors J, Sheard S, Smith SM, Sudlow CLM, Matthews PM, Allen NE. The UK Biobank imaging enhancement of 100,000 participants: rationale, data collection, management and future directions. Nat Commun. 2020 May 26;11(1):2624. doi: 10.1038/s41467-020-15948-9.
2. Gong Z, French AP, Qiu G, Chen X, “ConvTransSeg: A Multi-resolution Convolution-Transformer Network for Medical Image Segmentation”, arXiv:2210.07072, 2022.
3. Tian YE, Cropley V, Maier AB, Lautenschlager NT, Breakspear M, Zalesky A. Heterogeneous aging across multiple organ systems and prediction of chronic disease and mortality. Nat Med. 2023 May;29(5):1221-1231. doi: 10.1038/s41591-023-02296-6. Epub 2023 Apr 6.
4. Massen GM, Allen RJ, Leavy OC, Selby NM, Aithal GP, Oliver N, Parfrey H, Wain LV, Jenkins G, Stewart I, Quint JK. Classifying the unclassifiable-a Delphi study to reach consensus on the fibrotic nature of diseases. QJM. 2023 Jun 8;116(6):429-435. doi: 10.1093/qjmed/hcad050. Erratum in: QJM. 2023 Jul 01.
5. Liu Y, Basty N, Whitcher B, Bell JD, Sorokin EP, van Bruggen N, Thomas EL, Cule M. Genetic architecture of 11 organ traits derived from abdominal MRI using deep learning. Elife. 2021 Jun 15;10:e65554. doi: 10.7554/eLife.65554.
6. McDiarmid AK, Broadbent DA, Higgins DM, Swoboda PP, Kidambi A, Ripley DP, Erhayiem B, Musa TA, Dobson LE, Greenwood JP, Plein S. The effect of changes to MOLLI scheme on T1 mapping and extra cellular volume calculation in healthy volunteers with 3 tesla cardiovascular magnetic resonance imaging. Quant Imaging Med Surg. 2015 Aug;5(4):503-10. doi: 10.3978/j.issn.2223-4292.2015.04.07.
Figures