4996
Multi-center, multi-vendor validation of PDFF and T1 mapping in an optimized PDFF-T1 phantom1Radiology, University of Wisconsin-Madison, Madison, WI, United States, 2Imaging Physics, Delft University of Technology, Delft, Netherlands, 3Calimetrix, Madison, WI, United States, 4University of California, San Diego, San Diego, CA, United States, 5Canon Medical Systems, Tustin, CA, United States, 6Radiology, University of Texas-Southwestern Medical Center, Dallas, TX, United States, 7Radiology, Children's Hospital of Philadelphia, Philadelphia, PA, United States, 8Medical Physics, University of Wisconsin-Madison, Madison, WI, United States, 9Biomedical Engineering, University of Wisconsin-Madison, Madison, WI, United States, 10Medicine, University of Wisconsin-Madison, Madison, WI, United States, 11Emergency Medicine, University of Wisconsin-Madison, Madison, WI, United States
Synopsis
Keywords: Quantitative Imaging, Precision & Accuracy, Phantoms, PDFF, T1, Multi-center, Multi-vendor
Motivation: Chemical-shift-encoded (CSE)-based proton-density fat-fraction (PDFF) is a highly validated biomarker of liver fat. T1 mapping has been proposed as a biomarker of hepatic fibrosis. However, the reproducibility of PDFF and T1 in the setting of concomitantly varying fat and T1 is poorly understood.
Goal(s): To validate the reproducibility of CSE-based PDFF and MOLLI-based T1 mapping with concomitantly varying fat and T1.
Approach: We conducted a four-center, four-vendor validation study using a quantitative PDFF-T1 phantom.
Results: CSE-based PDFF had good reproducibility, although with increased bias and variability at long T1 values. The reproducibility of MOLLI-based T1 was affected substantially by the presence of fat.
Impact: CSE-based PDFF demonstrated good reproducibility across four centers/vendors, at both 1.5T and 3T. Increased T1 and increased PDFF led to reduced MOLLI-based T1 reproducibility. This multi-center multi-vendor PDFF-T1 phantom validation approach may enable evaluation of improved quantitative MRI methods.
Introduction
Metabolic dysfunction associated steatotic liver disease (MASLD) is the most common chronic liver disease. Initial liver injury can further progress to fibrosis, cirrhosis, liver decompensation, hepatocellular carcinoma and death.1Reproducible quantification of liver PDFF and T1 may enable diagnosis and treatment monitoring for MASLD in the clinic, as well as evaluation of new therapeutics in clinical trials1–3. Confounder-corrected CSE-MRI quantifies PDFF as a highly validated biomarker of steatosis4. Native T1 mapping has shown potential to enable fibrosis staging5, and contrast-enhanced T1 mapping may enable assessment of liver function. However, the presence of fat is known to confound T1 measurements acquired with non-fat corrected methods.5
The reproducibility of PDFF and T1 quantification in the setting of concomitantly varying fat and T1 is poorly understood. Therefore, the purpose of this work is to evaluate the multi-center, multi-vendor reproducibility of CSE-based PDFF and MOLLI-based T1 quantification at 1.5T and 3T using a combined PDFF-T1 phantom.
Methods
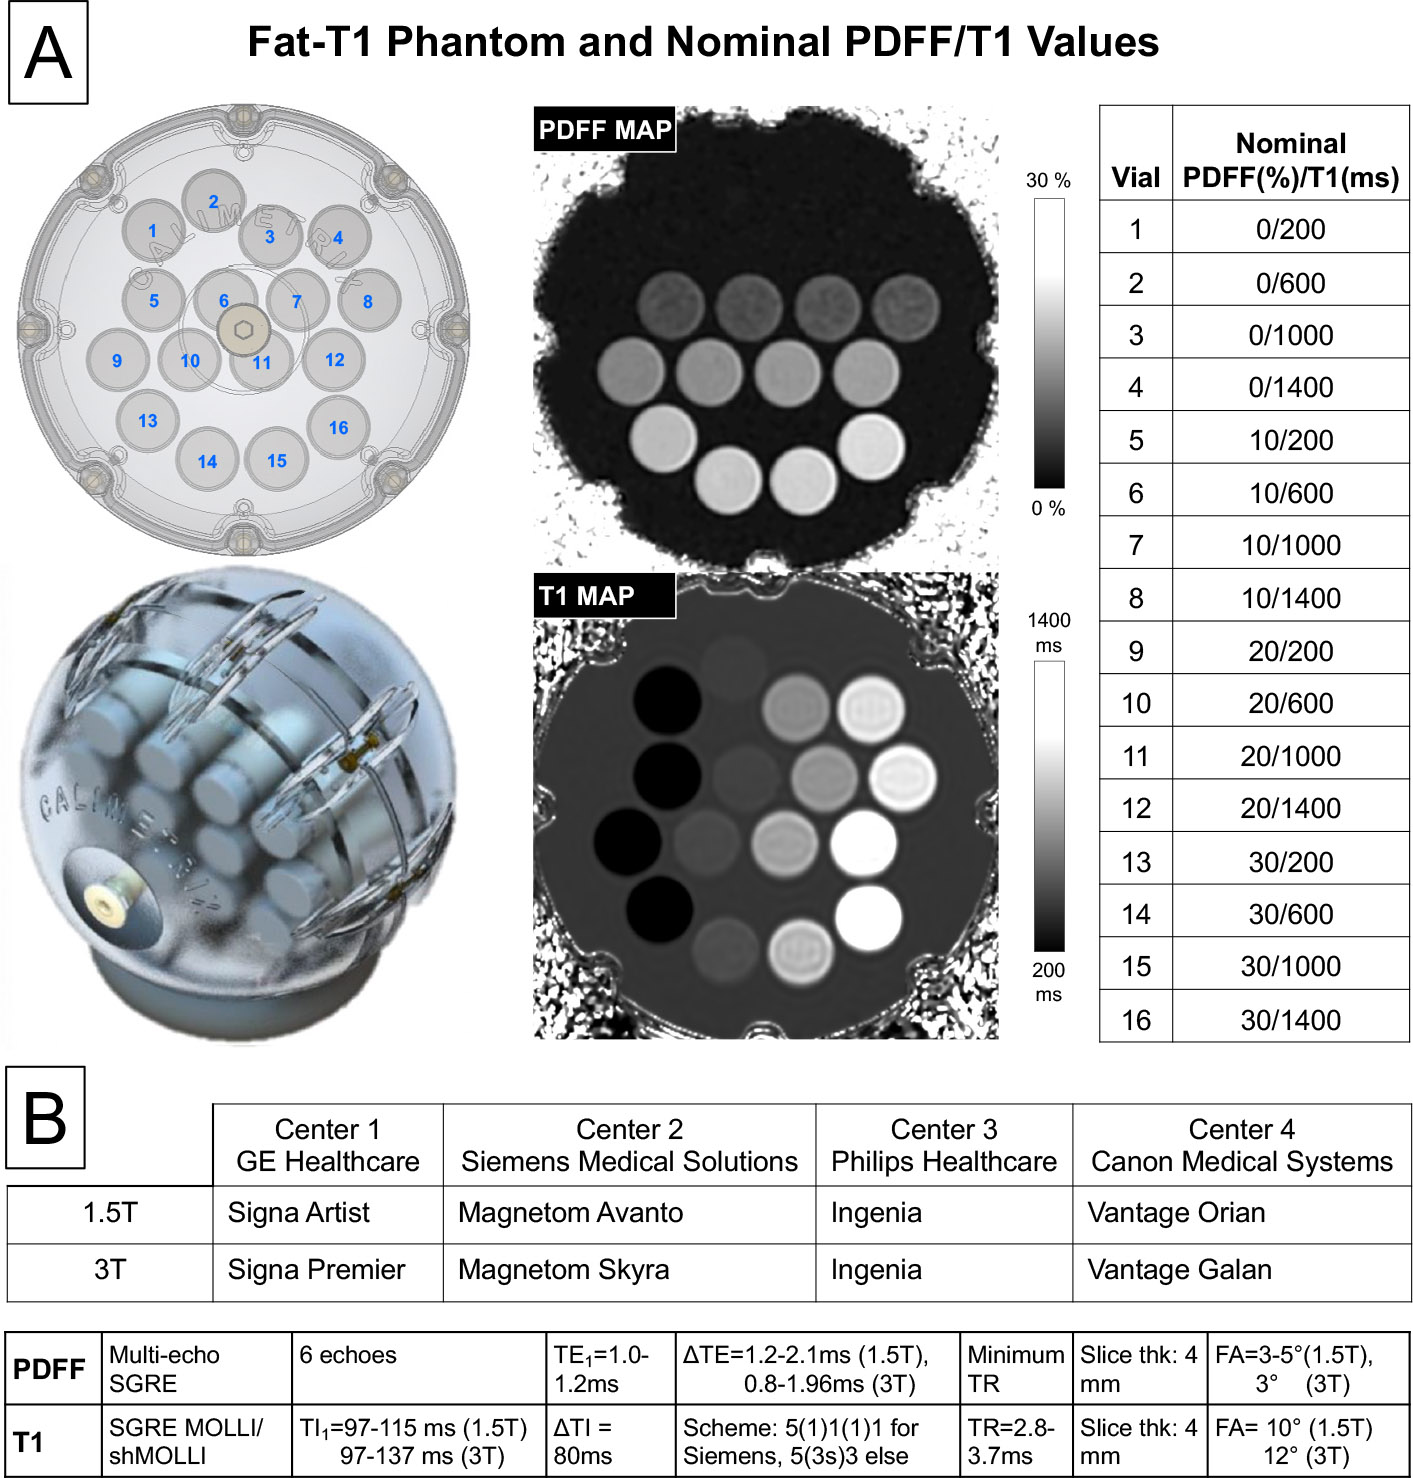
PDFF-T1 Phantom: A commercial PDFF-T1 phantom (Calimetrix, Madison, WI) was used, including 16 cylindrical vials (20 mL), covering a 4x4 grid of PDFF-T1 values (Figure 1). Each vial contains an agarose-based emulsion with a unique combination of PDFF (range 0-30%) and T1 values (range of T1 of water 200-1400ms). The vials are placed in a spherical housing containing a doped water bath, to optimize B0 homogeneity and image quality.Imaging Centers: The phantom was scanned at four centers with different MR vendors (1. GE, 2. Siemens, 3. Philips, 4. Canon) in a round-robin study. At each center, the phantom was scanned at both 1.5T and 3T MR (Figure 1) with acquisition parameters approximately matched across centers. As described in Figure 1, 3D multi-echo, spoiled-gradient-echo sequence (CSE-MRI) was used for PDFF mapping, and a low flip angle (FA) spoiled gradient echo (SGRE)-based MOLLI/shMOLLI sequence was used for T1 mapping6. This T1 mapping sequence was not feasible at 1.5T at center 3.
After imaging at center 4, the phantom was returned to center 1 for a final scan (at 3.0T) to assess phantom stability.
Image Reconstruction and Analysis: PDFF maps were reconstructed automatically at each of the four centers, using the vendor-provided reconstruction, and transferred to center 1 for region of interest (ROI) and statistical analysis. T1 maps were reconstructed offline at center 1 using a centralized fitting MOLLI/shMOLLI algorithm7,8 implemented in Matlab (MathWorks).
For each vial, a circular ROI (1.9cm diameter) was drawn in the central slices of the maps, and the median of the corresponding voxel values was recorded for further analysis. Intraclass correlation coefficient (ICC), scatter plots and reproducibility coefficient (RPC)9 were calculated. The stability of the phantom was assessed using the ICC between the initial and final scans at center 1.
Results
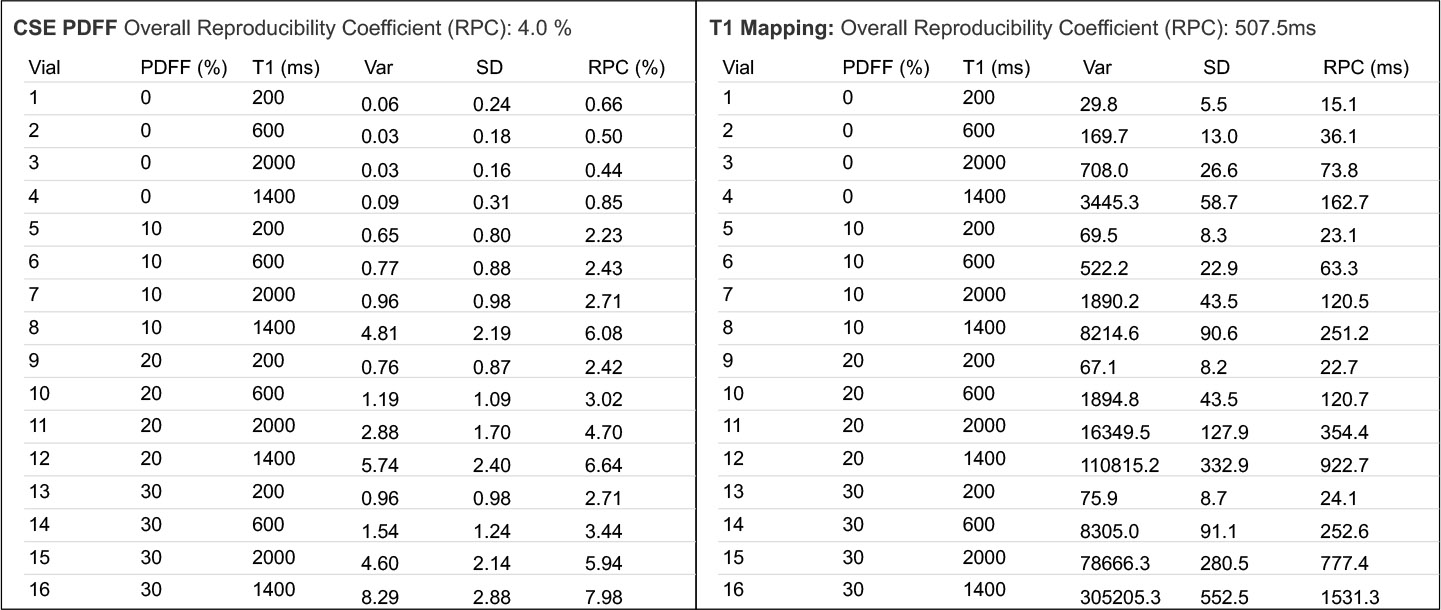
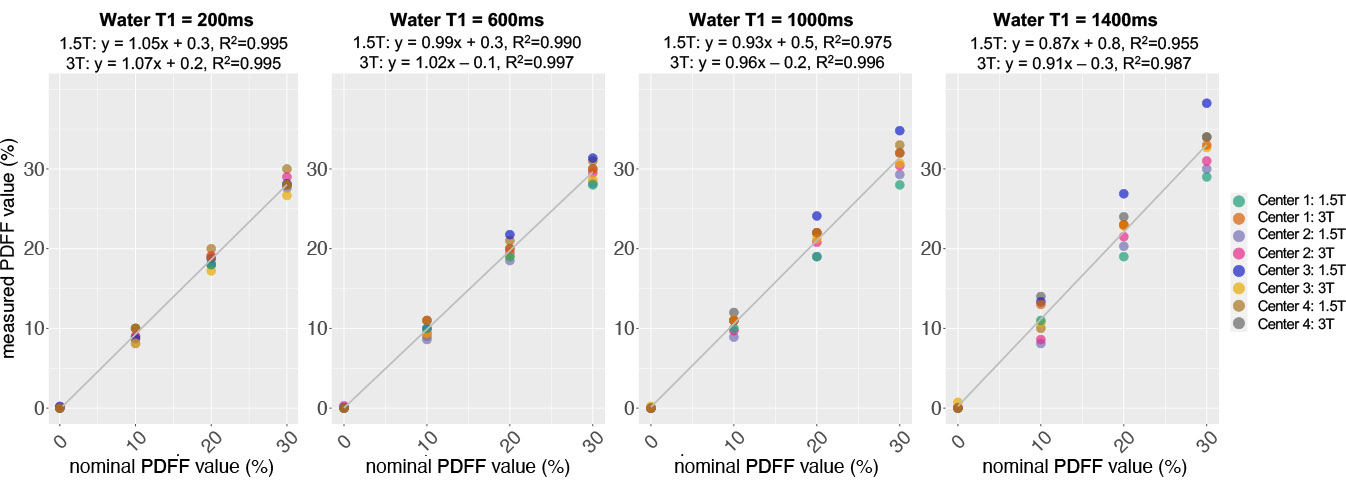
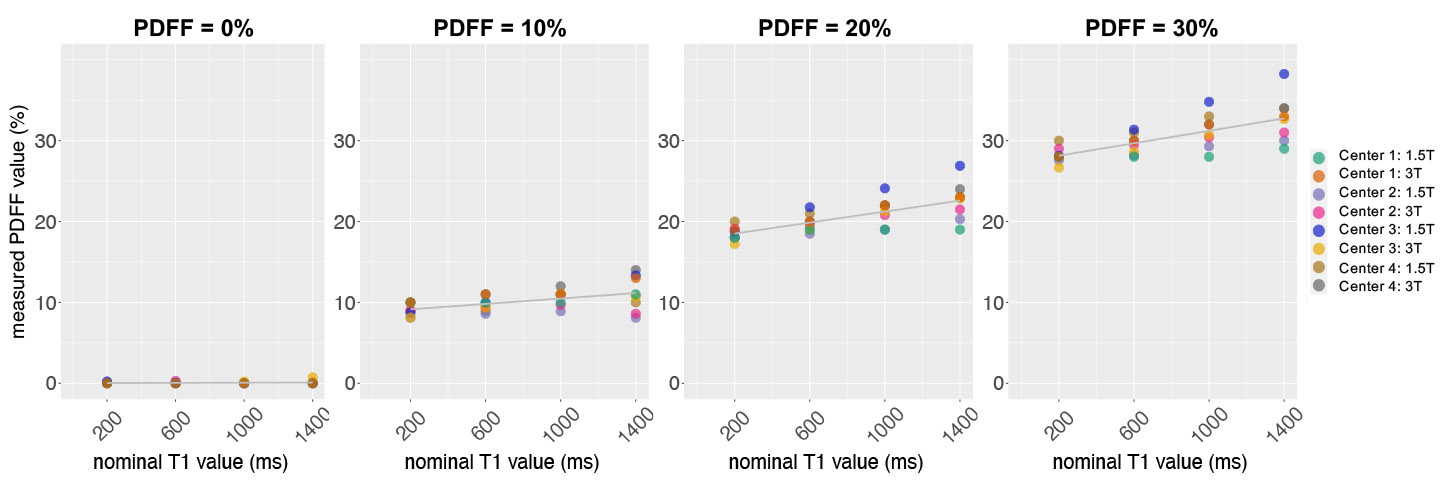
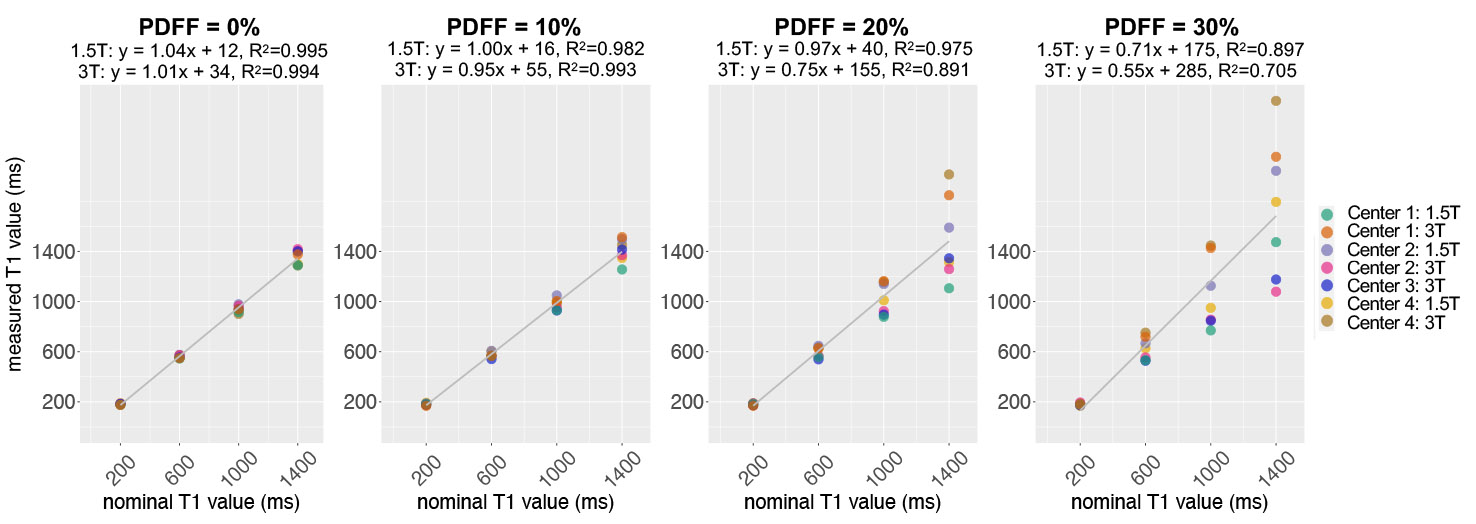
PDFF Reproducibility: The overall RPC was 4.0% absolute (Figure 2). Overall, good agreement was observed for all PDFF measurements across centers, scanners, and sequences with ICC=0.985 [CI 95% 0.972,0.994] (Figure 3). Some spread and overestimation of the PDFF values were observed in the vials with higher T1 (Figure 4).T1 Reproducibility: The overall RPC was 507.5ms (Figure 2). In the absence of fat, good agreement was observed for MOLLI-based T1 measurements across centers and vendors with ICC=0.996 [CI 95% 0.984, 1.0] for PDFF 0%. However, marked variability was observed in T1 values across the centers and vendors with increasing PDFF, as shown in Figure 5.
Phantom stability comparison of initial and final measurements performed at site 1 showed ICC=0.999 [CI 95% 0.998,1] for PDFF, ICC=0.998 [CI 95%, 0.995,0.999] for T1, indicating the phantom was stable over the round-robin study.
Discussion
This work demonstrates good multi-center, multi-vendor reproducibility of CSE-based PDFF, at both 1.5T and 3T, using a quantitative PDFF-T1 phantom. The reproducibility of MOLLI-based T1 degraded with increasing PDFF, particularly for higher T1 values.Some variability of the PDFF values was also observed in the vials with higher T1 likely due to residual T1 weighting in conventional PDFF mapping methods. Methods that fully avoid T1 bias (e.g., correcting for T1 effects, or using optimized non-steady state acquisitions10) may improve reproducibility further.
The reproducibility of T1 was severely degraded with higher PDFF≥20%, likely due to sensitivity of MOLLI-based T1 mapping to the presence of fat11. Emerging methods for confounder-corrected T1 mapping may address this limitation.12,13
Conclusion
PDFF showed good reproducibility across multiple centers, vendors, protocols, and field strengths. MOLLI-based T1 was reproducible at low PDFF values, but was impacted significantly with increasing fat concentration. The proposed PDFF-T1 phantom validation approach may enable the evaluation of improved confounder-corrected PDFF and T1 mapping methods across vendors and centers.Acknowledgements
The authors acknowledge support from the NIH (R44-EB025729, R01-DK117354, R01-EB031886). The authors also acknowledge support from GE Healthcare and Bracco Diagnostics who provide research support to the University of Wisconsin, Siemens Healthineers who provides research support to CHOP, Philips Healthcare who provides research support to UTSW, and Canon Medical Systems who provides research support to UCSD. Dr. Reeder is the John H. Juhl Endowed Chair of Radiology. The authors also wish to acknowledge Calimetrix for providing the phantom used in this study.References
1. Starekova J, Hernando D, Pickhardt PJ, Reeder SB. Quantification of Liver Fat Content with CT and MRI: State of the Art. Radiology. 2021;301(2):250-262. doi:10.1148/radiol.20212042882. Starekova J, Reeder SB. Liver fat quantification: where do we stand? Abdom Radiol. 2020 Nov;45(11):3386-3399. doi: 10.1007/s00261-020-02783-1
3. Katsube T, Okada M, Kumano S, et al. Estimation of Liver Function Using T1 Mapping on Gd-EOB-DTPA-Enhanced Magnetic Resonance Imaging: Investigative Radiology. 2011;46(4):277-283. doi:10.1097/RLI.0b013e318200f67d
4. Yokoo T, Serai SD, Pirasteh A, et al. Linearity, Bias, and Precision of Hepatic Proton Density Fat Fraction Measurements by Using MR Imaging: A Meta-Analysis. Radiology. 2018;286(2):486-498. doi:10.1148/radiol.2017170550
5. Ahn JH, Yu JS, Park KS, et al. Effect of hepatic steatosis on native T1 mapping of 3T magnetic resonance imaging in the assessment of T1 values for patients with non-alcoholic fatty liver disease. Magnetic Resonance Imaging. 2021;80:1-8. doi:10.1016/j.mri.2021.03.015
6. Shao J, Rashid S, Renella P, Nguyen KL, Hu P. Myocardial T1 mapping for patients with implanted cardiac devices using wideband inversion recovery spoiled gradient echo readout. Magn Reson Med. 2017 Apr;77(4):1495-1504. doi: 10.1002/mrm.26223. Epub 2016 Mar 28. PMID: 27018872.
7. Messroghli DR, Radjenovic A, Kozerke S, Higgins DM, Sivananthan MU, Ridgway JP. Modified Look-Locker inversion recovery (MOLLI) for high-resolutionT1 mapping of the heart. Magn Reson Med. 2004;52(1):141-146. doi:10.1002/mrm.20110
8. Piechnik SK, Ferreira VM, Dall’Armellina E, et al. Shortened Modified Look-Locker Inversion recovery (ShMOLLI) for clinical myocardial T1-mapping at 1.5 and 3 T within a 9 heartbeat breathhold. J Cardiovasc Magn Reson. 2010;12(1):69. doi:10.1186/1532-429X-12-69
9. Weingärtner S, Desmond KL, Obuchowski NA, et al. Development, validation, qualification, and dissemination of quantitative MR methods: Overview and recommendations by the ISMRM quantitative MR study group. Magnetic Resonance in Med. 2022;87(3):1184-1206. doi:10.1002/mrm.29084
10. Zhao R, Zhang Y, Wang X, Colgan TJ, Rehm JL, Reeder SB, Johnson KM, Hernando D. Motion-robust, high-SNR liver fat quantification using a 2D sequential acquisition with a variable flip angle approach. Magn Reson Med. 2020 Oct;84(4):2004-2017. doi: 10.1002/mrm.28263. Epub 2020 Apr 3. PMID: 32243665; PMCID: PMC7366366.
11. Kellman P, Bandettini WP, Mancini C, Hammer-Hansen S, Hansen MS, Arai AE. Characterization of myocardial T1-mapping bias caused by intramyocardial fat in inversion recovery and saturation recovery techniques. J Cardiovasc Magn Reson. 2015 May 10;17(1):33. doi: 10.1186/s12968-015-0136-y. PMID: 25958014; PMCID: PMC4425910.
12. Muslu Y, Cashen TA, Mandava S, Hernando D, Reeder SB. Free-Breathing, Confounder-Corrected, 3D T1 Mapping of the Liver through Simultaneous Estimation of T1, PDFF, R2* and B1+. In Proceedings of 32nd Annual Meeting of ISMRM, Toronto, ON, Canada, 2023.
13. Wang N, Cao T, Han F, et al. Free‐breathing multitasking multi‐echo MRI for whole‐liver water‐specific T1, proton density fat fraction, and quantification. Magnetic Resonance in Med. 2022;87(1):120-137. doi:10.1002/mrm.28970
Figures