4994
‘Repeat it with me’ 2022-23 Reproducibility Team Challenge: Sensitivity Analysis of the Bloch Equations1Division of Clinical Medicine, School of Medicine and Population Health, University of Sheffield, Sheffield, United Kingdom, 2Institute of Biomedical Imaging, Graz University of Technology, Graz, Austria, 3German Centre for Cardiovascular Research, Göttingen, Germany
Synopsis
Keywords: Quantitative Imaging, Validation, Reproducibility, model-based reconstruction, sensitivity analysis, state-transition matrix, nonlinear inversion, Bloch equations, quantitative MRI
Motivation: Inverse problems in MRI require estimation of the Bloch equation partial derivatives, however robust computation is challenging. Sensitivity analysis offers accurate and numerically stable derivatives to overcome this.
Goal(s): To replicate and validate previous work, and examine functionality of the BART toolbox and use of collaborative platforms such as GitHub for reproducing research.
Approach: A direct replication was attempted following methodology from a previous ISMRM abstract, and an accompanying preprint and GitHub repository.
Results: Both replicators successfully recreated all abstract figures. Replication of difference quotient and sensitivity analysis derivatives was achieved within the predefined normalised root mean square error tolerances.
Impact: Successful replication further validates novel work in computing partial derivatives of the Bloch Equations. Collaborative platforms such as GitHub can improve existing software and resources when reproducing research. This enables wider dissemination, enhancing ease-of-use for other researchers in future applications.
INTRODUCTION
This abstract summarises MReplIcators replication results from the 2022-23 ISMRM reproducibility challenge1. Numerically accurate and efficient methods for solving the Bloch equations and estimating their partial derivatives are important for robust and efficient quantitative MRI. The original abstract2 offers a generic solution by exploiting a direct sensitivity analysis using the BART toolbox3. Replicating this study helps to transfer generic concepts of this work to further applications. With the additionally gained knowledge about challenges faced during replication, existing documentation can be improved helping others to understand and integrate fundamental ideas of this abstract more rapidly into their own work. This abstract also provides an opportunity for examining the use of collaborative platforms such as GitHub for reproducing research.METHODS
InteractionAn initial meeting was conducted to discuss team participation throughout the challenge. In addition to the original abstract, the authors directed the replicators (ERG, JPM) to the following resources:
A. Publicly published information about the studies, consisting of:
- Preprint of a more detailed manuscript4
- GitHub repository associated with the preprint, containing steps for reproducing the work relating to Figure 2 of the abstract5
- BART reconstruction toolbox tutorials6
Approach
The replicators attempted a replication using only the publicly available information outlined under A. A history of all replication steps taken was added to the GitHub forks of each replicator8,9. The additional repository described under B was only used to download the ground truth dataset for quantitatively assessing the replication results.
Replications were assessed qualitatively via visual comparison and quantitatively by examining the normalised root mean square error (NRMSE) with the ground truth dataset, at tolerances >=0.005 for the difference quotient (DQ) and >=0.0001 for the sensitivity analysis (SA) derivatives.
Hardware
Replicators:
ERG: Intel(R) Core(TM) i5-1145G7 CPU @ 2.60GHz (4 cores, 8 logical processors)
JPM: Intel(R) Core(TM) i7-4790 CPU @ 3.60GHz (4 cores, 8 logical processors)
Authors:
Intel(R) Core(TM) i7-8565U CPU @ 1.80GHz (4 cores, 8 logical processors)
RESULTS
Successful recreation of Figure 2 from the abstract was achieved by both ERG and JPM (Fig. 1). In attempting to replicate Figure 3, a minor error in the original abstract was identified. When simulating the derivatives for the unprepared IR bSSFP sequence, the value of the perturbation factor, h was stated by the authors as being equal to 1%. However, this resulted in a larger difference between the SA and DQ than that observed from the figures in the abstract (Fig. 2). Manual tuning was used to find the value of h=0.05% which led to the greatest agreement between the SA and DQ derivatives and matched the presented figures (Fig. 3). Using this correction, both replicators were able to reproduce the results within the predefined tolerances for both figures (Table 1). Differences occurred between hardware, with 0% NMRSE achieved in the replication attempt of JPM. For full disclosure, all results output by our replication have been uploaded to Zenodo10.Carbon footprint*
This algorithm runs in 0.08 mins on 4 CPUs:
- Intel i5-1145G7: draws 4.53e-02 Wh. Based in the United Kingdom, this has a carbon footprint of 10.47 mg CO2e, which is equivalent to 0.14 tree-months
- Intel i7-4790: draws 1.20e-01 Wh. Based in the United Kingdom, this has a carbon footprint of 27.72 mg CO2e, which is equivalent to 3.02e-05 tree-months
DISCUSSION
BART is compiled within a Linux environment, which posed an initial challenge to the reproducer sub-team who only had access to a Windows Operating System. This challenge was overcome by installing Windows Subsystem for Linux12.The original study was based on numerical experiments. Therefore, the results were expected to be directly reproducible, however it was expected that possible differences may occur due to numerical noise. The major reason for this is assumed to result from differing optimisation routines across hardware when compiling BART. This has been shown with the Bitwise-Identical results observed between JPM and the author, who both used an i7 processor. ERG did not obtain Bitwise-Identical results using an i5 processor.
CONCLUSION
The Reproducibility Team Challenge provided a practical framework for networking and exchanging knowledge. The attempted replication was successful and challenges in reproducing numerical research have been faced, documented, and overcome, allowing for wider dissemination and ease-of-use for other researchers in future applications.Acknowledgements
Thank you to the ISMRM Reproducibility Challenge Committee for organising and providing the opportunity to engage in this challenge.References
1. The ISMRM Reproducibility Challenge Committee. 2023-24 Reproducibility challenge [internet]. ISMRM challenge website, International Society for Magnetic Resonance in Medicine. 2023. https://challenge.ismrm.org/2023-24-reproducibility-challenge. Accessed on November 3, 2023.
2. Scholand N, & Uecker M. Sensitivity Analysis of the Bloch Equations [abstract]. In: Proceedings of the 31st Annual Meeting of ISMRM, London, 2022. Abstract nr 1700.
3. Blumenthal M, Holme C, Roeloffs V, et al. mrirecon/bart: version 0.8.00 (0.8.00). Zenodo. 2022. doi: 10.5281/zenodo.7110562
4. Scholand N, Wang X, Roeloffs V, et al. Quantitative Magnetic Resonance Imaging by Nonlinear Inversion of the Bloch Equations. arXiv:2209.08027 [preprint]. 2022. doi: 10.48550/arXiv.2209.08027
5. Scholand N, & Holme C. mrirecon/bloch-moba/02_sens_analysis [internet]. GitHub. 2023. https://github.com/mrirecon/bloch-moba/tree/master/02_sens_analysis
6. Tamir J, Scholand N, Uecker M, Ong F. mrirecon/bart-workshop [internet]. GitHub. 2023. https://github.com/mrirecon/bart-workshop
7. Scholand N. mrirecon/ismrm-2022-sensitivity-analysis-bloch-eq [internet]. GitHub. 2023. https://github.com/mrirecon/ismrm-2022-sensitivity-analysis-bloch-eq
8. Pilgrim-Morris JH. JemimaPM/bloch-moba-jpm [internet]. GitHub. 2023. https://github.com/JemimaPM/bloch-moba-jpm
9. Gunwhy ER. EbonyGunwhy/bloch-moba-erg [internet]. GitHub. 2023. https://github.com/EbonyGunwhy/bloch-moba-erg/tree/MReplIcators
10. Gunwhy ER, & Pilgrim-Morris JH. ISMRM 2022/23 Reproducibility Team Challenge: Replication results for MReplIcators team [Data set]. Zenodo. 2023. doi: 10.5281/zenodo.7781431
11. Lannelongue L, Grealey J, Inouye M. Green Algorithms: Quantifying the Carbon Footprint of Computation. Adv. Sci. 2021;8(12):2100707. doi: 10.1002/advs.202100707
12. Singh, P. Getting Started with WSL. In: Learn Windows Subsystem for Linux. Apress, Berkeley, CA. 2020. doi: 10.1007/978-1-4842-6038-8_1Figures
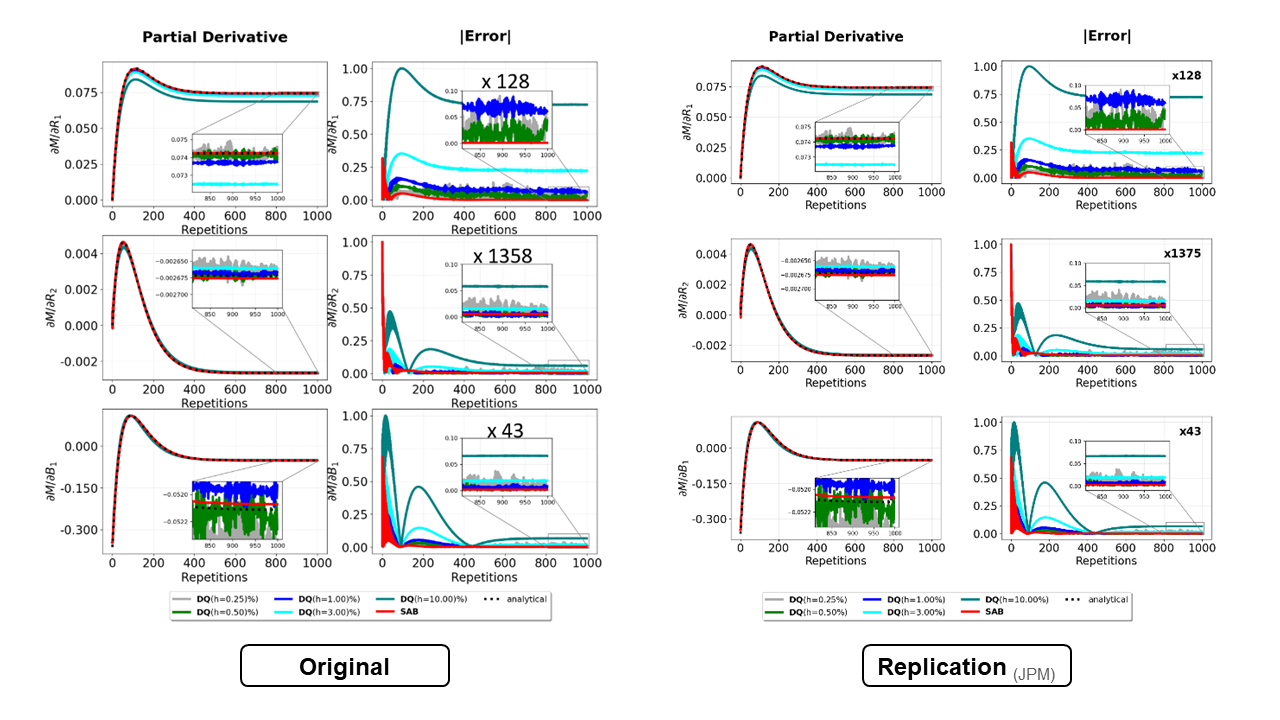
Fig. 1. Replication results from Figure 2 of the original abstract2. Both the original and replicated figures show the temporal evolution of the estimated partial derivatives with respect to R1, R2, and B1 for heart septal tissue for an IR-bSSFP sequence for the direct sensitivity analysis to the Bloch equations (SAB), the difference quotients (DQ) with varying perturbation, the analytical reference (LEFT) and associated errors (RIGHT).
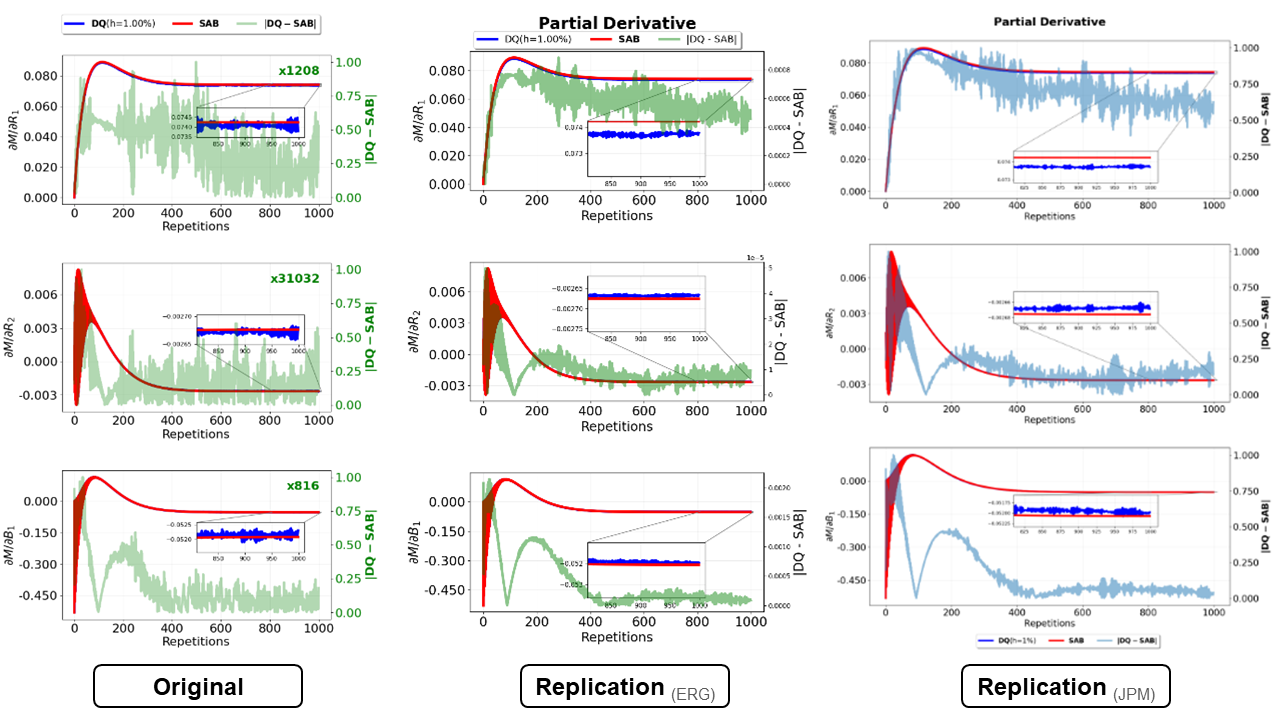
Fig. 2. Replication results from Figure 3 of the original abstract2 with h = 1%. Both the original and replicated figures show the temporal evolution of the estimated partial derivatives with respect to R1, R2, and B1 for heart septal tissue for an IR-bSSFP sequence without leading α/2 pulse for SAB and DQ. Note: errors are scaled by large factors for visualisation purposes.
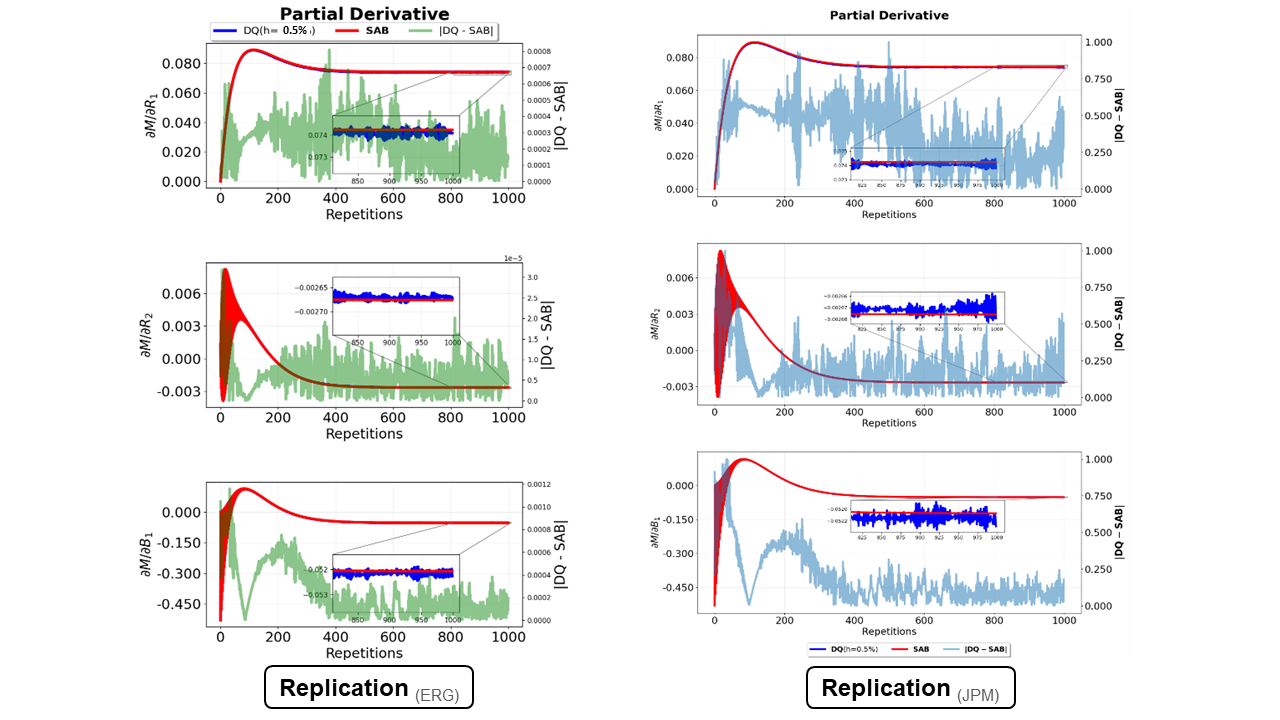
Fig. 3. Replication results from Figure 3 of the original abstract2 with h = 0.5%. Both the original and replicated figures show the temporal evolution of the estimated partial derivatives with respect to R1, R2, and B1 for heart septal tissue for an IR-bSSFP sequence without leading α/2 pulse for SAB and DQ. Note: errors are scaled by large factors for visualisation purposes.
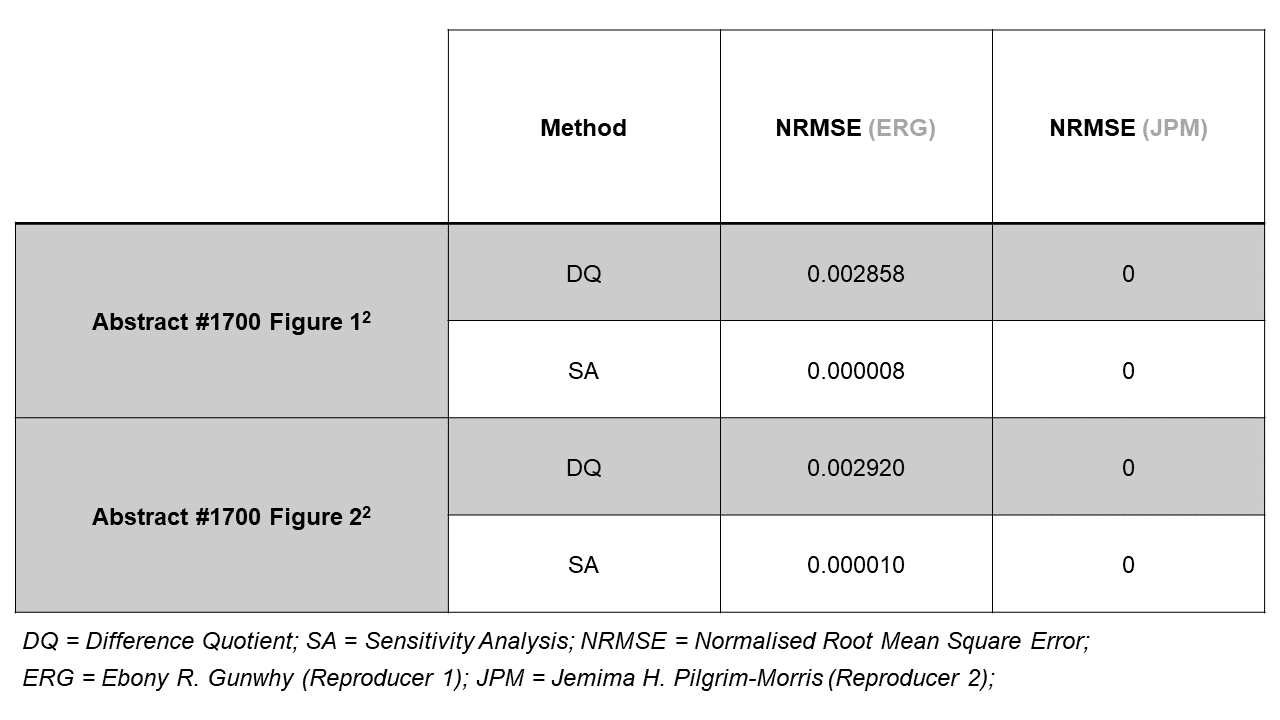
Table 1. Normalised Root Mean Square Errors (NRMSEs) between the replication attempt results for both replicators and the ground truth dataset. Successful replication attempts are defined at a tolerance level of >=0.005 for the difference quotient (DQ) and >=0.0001 for the sensitivity analysis (SA) derivatives.