4992
A Fully Automated Pipeline for the Determination of the Iron Microstructure Coefficient (IMC) from Multi-Echo GRE Data1Buffalo Neuroimaging Analysis Center, Department of Neurology, Jacobs School of Medicine and Biomedical Sciences, University at Buffalo, The State University of New York, Buffalo, NY, United States, 2Center for Biomedical Imaging, Clinical and Translational Science Institute, University at Buffalo, The State University of New York, Buffalo, NY, United States
Synopsis
Keywords: Quantitative Imaging, Quantitative Susceptibility mapping
Motivation: This work aims to automate analysis of the newly introduced Iron Microstructure Coefficient (IMC) to facilitate understanding of iron cellular distribution in neurological diseases for large cohort studies.
Goal(s): The goal is to develop and test an automated and widely applicable pipeline for IMC analysis using quantitative susceptibility and R2* maps obtained from the same multi-echo GRE sequence.
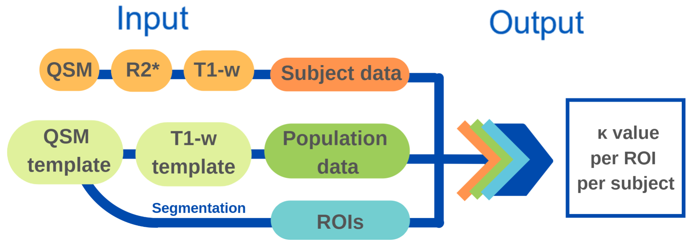
Approach: The pipeline inputs magnetic susceptibility and R2* maps, T1-w data, templates, and regions of interest (ROIs). The output is the IMC value per ROI per subject.
Results: The pipeline successfully executed in 50 minutes without segmentation failure for a cohort of 28 test subjects.
Impact: The automated pipeline accelerates data processing for IMC, providing enhanced standardization in a robust, reproducible, and user-friendly manner. It facilitates large-scale research, driving significant advancements in our understanding of neurological diseases, with the goal of improving accurate diagnosis for patients.
Background
Numerous studies have identified alterations in iron concentration in the deep grey matter (DGM) of patients with neurological diseases such as multiple sclerosis (MS). Quantitative Susceptibility Mapping1 (QSM) measures bulk tissue magnetic susceptibility, or χ, which depends linearly on the concentration of paramagnetic tissue iron. The effective transverse relaxation rate2 (R2*) depends on both the iron concentration and distribution within the imaging voxel.3 The recently introduced4 iron microstructure coefficient (IMC), or κ, quantifies the subcellular distribution of iron based on χ and R2* reconstructed from different pulse sequences. In the present work, we introduce a fully automated and generalized pipeline for IMC analysis using QSM and R2* obtained from the same multi-echo GRE sequence. The program code will be made available at the time of the conference.Methods
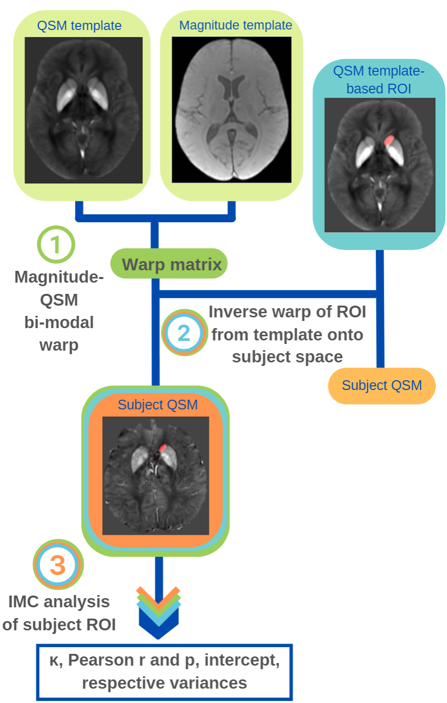
The pipeline was designed for full automation, reproducibility, and widespread use across different study designs and pulse sequences. Pipeline inputs (Figure 1) included the following: susceptibility and R2* maps; T1-weighted (T1-w) subject data; T1-w and QSM hybrid templates;5 binary regions of interest (ROIs) defined in the template space. The pipeline output was a comma-separated-values (CSV) file containing the κ value per ROI per subject and their uncertainties.The pipeline was implemented using makefiles and Docker containerization based on the Neurodocker framework, accessed through a VNC-based virtual desktop (Figure 2). Two Neurodocker images were generated for pre-sorting data and pipeline execution. As shown in Figure 3, a single docker command applies the input ROI labels to QSM and R2* maps using T1-QSM-based bi-modal warp field computations (Python 3.0; ANTs), followed by a total least-squares fitting to the voxel value distributions of χ and R2* to generate κ values. Susceptibility was referenced to the lateral ventricles.
We tested the pipeline in a pilot study with 28 subjects (14 patients with MS, 1:1 age- and sex-matched controls). Inclusion criteria for patients: McDonald criteria; EDSS >4.0; age >40 years. Exclusion criteria included steroids or other immunomodulatory therapy <30 days of MRI; consumption of alcohol <48 hours of MRI; immunosuppressant agents <6 months of MRI; investigational drug or experimental procedure <30 days of MRI; valium/diazepam <24 hours of MRI. Patient (control) age was 60.6±8.2 (58.4±8.0) years and female:male ratio was 6. Data was acquired at 3T (Canon Vantage Titan) using a 32-channel brain coil and a bipolar 3D MGRE sequence (matrix=328x256x70, 0.7x0.9x1.8 mm3, flip=14°; TR/TE1/dTE/nTE=30ms/4ms/2.5ms/10).
QSM maps were reconstructed using best-path unwrapping, LBV and HEIDI. R2* was calculated using log-formalism with the Power method.6 We created a custom bi-modal magnitude-QSM template with bilateral subcortical atlas labels for the following DGM regions: globus pallidus; thalamus (including subnuclei); caudate; putamen; dentate; nucleus ruber; substantia nigra. We applied the pipeline with all inputs on a scientific workstation (Ubuntu 18.04; 48 cores @ 2.70GHz; 378 GB RAM).
Using the Statistical Package for Social Sciences (SPSS; version 28; IBM, Armonk, NY), the CSV file was imported and paired t-tests were performed per ROI to identify significant differences between the left and right hemispheres. If a significant inter-hemispheric difference was discovered, each hemisphere was separately analyzed; otherwise, the mean value of the left and right hemispheres was used. Univariate ANCOVA was conducted with sex, age, and MTR (for myelin correction) as covariates. The Benjamin-Hochberg procedure with p<.05 was used to minimize the false discovery rate.
Results
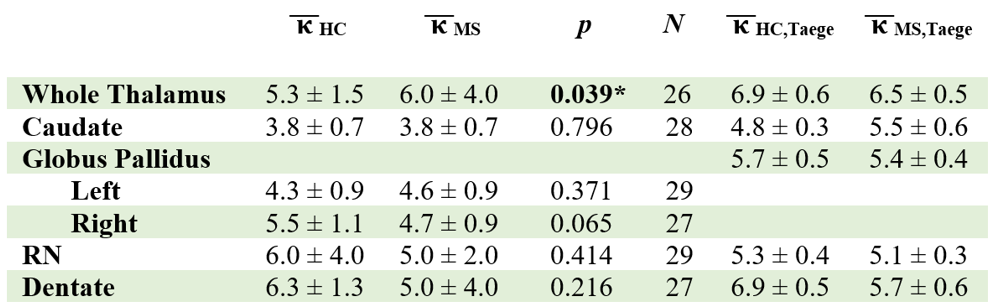
The pipeline execution time was 50 minutes. Visual assessment revealed no failed segmentations. Nominal IMC values were between 2 s⋅ppb in the lateral region of the thalamus and 6 s⋅ppb in the dentate and red nucleus (Table 1), similar to those reported in the previous study.4 The thalamic IMCs were significantly different between HC and MS (p=0.039). ANCOVA revealed that patients had significantly elevated IMC values in the (right) globus pallidus (effect size d=4.448, p=0.047). Thalamic IMCs significantly increased with age (d=10.39, p=0.04).Discussion and Conclusions
The introduced automated pipeline enables IMC analysis in a robust and reproducible manner for large cohort studies using multi-echo gradient echo imaging. The thalamic IMC was found to be dependent on age and significantly higher in MS patients compared to HC, deviating from previous findings4 of age-dependency in the caudate, globus pallidus, and putamen, as well as significantly lower IMC in the dentate and caudate of MS patients. We attribute differences in outcomes to the older age of the study cohort, the small sample size, and differences in the acquisition scheme. Future studies with larger cohorts will use the proposed pipeline to establish baseline IMC values and investigate effects from disease in longitudinal studies. The pipeline will be optimized to incorporate data on tissue diffusion properties.Acknowledgements
Research reported in this publication was supported by the following: the Dana Foundation; the National Institute Of Neurological Disorders And Stroke of the National Institutes of Health under Award Number R01NS114227; the National Center for Advancing Translational Sciences of the National Institutes of Health under Award Number UL1TR001412; the Experiential Learning Network at the University at Buffalo; an equipment grant from Canon Medical Systems Corporation and Canon Medical Research USA, Inc. The content is solely the responsibility of the authors and does not necessarily represent the official views of the funding agencies.References
1 Liu et al., “Quantitative Susceptibility Mapping: Contrast Mechanisms and Clinical Applications.” Tomography, 1(1): 3-17; 2015.
2 Pintaske et al., “Effect of spatial distribution of magnetic dipoles on Lamor frequency distribution and MR Signal decay – a numerical approach under static dephasing conditions.” MAGMA, 19(1): 46-53; 2006.
3 Colgan et al., “Sensitivity of Quantitative Relaxometry and Susceptibility Mapping to Microscopic Iron Distribution.” Magnetic Resonance in Medicine, 83(2): 673-680; 2020.
4 Taege et al., “Assessment of mesoscopic properties of deep grey matter iron through a model-based simultaneous analysis of magnetic susceptibility and R2* – A pilot study in patients with multiple sclerosis and normal controls.” NeuroImage, 186 (1): 308–320; 2019.
5 Hanspach et al., “Methods for the computation of templates from quantitative magnetic susceptibility maps (QSM): Toward improved atlas- and voxel-based analyses (VBA).” Magnetic Resonance Imaging, 46 (5): 1474-1484; 2017.
6 Miller et al., “The use of power images to perform quantitative analysis on low SNR MR images.” Magnetic Resonance Imaging, 11(7): 1051-1056; 1993.
Figures