4991
Improving the Accuracy of Cardiac T1 Maps with a Deep Learning-Based System: Virtual MOLLI Target and LocalNet1Department of Electrical Engineering, National Taiwan University of Science and Technology, Taipei, Taiwan, 2Department of Radiology, Kao-Hsiung Veterans General Hospital, Kao-Hsiung, Taiwan
Synopsis
Keywords: Motion Correction, Motion Correction, MOLLI、registration
Motivation: Accurate cardiac T1 mapping is crucial for diagnosing heart conditions, yet patient motion can cause misaligned images. We aimed to address this with an automatic registration system.
Goal(s): Develop and validate a high-precision automatic registration system for aligning MOLLI cardiac images.
Approach: We created a system that integrates a GAN-generated virtual MOLLI target (VMT) and a deep-learning-based multi-modal registration method (DL) and applied it to a dataset, using the fitting quality index (FQI) for assessment.
Results: Our findings indicate that while all three tested registration methods improved alignment. Our VMT+DL system consistently performed well in datasets with significant motion, while traditional methods faltered.
Impact: The VMT+DL system offers a robust alternative for cardiac T1 mapping in clinical settings, where patient movement can compromise image registration. It ensures the reliability of diagnostic imaging, which is crucial for patient care in cardiology.
Introduction
The cardiac T1 mapping technique via modified Look-Locker inversion recovery (MOLLI) 1 demands that patients maintain a breath-hold during the scan. Precise pixel alignment in the image series is crucial for the T1 mapping process. However, the inability to hold breath can lead to misregistration among MOLLI images, substantially compromising the accuracy of the resulting T1 maps. While there are post-processing methods for image registrations 2, they may fail when faced with large respiratory-related heart displacement. The varied T1 contrasts in MOLLI images present a significant challenge to registration algorithms. In our study, we have developed an automatic registration system that merges two functional blocks: (1) a virtual MOLLI target (VMT) 3,4 and (2) a deep-learning-based multi-modal registration method (DL).Material and Methods
Our study compiled 112 MOLLI 5-(3)-3 datasets from a cohort of 31 participants. Prior to data collection, informed consent was obtained from all participants. Imaging was performed at either basal, mid-cavity, or apical levels of the heart, with each dataset consisting of 16 DICOM files. Half of these images retained their original, unprocessed MOLLI form, while the other half were processed for motion correction using the vendor-equipped algorithm 2. These two subsets of images are referred to as RAW and MOCO, respectively.The registration system we implemented comprises two primary components: (1) the VMT and (2) the DL. The VMT, which is based on a generative adversarial network5, was developed in our prior research, TigerMyo4. TigerMyo is an open-source package capable of generating virtual MOLLI images across various inversion times (TIs) by utilizing the MOLLI image captured at the 'longest' TI. These virtual images, designated as VMTs, subsequently serve as the reference for the subsequent image registration algorithms.
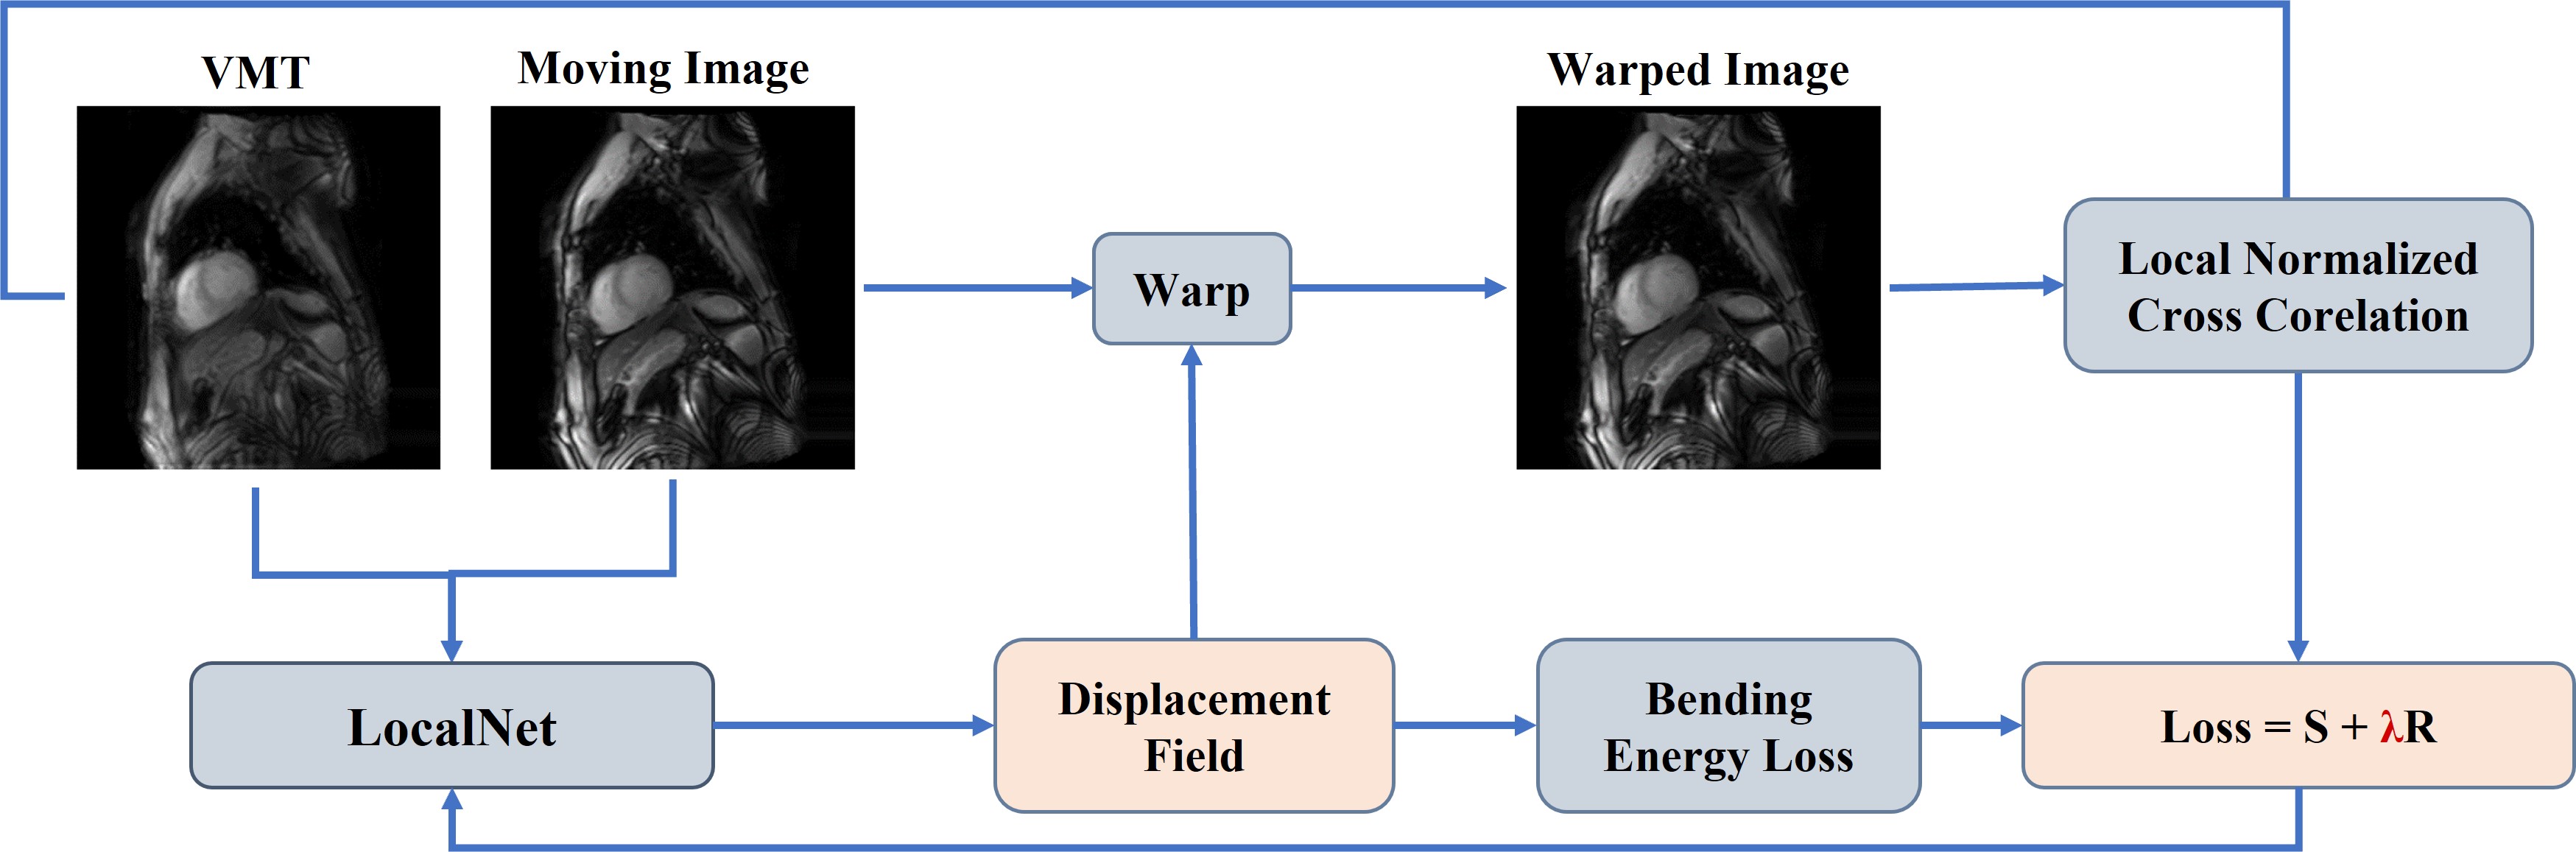
The DL component, as shown in Figure 1, is a deep learning-based registration algorithm adapted from LocalNet 6, which processes and combines RAW and VMT images to form the model input. The output deformation field aligns the RAW images to the VMT, with similarity enhanced by Local normalized cross-correlation loss 6 and bending energy loss 6 to prevent abrupt deformations. The training parameters for LocalNet was (epoch = 1000, learning rate = 10-5, Adam Optimizer). The efficacy of these methods is quantified by the fitting quality index (FQI), calculated from the pixel-level T1 fitting error within the MOLLI sequence, with FQI representing the value of one minus the average of coefficient of determination (R²) for the T1 mapping of each pixel. We referred to the registered MOLLI datasets as VMT+DL. For comparison, we also generated VMT+SITK datasets using image registration with the TigerMyo package, based on SimpleITK 7.
Results
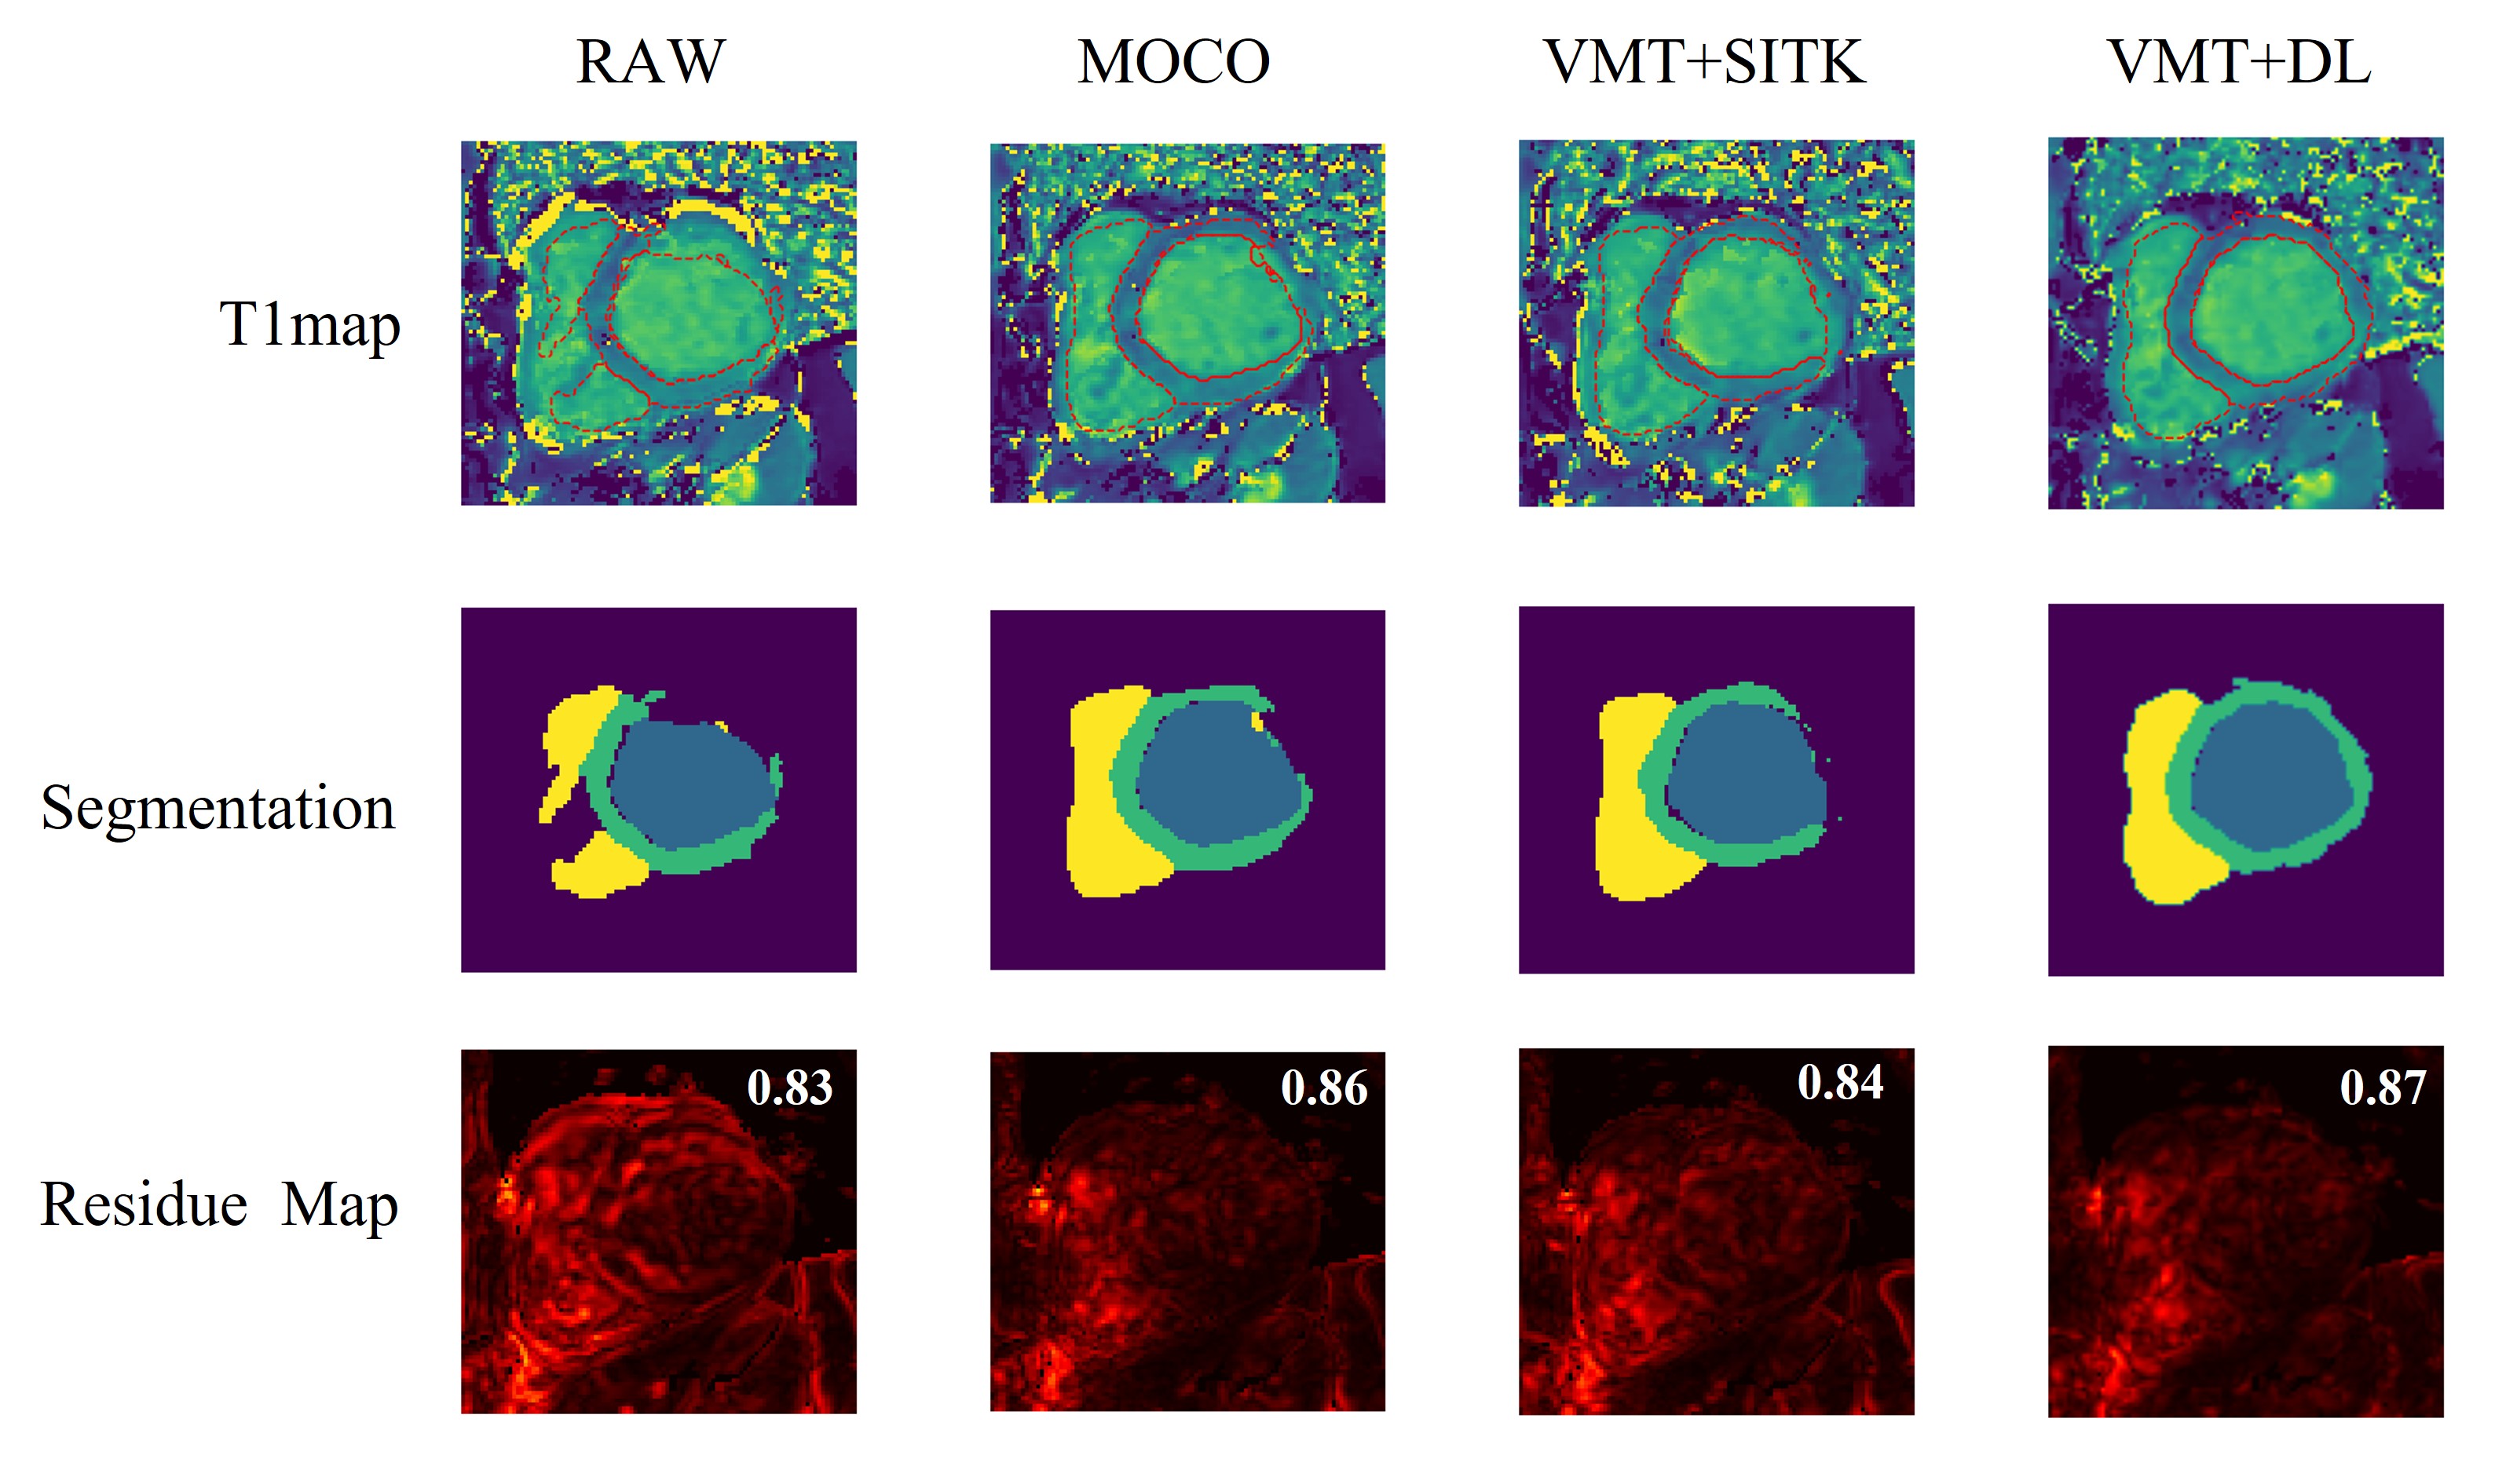
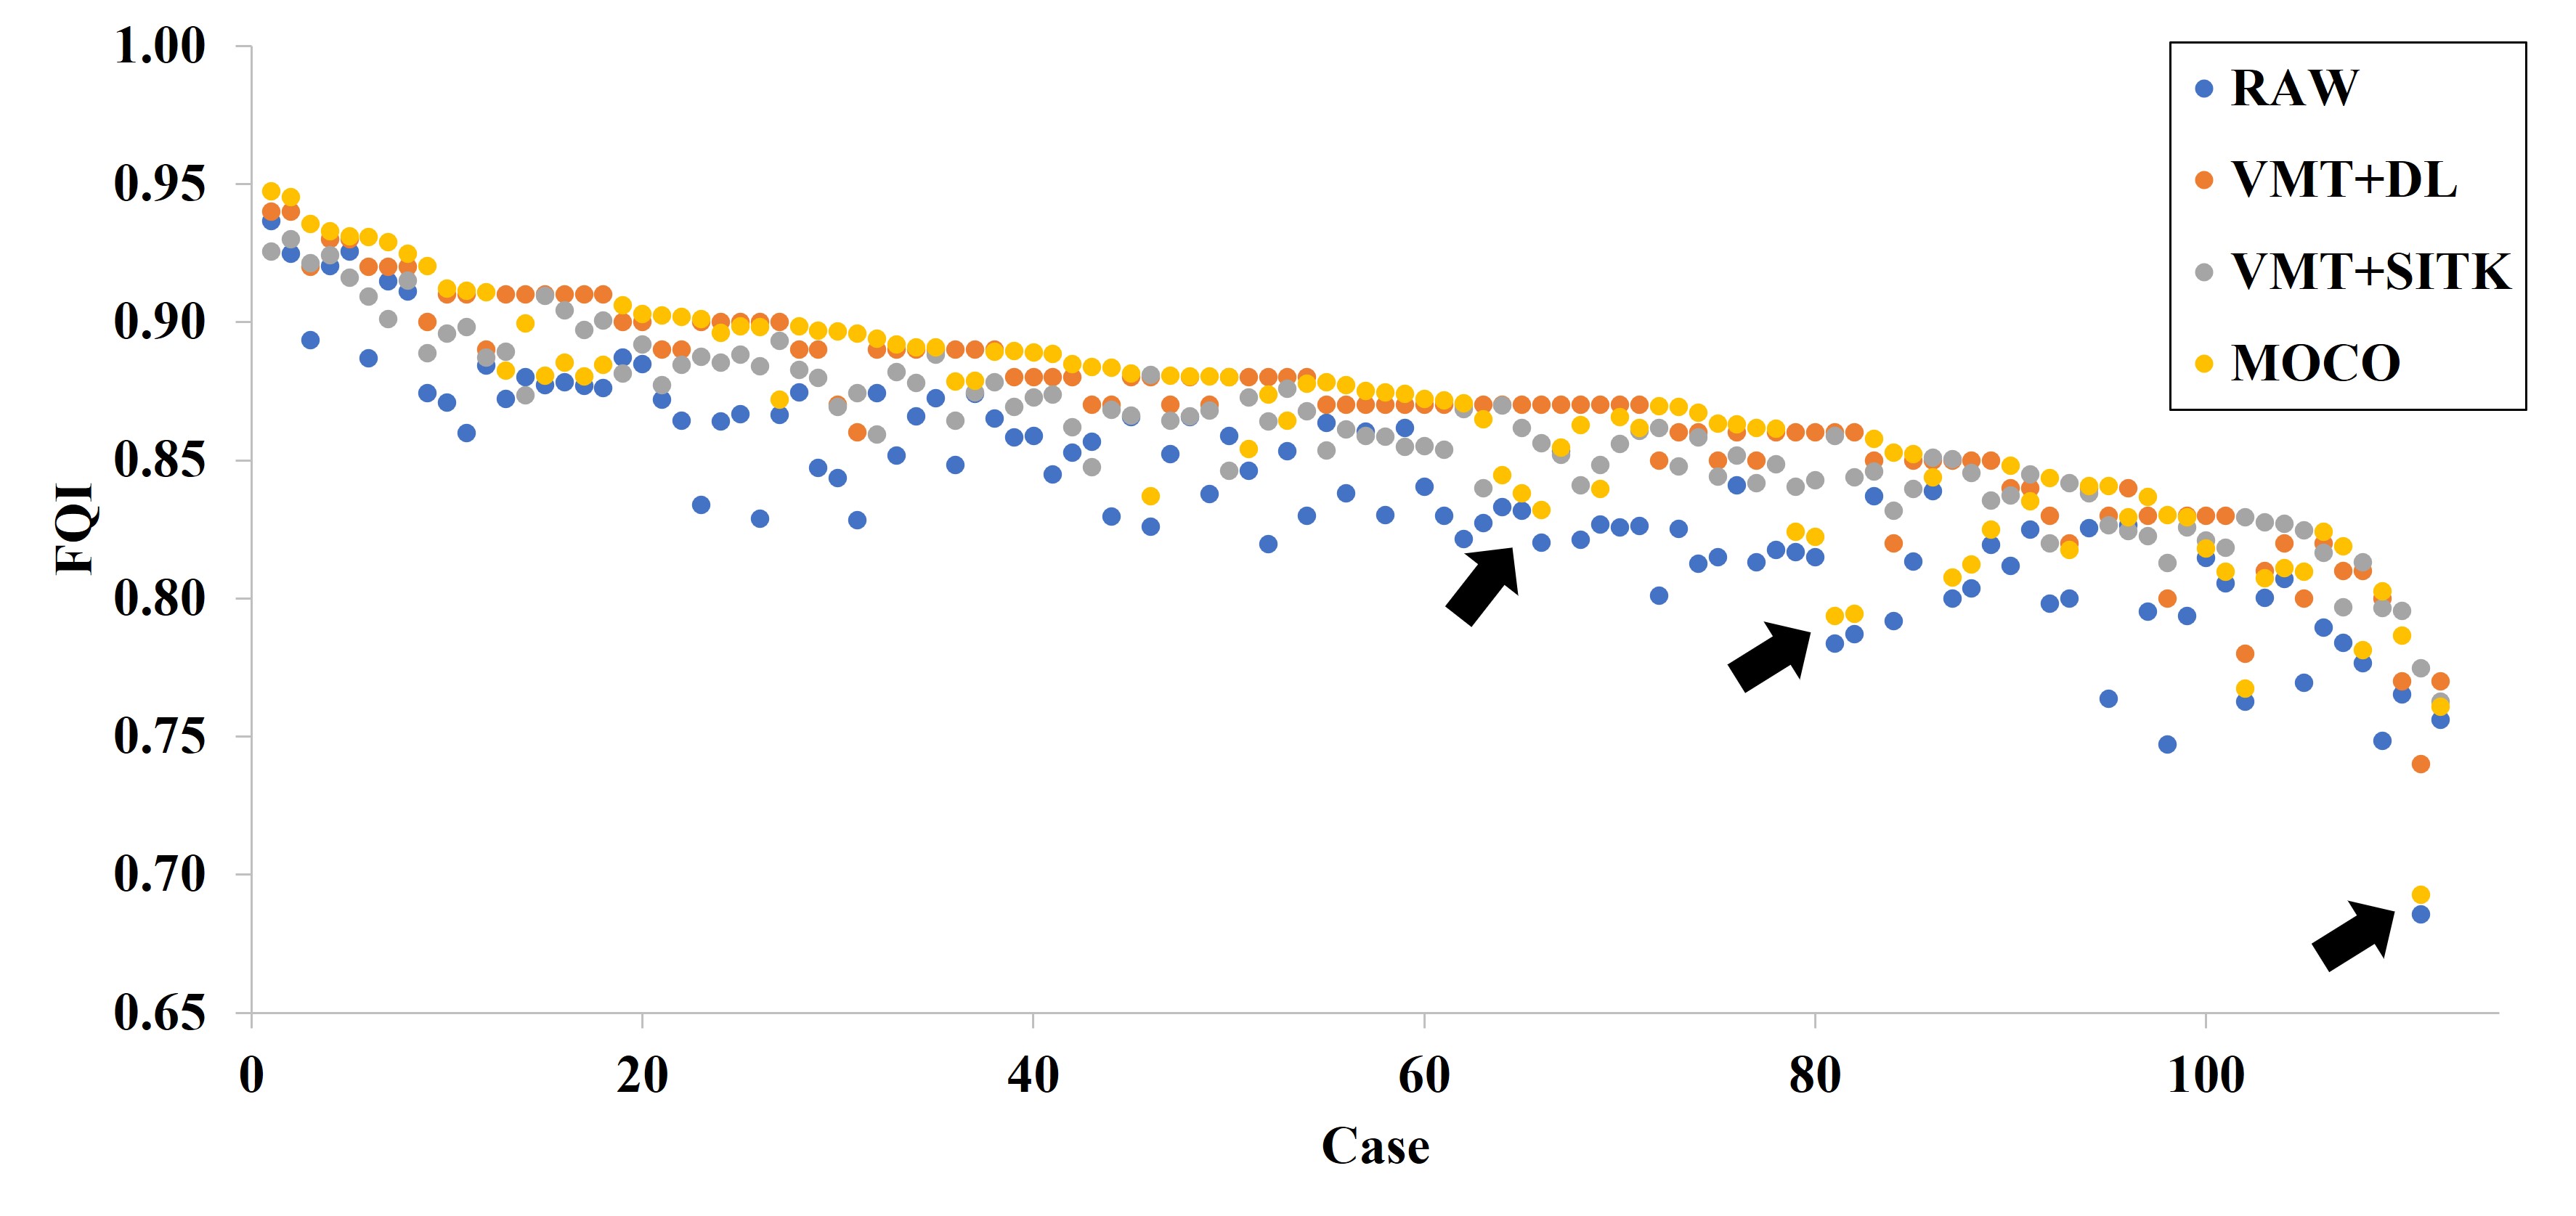
We compared the four types of obtained MOLLI datasets: RAW, MOCO, VMT+SITK, and VMT+DL. Figure 2 displays the T1 maps, fitting residue maps, and cardiac segmentation masks derived from TigerMyo for a sample MOLLI dataset. We can observe that both the segmentation mask and the FQI value of the VMT+DL method support its superiority. Figure 3 shows the average FQI values for the four types of datasets. Compared to RAW, all three registration methods significantly reduced the FQI values (p < 0.01). However, there was no difference among the three registration methods. Figure 4 presents the FQI values for all datasets, comprising 112 datasets across four types of images, totaling 448 data points. The x-axis arranges the datasets in descending order based on the maximal FQI for each. Notably, VMT+DL and MOCO demonstrate comparable performance in most scenarios. However, MOCO exhibits pronounced errors in specific datasets with low FQI, as indicated by black arrows.Discussions and Conclusions
In this study, FQI results suggest that all three registration methods realign MOLLI datasets effectively, yielding high FQI values and more precise cardiac segmentation masks. Although VMT+DL did not exhibit significant improvements over MOCO, it consistently enhanced FQI in subjects with substantial respiratory motion—a scenario where MOCO might underperform. Both VMT and DL contribute to our method's robustness. Future work will explore the integration of VMT+DL with TigerMyo, as well as combining our DL registration approach with Xue’s iterative synthesis registration method 2. Ultimately, VMT+DL stands as a viable alternative when conventional scanner software falls short in registering MOLLI datasets, ensuring the integrity of T1 maps despite patient movement.Acknowledgements
We would like to express our sincere gratitude to the National Center for High-performance Computing for generously providing the necessary computer time and facilities for this research. This study was supported by the National Science and Technology Council, Taiwan (112-2314-B-011-002-MY2). Lastly, we acknowledge the valuable assistance of OpenAI's ChatGPT-4 in refining the grammatical structure of this manuscript.
References
1. Messroghli DR, Radjenovic A, Kozerke S, Higgins DM, Sivananthan MU, Ridgway JP. Modified Look-Locker inversion recovery (MOLLI) for high-resolution T1 mapping of the heart. Magn Reson Med. Jul 2004;52(1):141-6. doi:10.1002/mrm.20110
2. Xue H, Shah S, Greiser A, et al. Motion correction for myocardial T1 mapping using image registration with synthetic image estimation. Magnetic Resonance in Medicine. 2012;67(6):1644-1655. doi:https://doi.org/10.1002/mrm.23153
3. Pan N-Y, Huang T-Y. Fully Automatic Analysis System for Myocardial T1 Mapping: Generative Adversarial Network for Enhanced Image Registration. Master Thesis. 2023; url:https://hdl.handle.net/11296/n5w6bd.
4. Pan N-Y, Huang T-Y. TigerMyo. url:https://github.com/htylab/tigermyo. Accessed at 2023/2/15.
5. Armanious K, Jiang C, Fischer M, et al. MedGAN: Medical Image Translation using GANs. 2018:arXiv:1806.06397. doi:10.48550/arXiv.1806.06397 Accessed June 01, 2018. https://ui.adsabs.harvard.edu/abs/2018arXiv180606397A
6. Diaz-Pinto A, Alle S, Ihsani A, et al. MONAI Label: A framework for AI-assisted Interactive Labeling of 3D Medical Images. arXiv e-prints. 2022;
7. Beare R, Lowekamp B, Yaniv Z. Image Segmentation, Registration
and Characterization in R with SimpleITK. Journal
of Statistical Software.
Figures