4990
Diffusion artefact appearance in MRI with ultra-high spatial resolution1Ulm University, Ulm, Germany
Synopsis
Keywords: Artifacts, Artifacts
Motivation: Effect of free diffusion introduced image blur is well known but measurable samples always have solid boundaries which results in non-blur like artefacts in ultra-high-resolution images.
Goal(s): Demonstration of diffusion introduced artefact behavior near impermeable barriers.
Approach: A Monte Carlo simulation of particles undergoing a random walk was performed and CTI specific point spread functions (PSFs) and 1D images determined.
Results: It was demonstrated that the PSF yields asymmetric blur and signal enhancement in direct vicinity of the barrier. Simulations clearly indicating the PSF to be dependent on spatial resolution and gradient strength.
Impact: These results will help to prohibit misinterpretation of MR images of small structures with ultra-high-resolution MRI.
Introduction
Constant Time Imaging (CTI)1 has previously demonstrated its capacity to produce images with an isotropic resolution of (3µm)³. However, spatial resolution in the µm range is primarily hindered by two factors: signal-to-noise ratio (SNR) and diffusion effects. While the deficiency in SNR can be addressed through techniques such as signal averaging or hardware enhancements, diffusion-induced image distortions can be managed by employing high gradients. It is widely accepted that the impact of free diffusion can be represented in a Point Spread Function (PSF)2,3,4. This study investigates the effect of diffusion hindering barriers on the PSF. To this end, random walks of numerous particles influenced by an impermeable barrier were simulated, and the corresponding PSFs and images were determined.Methods
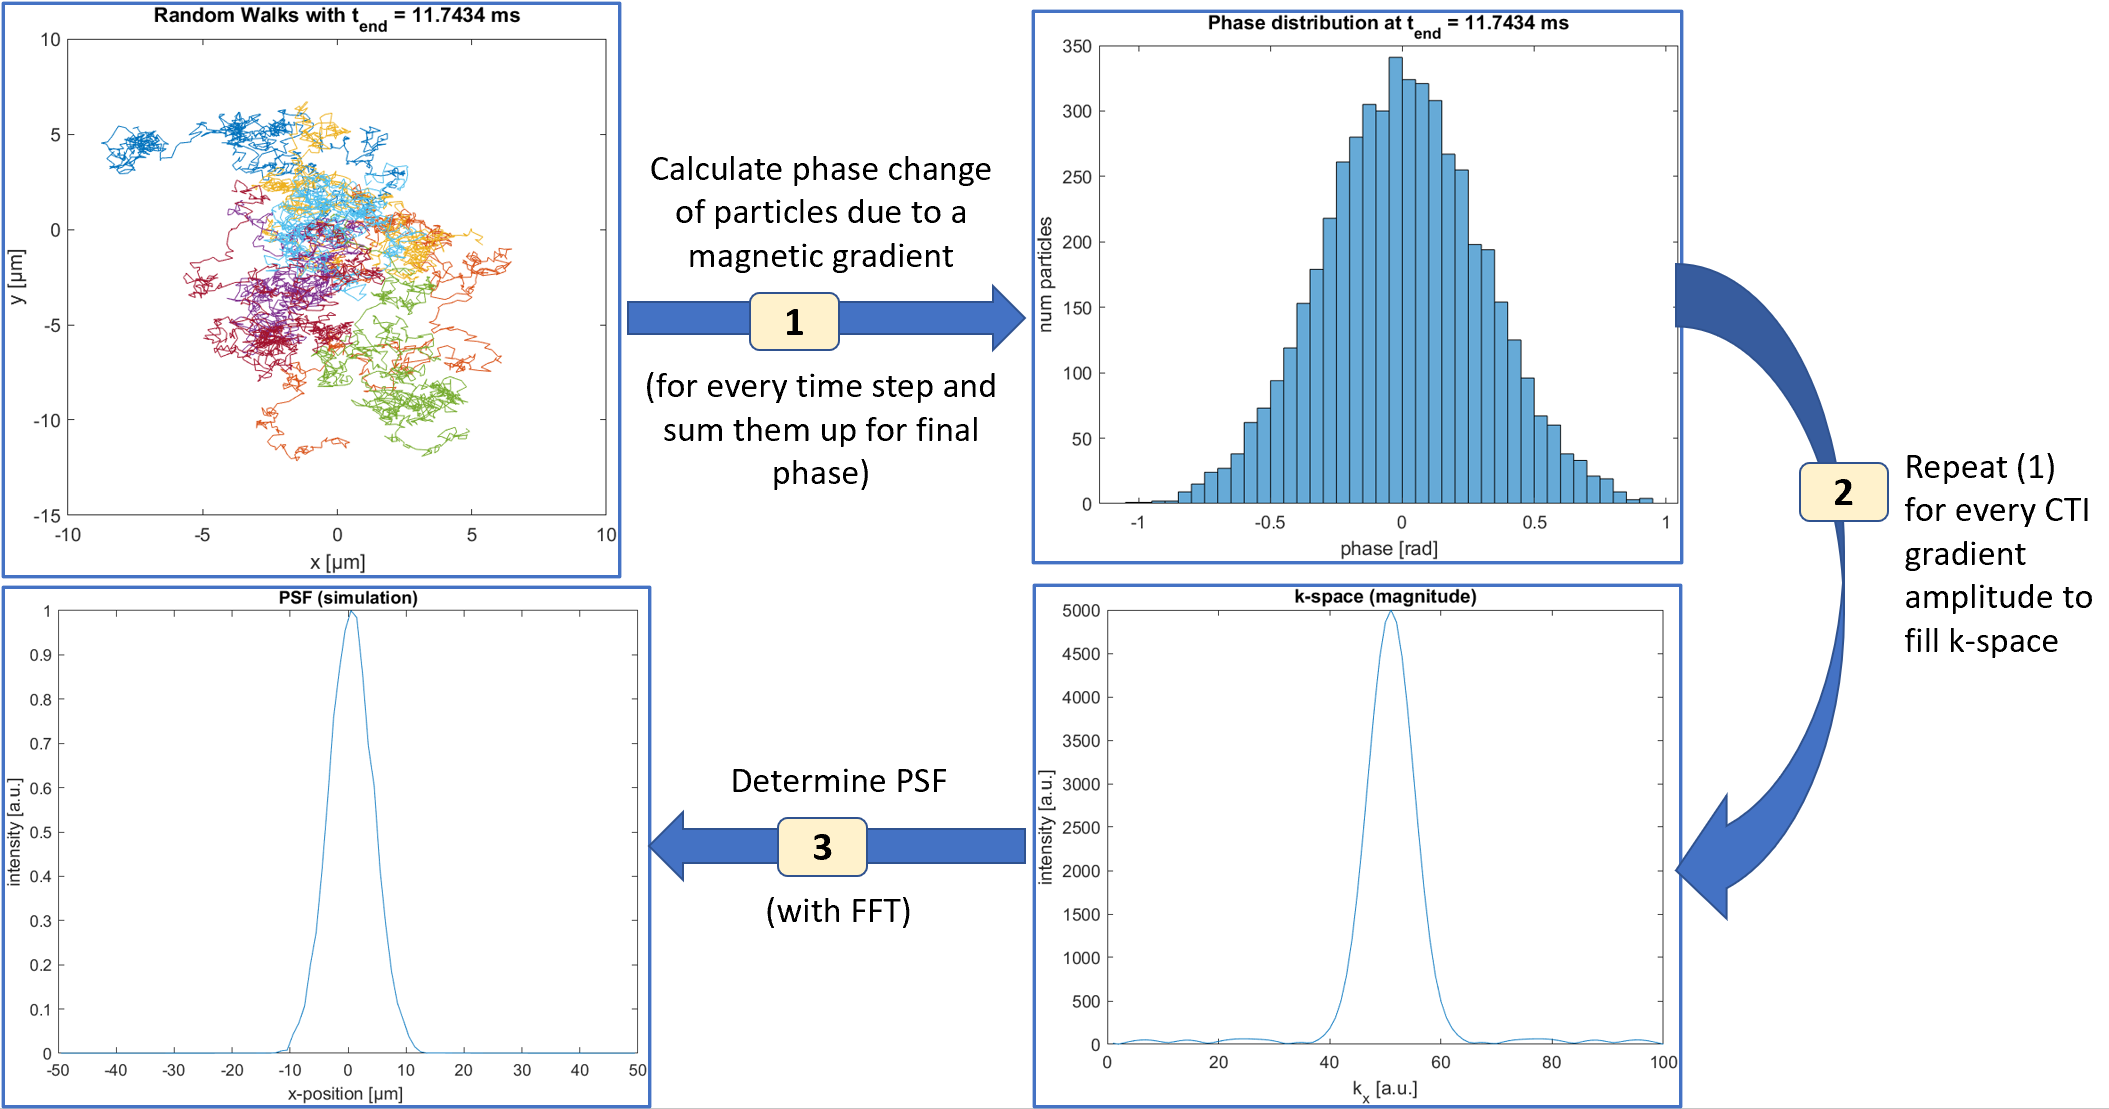
The CTI sequence is composed of an excitation pulse, succeeded by a phase encoding gradient. This gradient is presumed to be rectangular with an amplitude $$$G_{max}$$$ and duration $$$t_{enc}$$$. This is followed by data acquisition.Monte Carlo simulations were employed to calculate the random walks, utilizing MATLAB 2021b (MathWorks,Natick,MA,USA). For each step time $$$Δt$$$ of the random walks, the spins’ displacements are $$$Δr$$$ in a random direction $$$|Δr|=\sqrt{6D_{free}Δt}$$$ with a diffusion coefficient $$$D_{free}=2\cdot10^{-9}m^2/s$$$ 5. The number of diffusion particles was experimentally chosen to be 50,000, as well as 1,000 time steps that defined the step time $$$Δt=t_{enc}/1000$$$. The phase added to a particle at position $$$x$$$ for a single time step is $$$Δφ=γGxΔt$$$. The contribution of one particle to the signal at the end of encoding is the cosine of its final phase. The measurable signal is equal to the sum of signals from all particles.
The computation of measurable signal was re-iterated for different gradient strengths to completely fill k-space (figure 1). The presence of a barrier was accounted for by defining an area with $$$x>0$$$ where particles are not permitted. If an iteration results in particles in the restricted area, the step is repeated for those specific particles6,7.
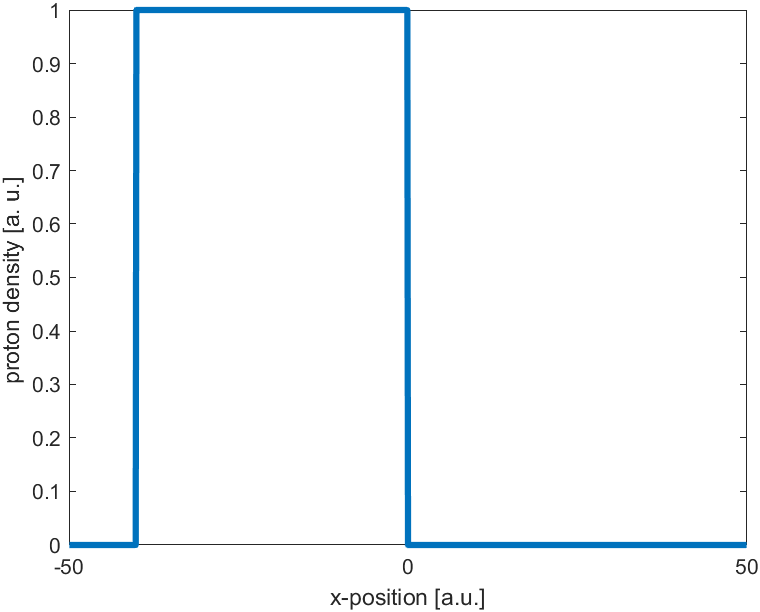
For the calculation of diffusion-impacted PSFs, all particles are initially positioned at the origin at $$$t=0$$$. For one-dimensional imaging, particles were evenly distributed along the line $$$y=z=0$$$, starting from the origin to -40% of the FOV (figure 4).
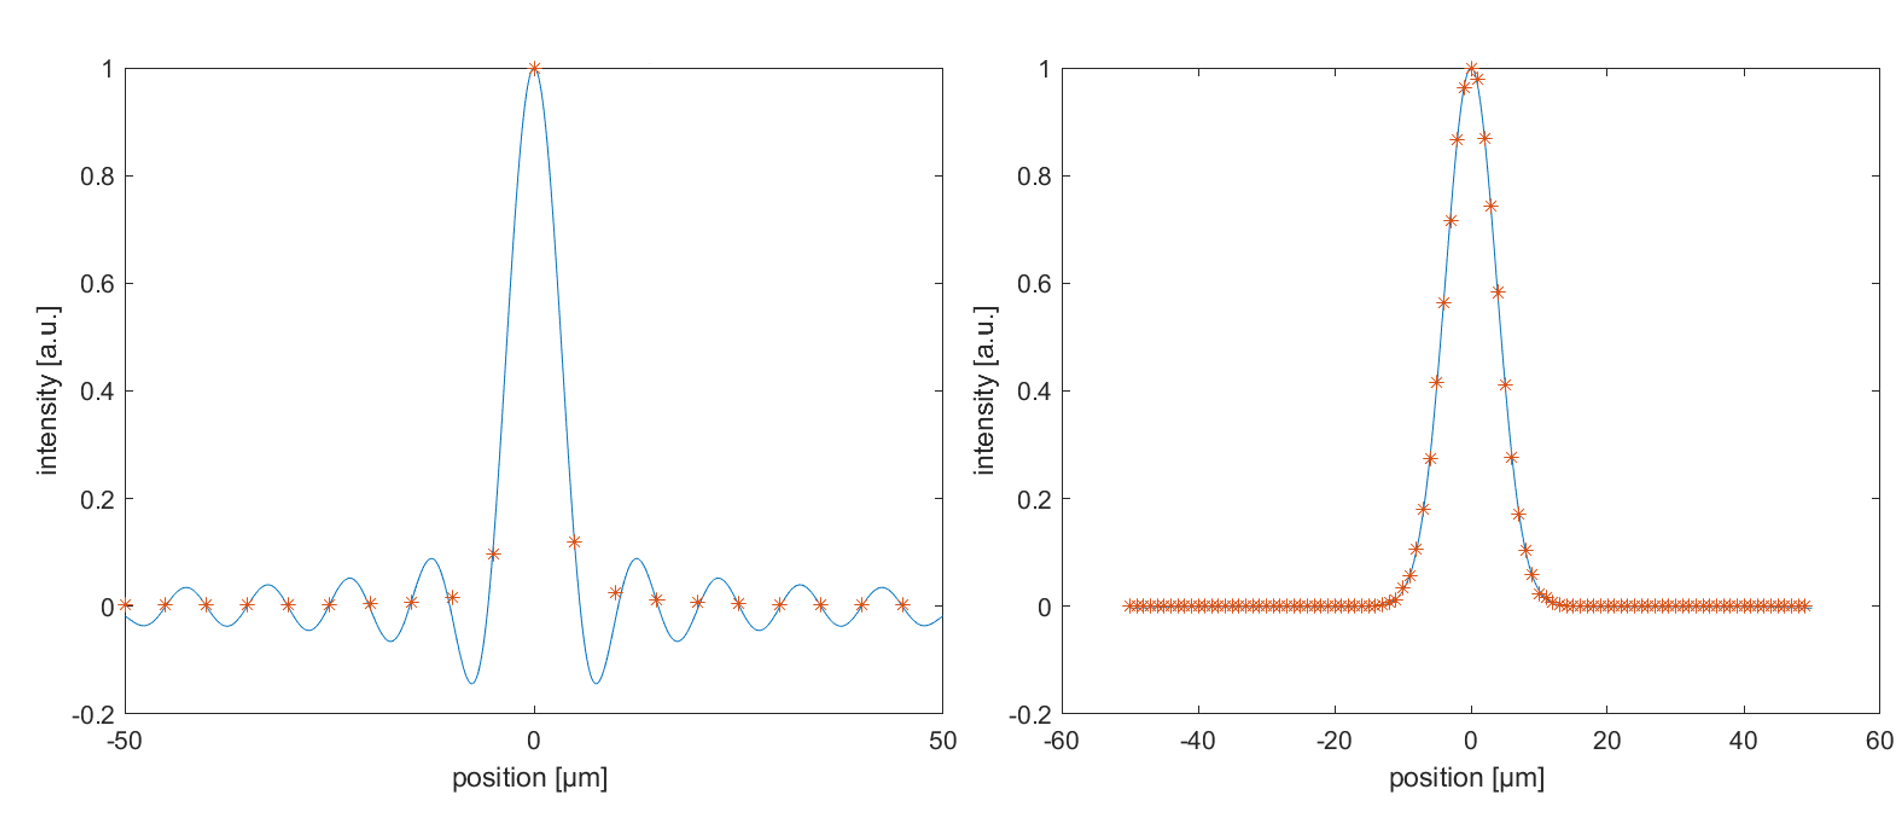
For comparison purposes, analytical PSFs were computed based on A.G. Webb’s publication, considering both, free diffusion and sampling.
Results
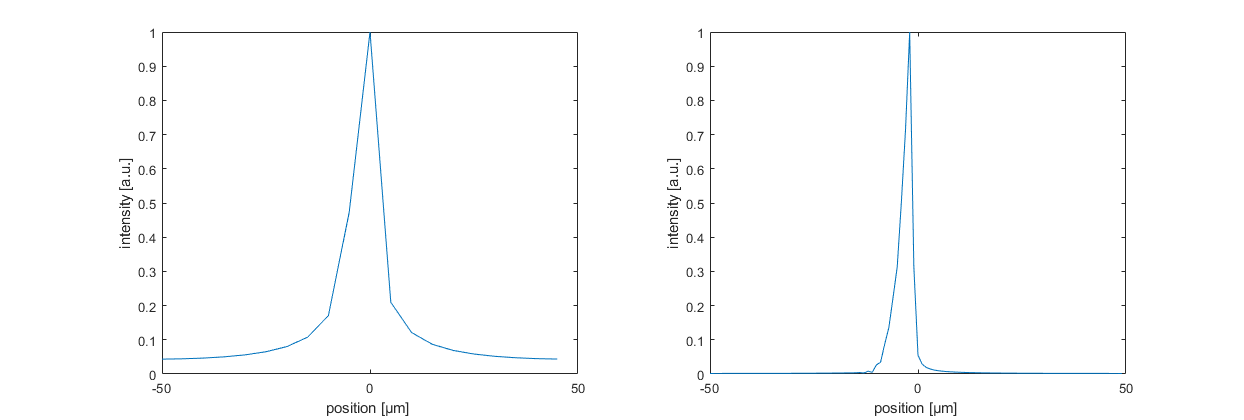
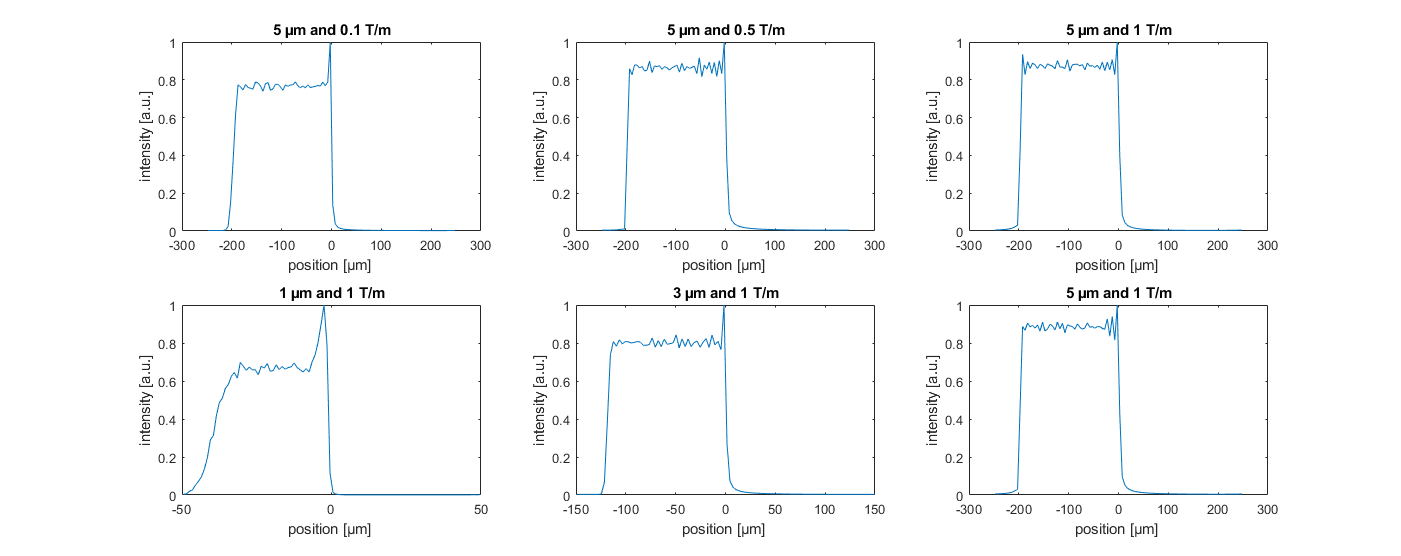
Figure 2 depicts the results of the random walk simulated (orange stars) with analytically determinable PSFs (blue line) at 5 and 1µm spatial resolution. Maximum gradient amplitude was chosen as 1T/m. Figure 3 shows simulation results for PSFs under the influence of an impermeable barrier with resolutions of 5 and 1µm, respectively. Simulated 1D images are shown in figure 5 for varying gradient strengths of 0.1, 0.5 and 1T/m at a constant resolution of 5µm, and varying spatial resolution of 1, 3 and 5µm at constant gradient strength of 1T/m.Discussion
The data presented in figure 2 indicates a strong correlation between the simulation and the theoretical PSF3. The minor misalignment observed at the minima adjacent to the global maximum for the 5µm resolution can be attributed to the finite number of particles utilized in the simulation.Simulated PSFs depicted in figure 3 show an almost symmetric shape for 5µm resolution that is comparable to unrestricted diffusion (figure 2). However, for 1µm resolution the PSF results highly asymmetric and the FWHM becomes smaller. This clearly shows the increasing impact of the barrier with decreasing spatial pixel size at constant gradient strength.
The residual noise-like ripples on the plateaus (figure 5) is most likely caused by the limited number of particles. An obvious difference in the image blur between the unrestricted (left) and restricted diffusion (right side of object) can be observed. Where in case of unrestricted diffusion the expected image blur can be observed in case of restricted diffusion a clear signal increase with decreasing distance to the barrier occurs. The signal increase depends on gradient strength and spatial resolution. This effect is new and has not be shown in other related or recent work like 1,2,3,4
Conclusion
This work can help to prohibit misinterpretation of MR images of small structures especially with the ongoing development in high resolution MRI. It examined that in the direct vicinity of an impermeable barrier, the impact of diffusion on CTI causes signal increase. The amplitude, as well as the width of this artefact increases with smaller spatial dimensions of pixels and lower gradient amplitudes. This effect has to be considered for final image interpretation of high-resolution MRI.Acknowledgements
The authors thank the Ulm University Center for Translational Imaging MoMAN for its support.References
1: WEIGER, Markus, et al. NMR microscopy with isotropic resolution of 3.0 μm using dedicated hardware and optimized methods. Concepts in Magnetic Resonance Part B: Magnetic Resonance Engineering: An Educational Journal, 2008, 33. Jg., Nr. 2, S. 84-93.
2: CALLAGHAN, P. T.; ECCLES, C. D. Diffusion-limited resolution in nuclear magnetic resonance microscopy. Journal of Magnetic Resonance (1969), 1988, 78. Jg., Nr. 1, S. 1-8.
3: WEBB, A. G. Optimizing the point spread function in phase‐encoded magnetic resonance microscopy. Concepts in Magnetic Resonance Part A: An Educational Journal, 2004, 22. Jg., Nr. 1, S. 25-36.
4: GRAVINA, Samuel; CORY, D. G. Sensitivity and resolution of constant-time imaging. Journal of Magnetic Resonance, Series B, 1994, 104. Jg., Nr. 1, S. 53-61.
5: HOLZ, Manfred; HEIL, Stefan R.; SACCO, Antonio. Temperature-dependent self-diffusion coefficients of water and six selected molecular liquids for calibration in accurate 1H NMR PFG measurements. Physical Chemistry Chemical Physics, 2000, 2. Jg., Nr. 20, S. 4740-4742.
6: GILANI, Nima; MALCOLM, Paul; JOHNSON, Glyn. An improved model for prostate diffusion incorporating the results of Monte Carlo simulations of diffusion in the cellular compartment. NMR in Biomedicine, 2017, 30. Jg., Nr. 12, S. e3782.
7: GILANI, Nima; MALCOLM, Paul; JOHNSON, Glyn. A monte carlo study of restricted diffusion: Implications for diffusion MRI of prostate cancer. Magnetic Resonance in Medicine, 2017, 77. Jg., Nr. 4, S. 1671-1677.
Figures