4981
Combining Inhomogeneous Magnetization Transfer and Myelin Water Imaging at 9.4T: Methodology and Limitations1Physics & Astronomy, University of British Columbia, Vancouver, BC, Canada, 2Radiology, University of British Columbia, Vancouver, BC, Canada, 3UBC MRI Research, Vancouver, BC, Canada
Synopsis
Keywords: White Matter, Spinal Cord
Motivation: Myelin imaging techniques are often qualitative and lack specificity, hindering precise understanding of white matter and neurodegenerative diseases.
Goal(s): This study aimed to enhance myelin imaging by combining Inhomogeneous Magnetization Transfer (ihMT) and Myelin Water Imaging (MWI) at 9.4T.
Approach: Incorporating ihMT saturation pulses with the multi-echo spin-echo MWI readout acquisition facilitates myelin quantification through multi-contrast mechanisms. ihMT images protons with extended dipolar relaxation times, while MWI extracts myelin water contributions from T2 distributions.
Results: Results revealed irregularities due to high-field-induced shortening of myelin water T2 values. Therefore, full T2 distributions could not be resolved, impeding further analyses such as myelin quantification.
Impact: This study presents a myelin-specific imaging approach through the fusion of two quantitative techniques at 9.4T. Unresolved myelin water T2 peaks caused by the high field strength present a challenge, underscoring the need for further exploration at lower field strengths.
Introduction
Myelin, a multilamellar membrane of lipids and proteins, insulates neurons' axons, promoting efficient electrical impulse transmission. It serves as a critical biomarker for neurodegenerative autoimmune conditions like multiple sclerosis1. Inhomogeneous Magnetization Transfer (ihMT) and Myelin Water Imaging (MWI) are advanced MRI techniques with the potential to quantify myelin. Combining these methods leverages distinct physical principles for comprehensive insights into the myelin microenvironment. However, signal-to-noise ratio (SNR) has so far limited the success of this combination at 7T in the past2. To address the challenge posed by the high SNR demands of the joint method, the objective was to investigate the ihMT-MWI protocol at the high field strength of 9.4T.Methods
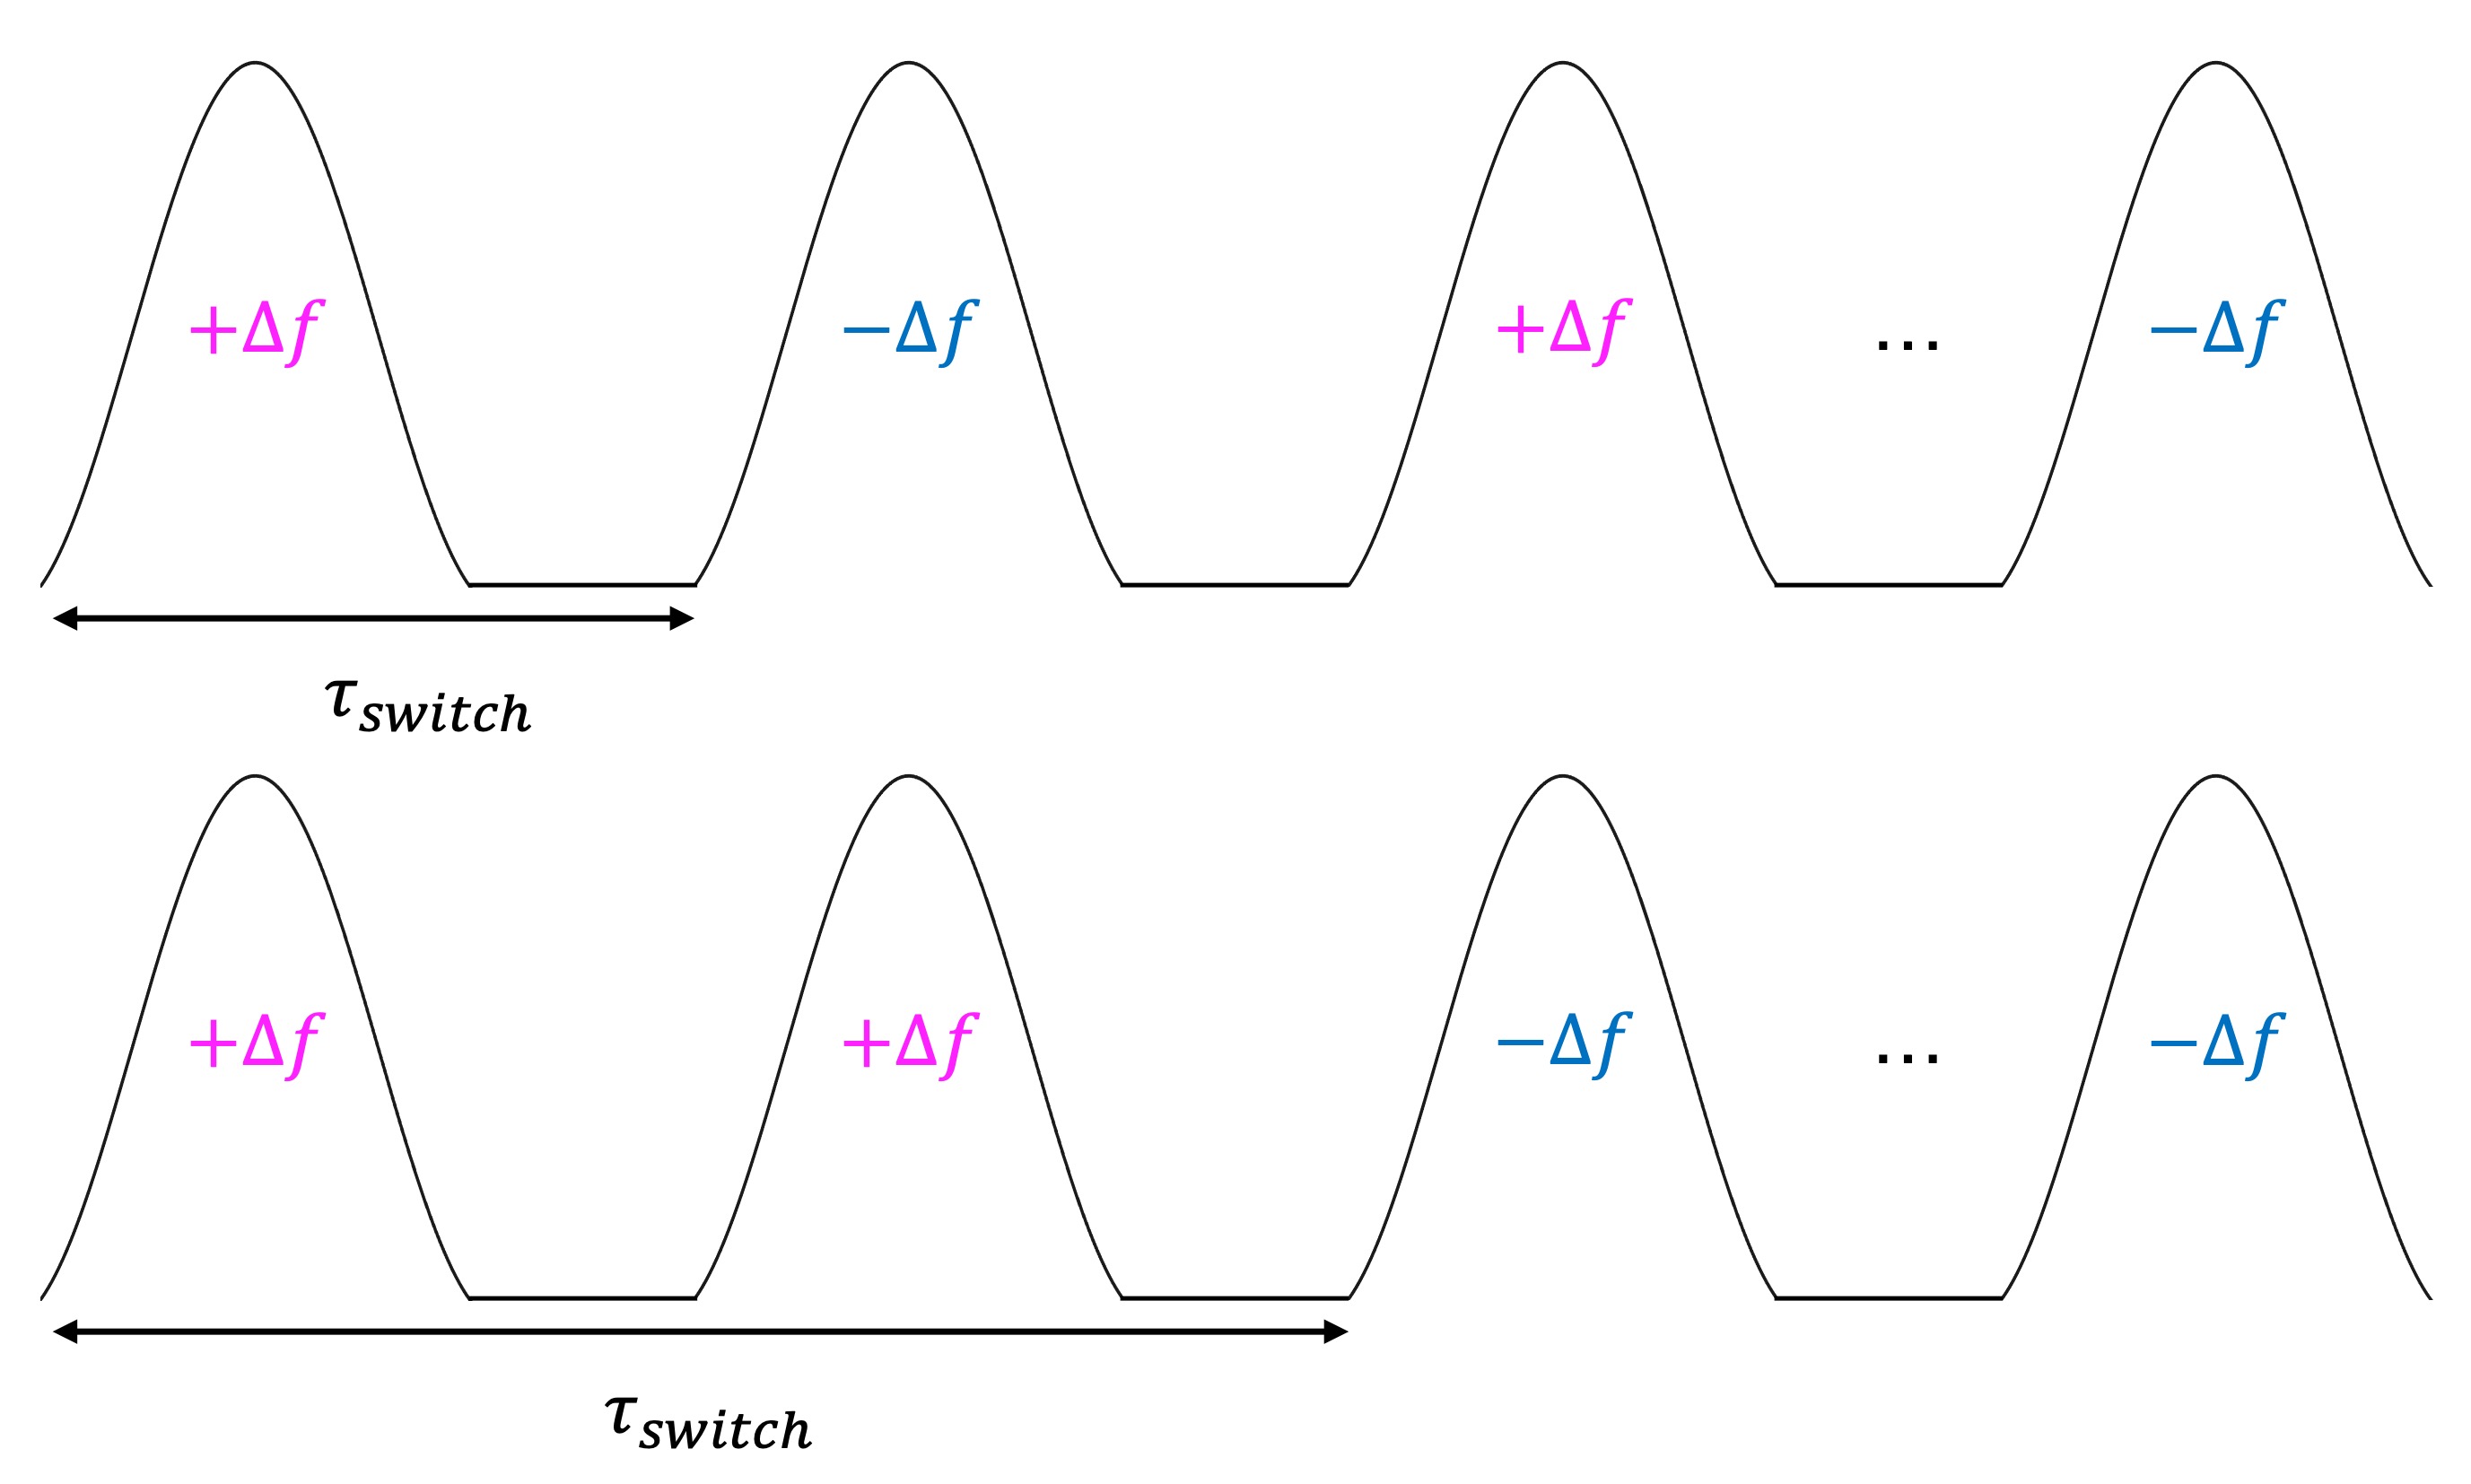
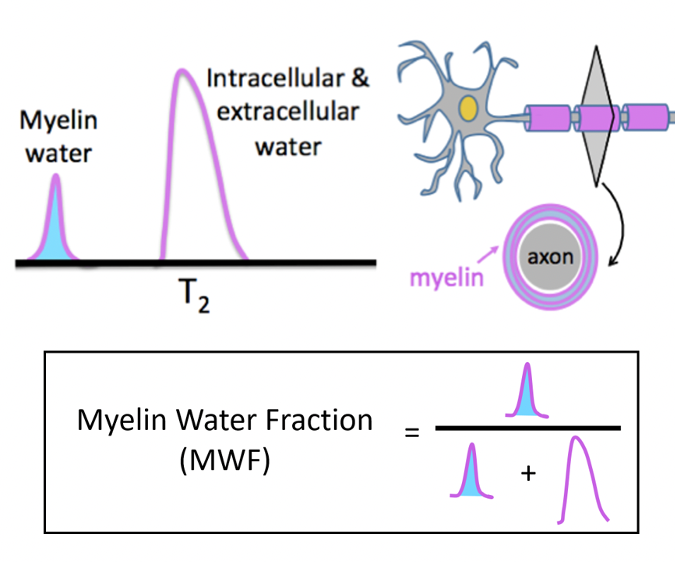
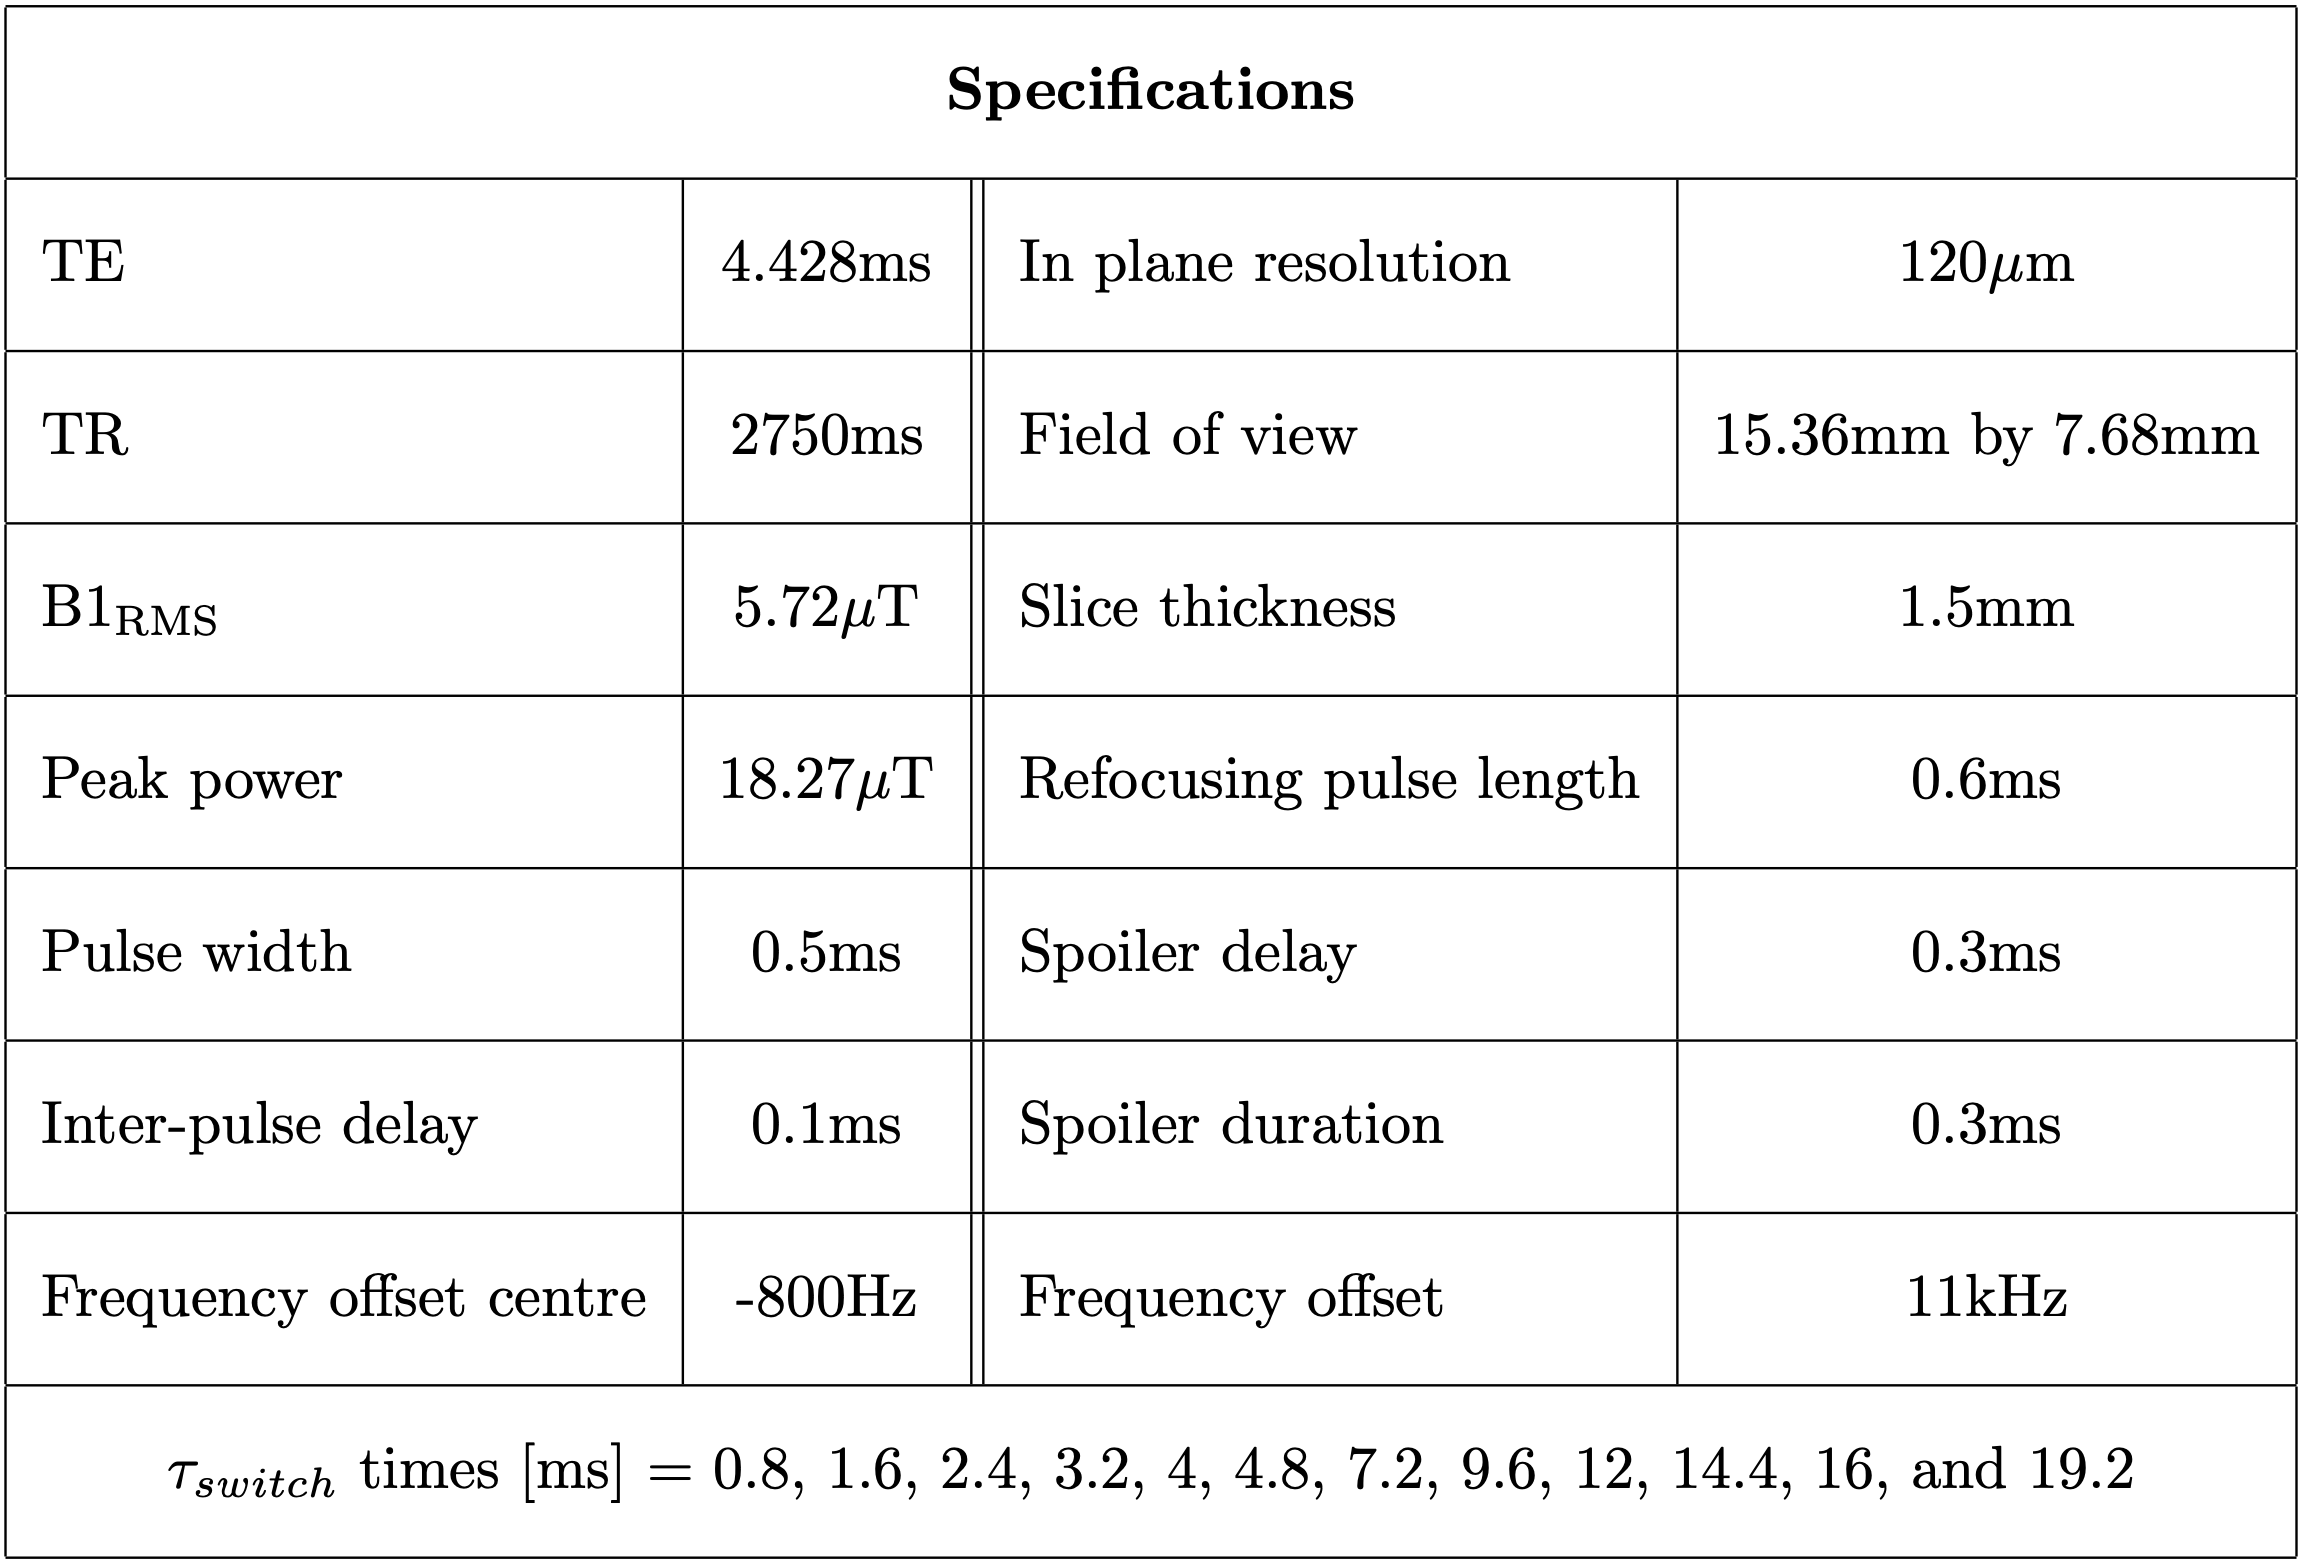
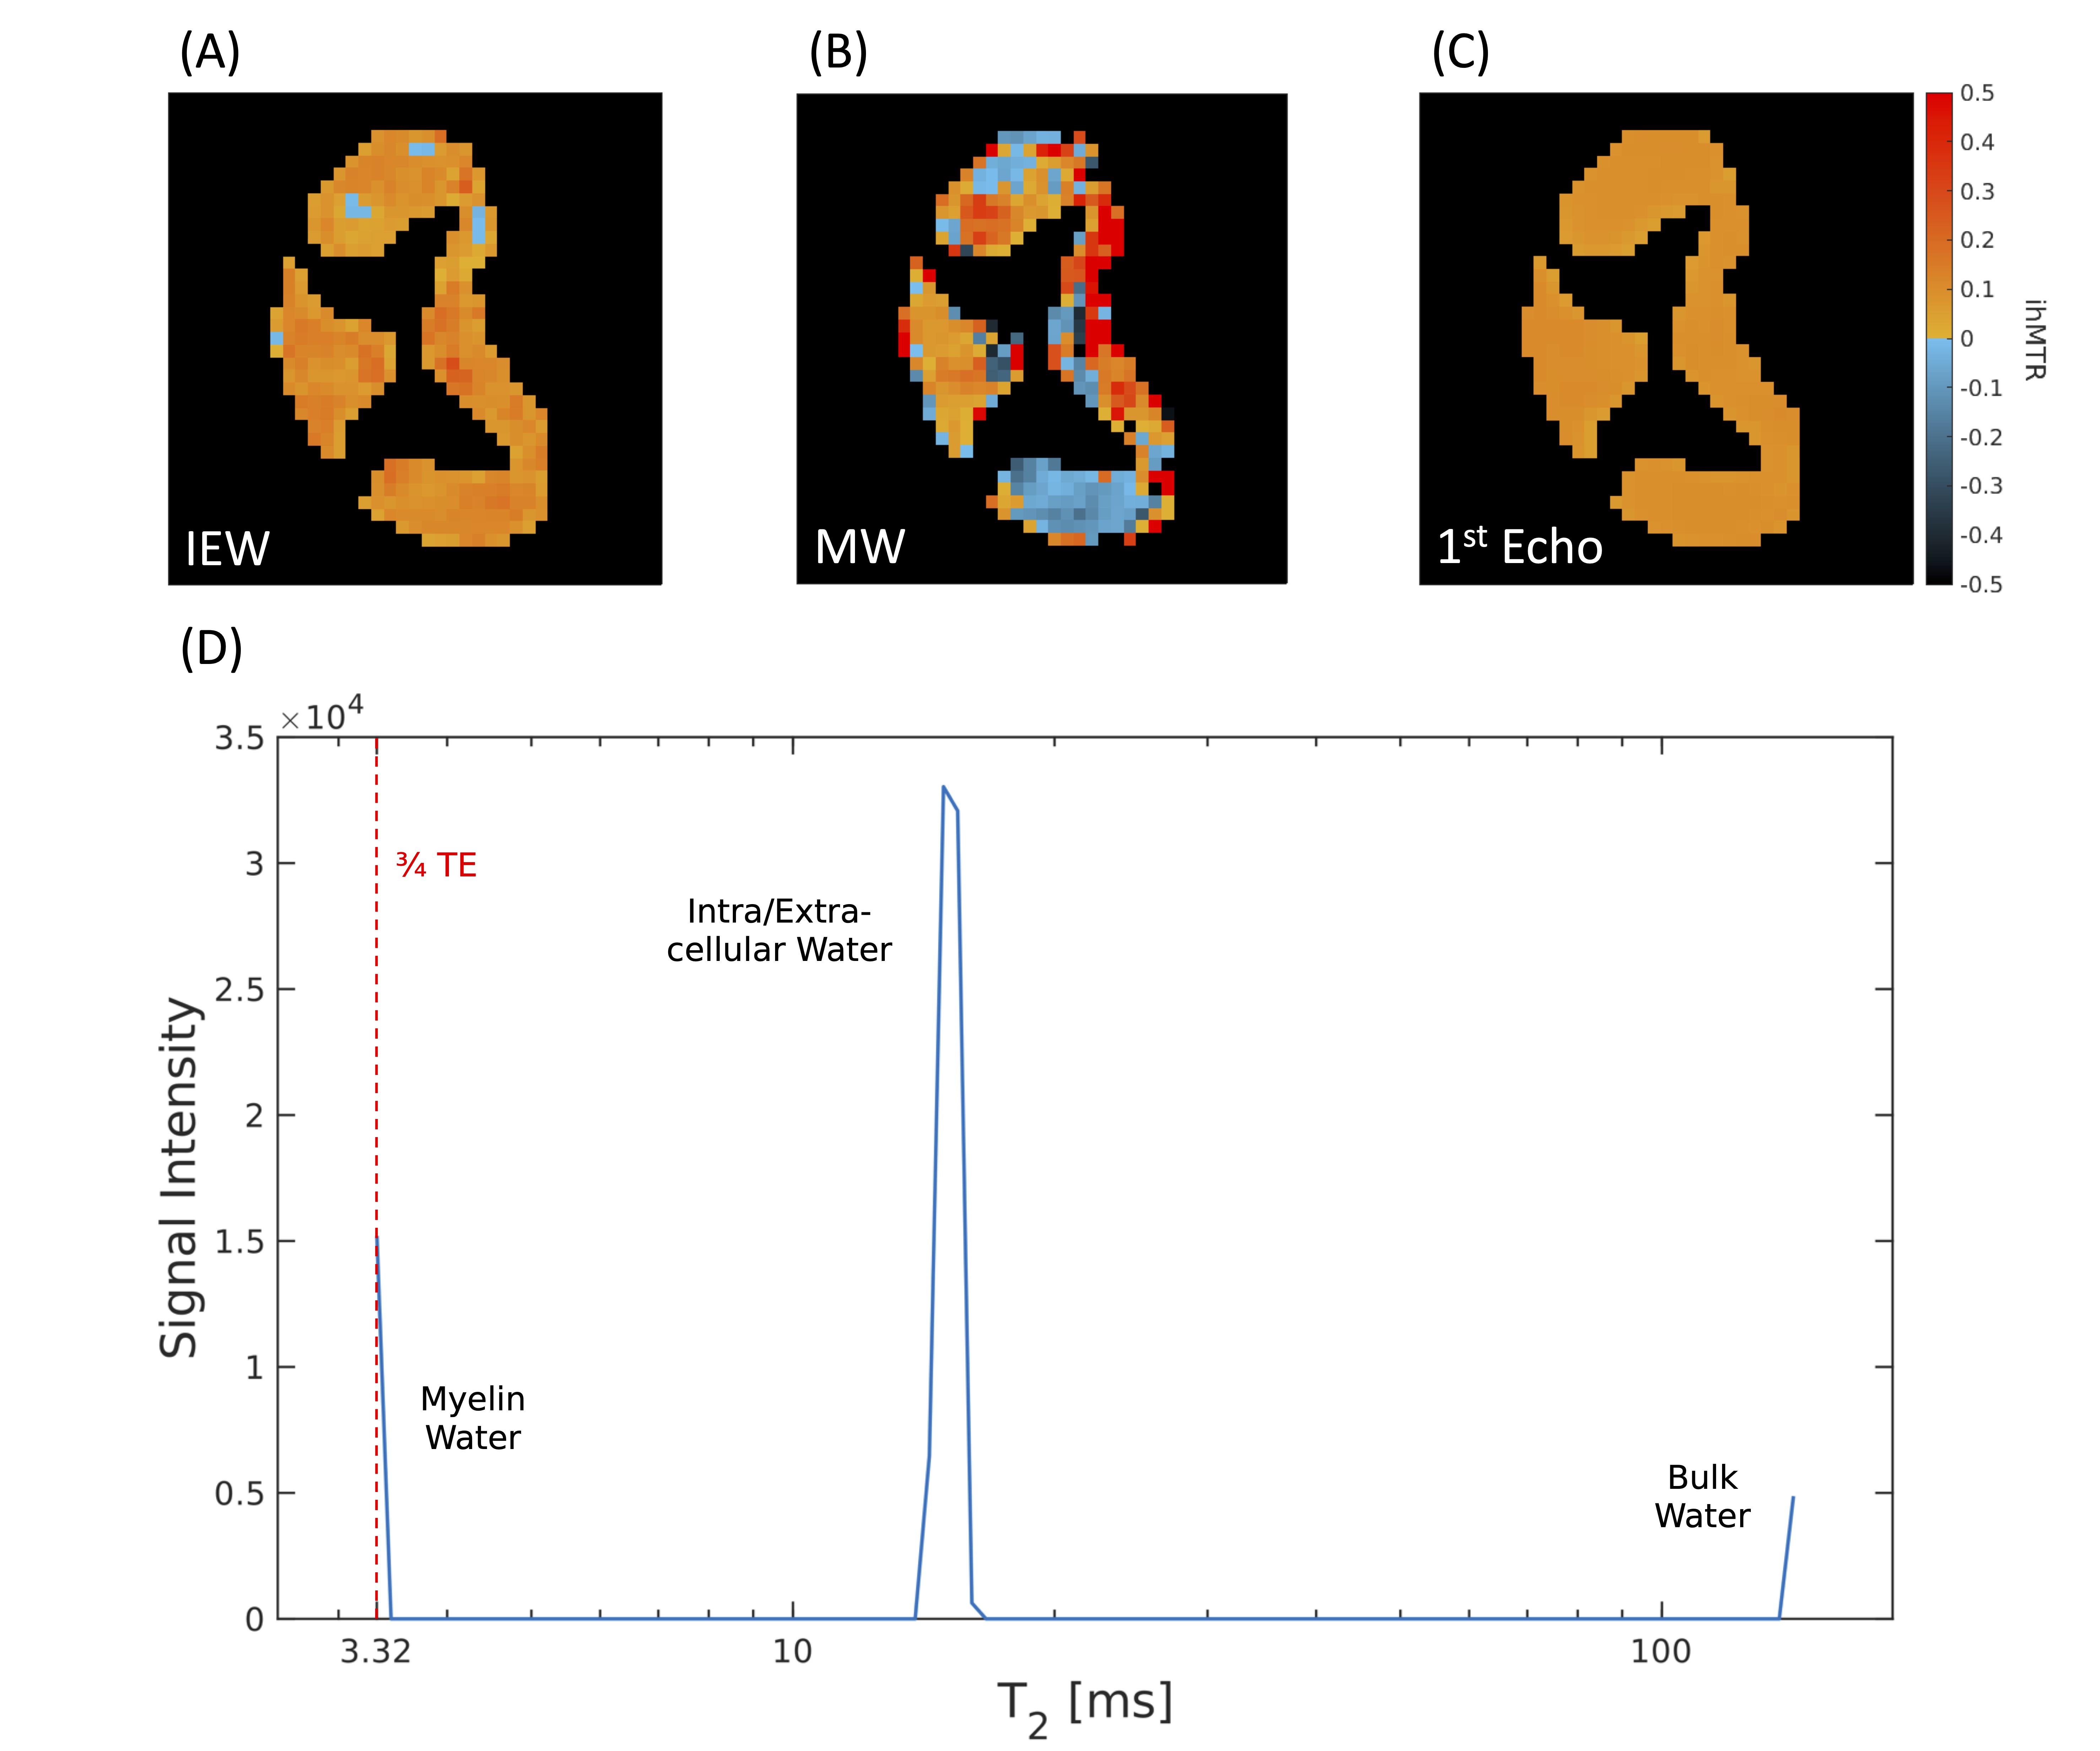
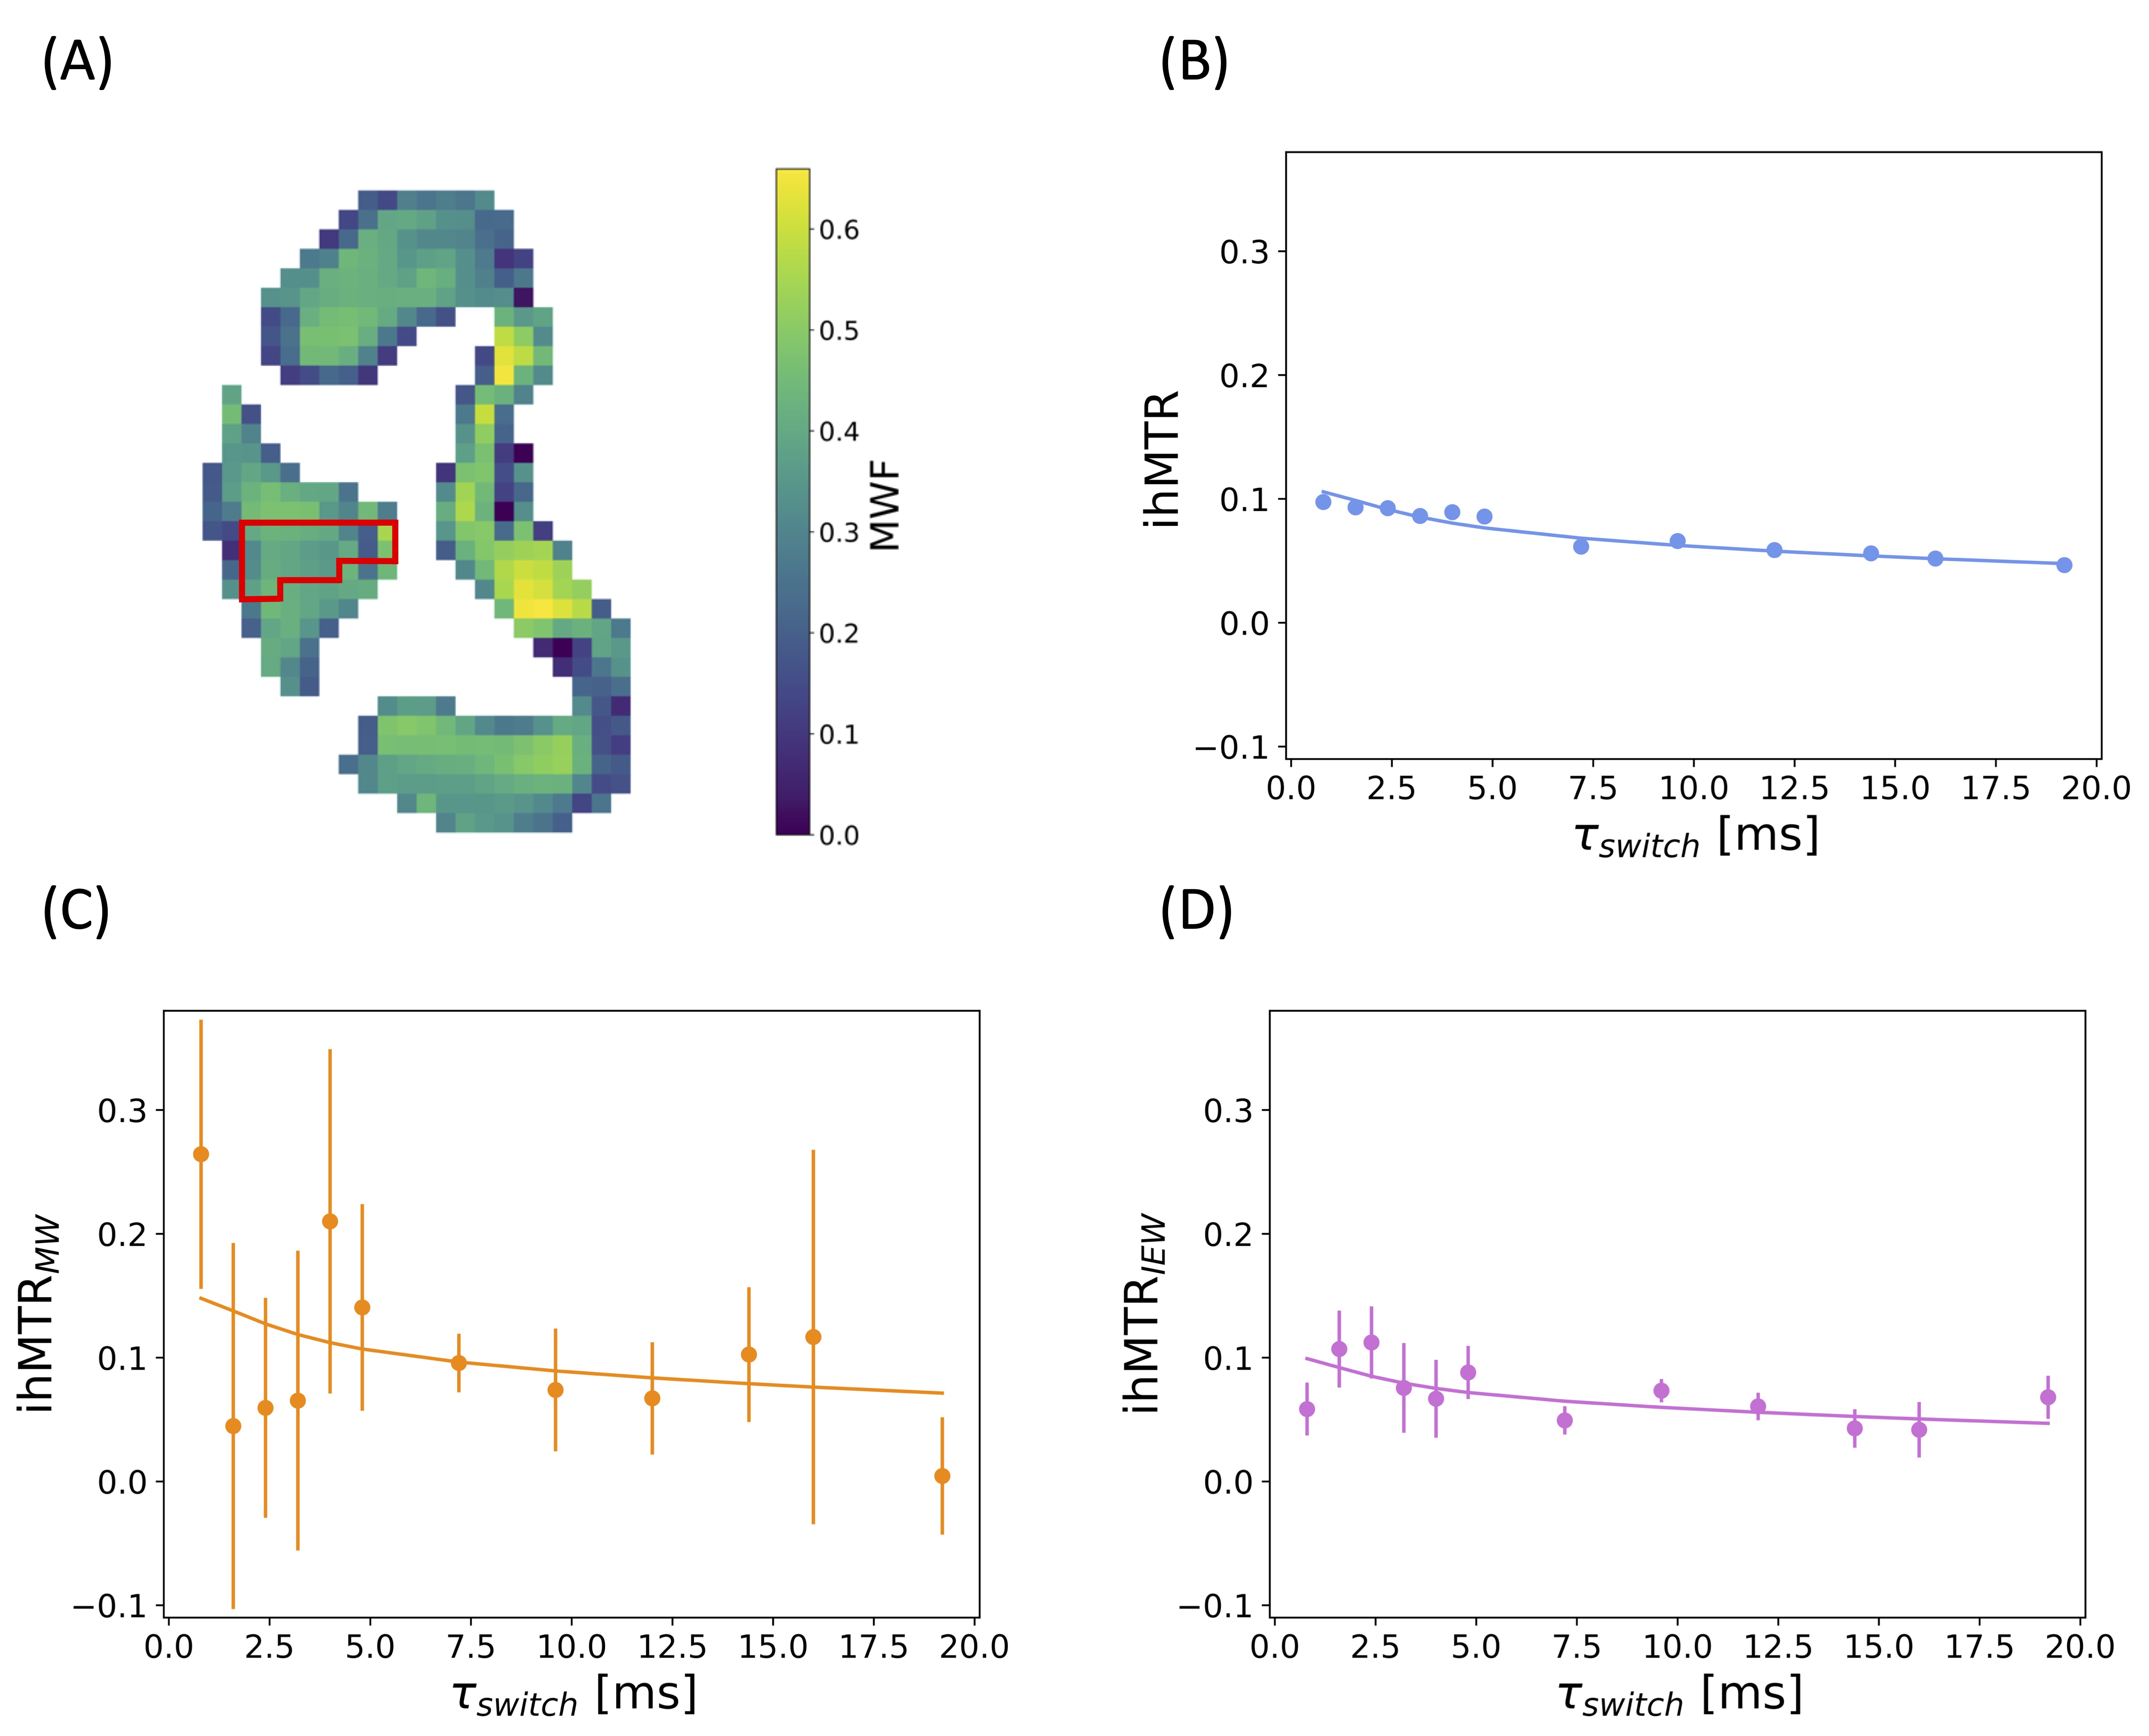
The ihMT protocols involve a series of scans utilizing extended saturation pulse trains, including single polarity ($$$S_+$$$ or $$$S_-$$$), alternating polarity ($$$S_{dual}$$$), and a reference scan without saturation ($$$S_0$$$), essential for computing the ihMT ratio (Eq.1).$$ihMTR=\frac{S_++S_--2S_{dual}}{2S_0} (1)$$Using alternating pulses for the dual saturation preparation, the number of pulses within a single polarity segment can be adjusted to enable varying degrees of T1D filtering, where T1D is the dipolar relaxation time. Longer T1D values are linked to protons predominantly influenced by dipolar coupling, such as those confined within myelin's lipid bilayer structure3. These trapped protons are referred to as myelin water. Increasing the number of pulses per segment and, consequently, the time between switching polarities ($$$\tau_{switch}$$$) (Fig.1), causes protons with shorter T1D times to lose coherence before acquisition, thereby contributing minimally to the signal. This approach enhances specificity for protons with extended dipolar relaxation times, ultimately improving myelin imaging through ihMT.Myelin water's distinct relaxation properties, resulting from its unique environment, can be explored via myelin water imaging (MWI). MWI utilizes a multi-echo spin-echo readout acquisition to generate echo decay data, which is then fitted to extract T2 distributions. The area under the myelin water (MW) and intra/extra-cellular water (IEW) T2 peaks can then be used to calculate the myelin water fraction (Fig.2 & Eq.2).$$MWF=\frac{A_{MW}}{A_{MW}+A_{IEW}} (2)$$By combining ihMT's saturation preparations with MWI's readout acquisition, a myelin-specific technique was developed. This method was optimized and tested on a cohort of 17 formalin-fixed excised rat spinal cord samples, collected at various stages following a dorsal column transection injury: six controls, five at 3 weeks post-injury, and six at 8 weeks post-injury. Specifically, an experiment in which twelve $$$\tau_{switch}$$$ times were tested to vary the level of T1D filtering was carried out. Refer to Table 1 for sequence specifications. Each acquisition cycle consisted of 24 echoes which were then denoised and fitted to extract T2 distributions. These were subsequently combined to generate ihMTR maps using the equations below, which utilize the areas under the MW and IEW peaks (Fig.3). ihMTR as a function of $$$\tau_{switch}$$$ was then plotted and subjected to fitting using an expanded 4-pool model (Fig.4).$$ihMTR_{MW}= \Big(\frac{A_{S_+}+A_{S_-}-2A_{S_{dual}}}{2A_{S_0}}\Big)_{MW} (3)$$$$ihMTR_{IEW}= \Big(\frac{A_{S_+}+A_{S_-}-2A_{S_{dual}}}{2A_{S_0}}\Big)_{IEW} (4)$$
Results & Further Exploration
The anticipated trend was a decrease in ihMTR as $$$\tau_{switch}$$$ increased. This held mostly true for the first echo and IEW ihMTR across all samples; however, the data for ihMTR$$$_{MW}$$$ exhibited erratic behaviour which defied this expected trend (Figs.3-4).As white matter's T2 values decrease with higher field strength4, the likely cause for this anomaly was the presence of unresolved short T2 peaks associated with myelin water. These peaks were truncated (Fig.3), distorting area estimates and impeding the scanner's ability to detect the effects of dual saturation pulses, hindering subsequent analyses.
To assess the feasibility of obtaining the desired data, a focused experiment was devised to identifying the true T2 relaxation time for myelin water at 9.4T. This experiment aimed to overcome limitations imposed by echo-time (TE) without the need for imaging, reducing the TE to 1.66ms. This resulted in a one-dimensional dataset of a dissected white matter sample from a control rat spinal cord.
The experiment revealed peaks in the range of 3-4ms for MW, with some values falling below 3ms. Analysis confirmed that only T2 values exceeding 3/4 of the TE could be resolved. Given the minimum attainable TE in the imaging sequence (4.43ms), the minimum resolvable T2 was calculated at 3.32ms (Fig.3). Thus, MW protons exhibited T2 values too short for full resolution under the hybrid technique's imaging conditions, impacting the resolution of peak amplitudes.
Conclusion
The 9.4T scanner's high field strength resulted in myelin water's T2 value being too short for this hybrid method. Therefore, this study emphasizes the importance of selecting an appropriate field strength when developing advanced myelin imaging techniques. Further exploration at lower field strengths is warranted to unlock the full diagnostic capabilities of this combined ihMT-MWI approach.Acknowledgements
The authors express their gratitude for the research funding provided by the Natural Sciences and Engineering Research Council of Canada, which made this study possible. They also wish to acknowledge the invaluable contributions of their research collaborators at the University of British Columbia.References
1. Compston A. Multiple Sclerosis. The Lancet. 2008;372(9648) :1502-1517.
2. Lam MH. Modelling inhomogeneous magnetization transfer in myelin water and intra-/extra-cellular water in normal and injured excised rat spinal cord. The University of British Columbia: Electronic Theses and Dissertations. October 21, 2021. https://dx.doi.org/10.14288/1.0402566. Accessed August 12, 2022.
3. Kalantari S, Laule C, Bjarnason TA, Vavasour IM, MacKay AL. Insight into in vivo magnetization exchange in human white matter regions. Magn Reson Med. 2011;66(4):1142–1151.
4. Crooks LE, Arakawa M, Hoenninger J, McCarten B, Watts J, Kaufman L. Magnetic resonance imaging: effects of magnetic field strength. Radiology. 1984;151(1):127-33.
Figures