4979
Longitudinal Imaging of Spinal Cord Myelin Following C5 Hemisection Lesions with 3D Ultrashort Echo Time (UTE) Magnetization Transfer MR Imaging1Radiology, UCSD Health, La Jolla, CA, United States, 2Research Service, Veterans Affairs San Diego Healthcare System, San Diego, CA, United States, 3Neuroscience, UCSD Health, La Jolla, CA, United States, 4Radiology Service, Veterans Affairs San Diego Healthcare System, San Diego, La Jolla, CA, United States
Synopsis
Keywords: Spinal Cord, White Matter
Motivation: To characterize the dynamic spinal myelin changes in rats following C5 hemisection lesions, and to monitor the efficacy of stem cells or other remyelination treatments
Goal(s): To detect myelin degeneration or regeneration in the spinal cord after SCI
Approach: The rats were imaged post-injury noninvasively and longitudinally with a UTE-MT sequence for MT ratio (MTR) measurement1. White matter was approximated by thresholding the MTR maps using values from the intact left (contralateral) side of spinal cord.
Results: A decrease in the white matter was observed on the right (ipsilateral) side caudal to the lesions, consistent with known myelin changes following spinal cord injury
Impact: Myelin changes in the rat spinal cord following hemisection lesions can be monitored non-invasively and longitudinally with MT ratio measurement. Such techniques can be used to detect myelin degeneration or regeneration in the spinal cord after SCI.
Summary of Main Findings
Myelin in spinal cord white matter can be approximated by thresholding the MTR maps, and its changes in the rat spinal cord following hemisection lesions can be monitored non-invasively and longitudinally with reasonable resolution to differentiate white matter from gray matter. Such techniques can be used to detect myelin degeneration or regeneration in the spinal cord after SCI.
Introduction
SCI causes myelin loss via degeneration of transected axons and antidromic axonal degeneration. Meanwhile, remyelination may also occur because of axonal sprouting of non-injured neurons, or axonal growth derived from transplanted neural stem cells. These dynamic changes in myelin can be potentially monitored with MR imaging. For example, quantitative two-pool magnetization transfer (MT) modeling techniques have been utilized to evaluate tissue changes in the brain2,3 and spinal cord4,5. In these studies, tissues from humans and large animals were imaged with relatively low resolutions, and their suitability for studying small rodent tissues has not been demonstrated.
We adapted a MT prepared ultrashort echo time (UTE-MT) sequence for MT ratio (MTR) measurement1 to quantify white matter changes in the spinal cord following spinal C5 hemisection lesions. Our goal was to develop a protocol that can noninvasively and longitudinally monitor the dynamic changes in white matter in the spinal cord following injury or subsequent therapy with reasonable resolution that can be practically achieved in intact rats.
Methods
Right lateral C5 spinal cord hemisection lesions were performed in five adult female Fisher 344 rats, and two additional rats without injury were used as controls. Rats were imaged at 2-, 8-, 14-, and 20 weeks postinjury. All imaging was performed on a 3-T MRI scanner (Bruker BioSpec 3-T, Billerica, MA, USA) using an 82 mm volume coil for transmission and a 30 mm surface coil for reception.
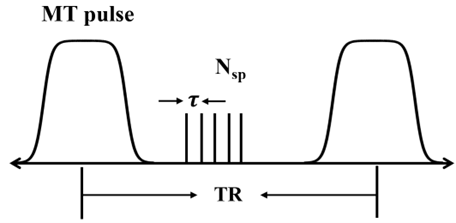
Figure 1 shows the sequence diagram of the 3D UTE-MT sequence. A Fermi-shaped pulse (duration = 8 msec and bandwidth = 160 Hz) was used to generate MT contrast with three different flip angles (FAs) of 1500°, 800° (MT on) and 0° (MT off), and a frequency offset of 1500 Hz. The detailed sequence parameters were field of view (FOV) = 24×24×84 mm3, matrix = 120×120×120, resolution = 200×200 ×700 µm3, TR/TE = 76/0.026 ms, Nsp = 9, τ = 7.6 ms, FA = 10°, bandwidth = 25 kHz, NEX = 3, and the total scan time = 60min. In addition, a product stimulated echo based B1 mapping sequence was also scanned to correct the B1 inhomogeneity of MTR measurement6. The MTR values were calculated with MATLAB (The MathWorks Inc., Natick, MA, USA) using the following equation:
MTR_1500 = (MT_0 – MT_1500) / MT_0 [1]
and MTR_800 = (MT_0 – MT_800) / MTR_0. [2]
MTR_corr = (MTR_1500 + MTR_800)/2 + 1.64(1 – B1) · (MTR_1500 - MTR_800) [3]
The MT_0, MT_800 and MT_1500 were the UTE signals with MT saturation flip angles of 0°, 800°, 1500°, respectively. The MTR_corr is the final B1 corrected MTR map used for data analysis6.
Results and Discussion
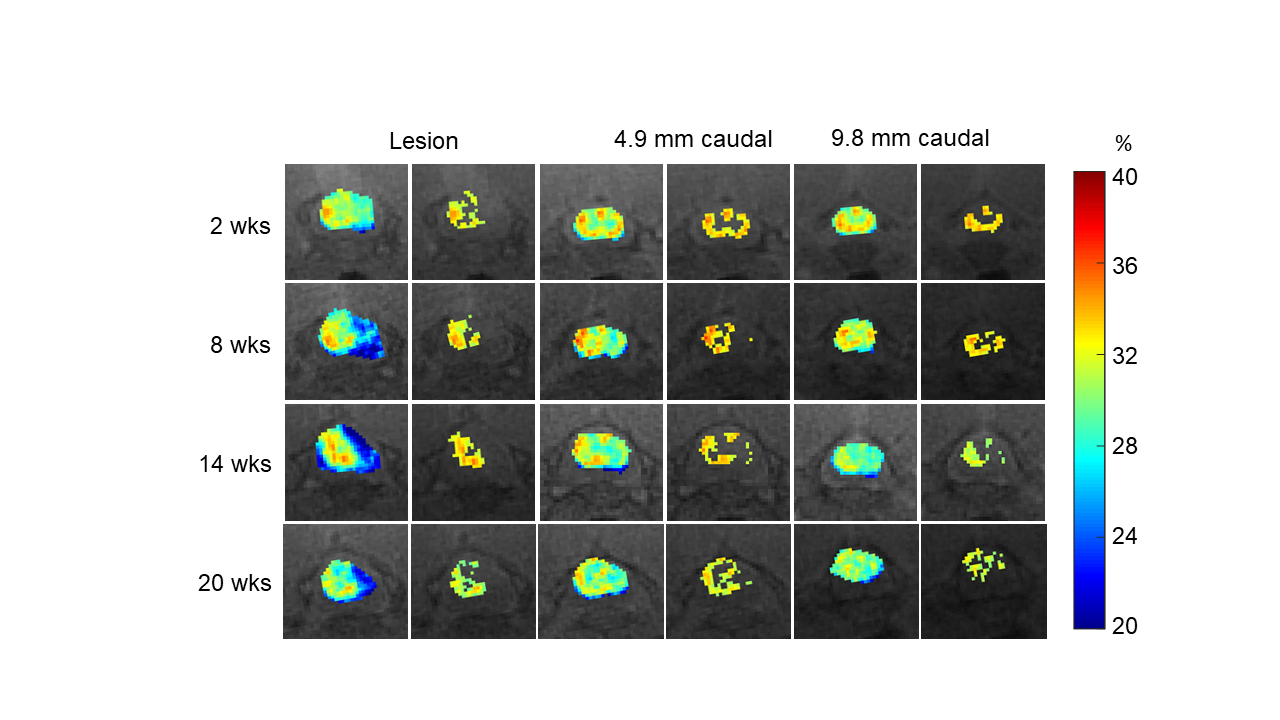
Figure 2 shows MTR mapping from one rat at different spinal cord levels and time points post-injury. The gray matter has slightly lower MTR than the white matter, which can be segmented by thresholding the MTR map using the average MTR of the intact left side of the same slice. Note the gradual decrease in the white matter of the right side of the spinal cord following right lateral hemisection lesions.
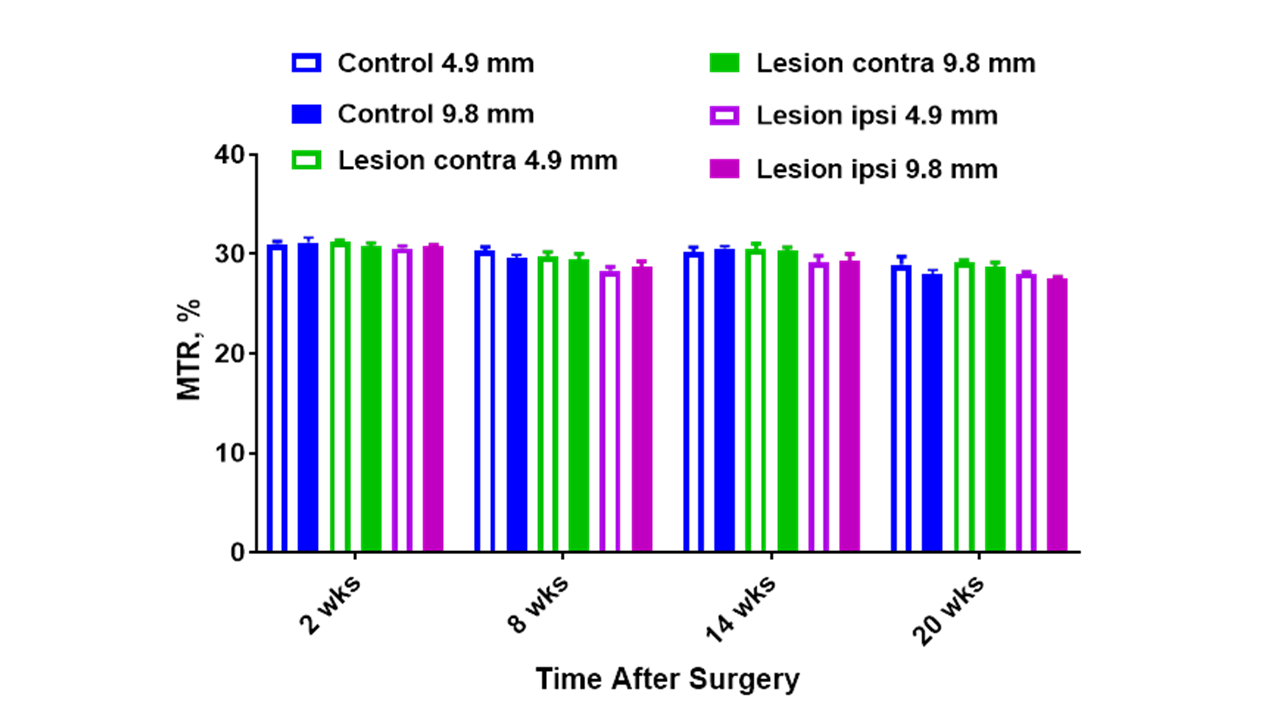
Figure 3 shows that lesion leads to a small decrease in MTR in the ipsilateral side of the spinal cord caudally.
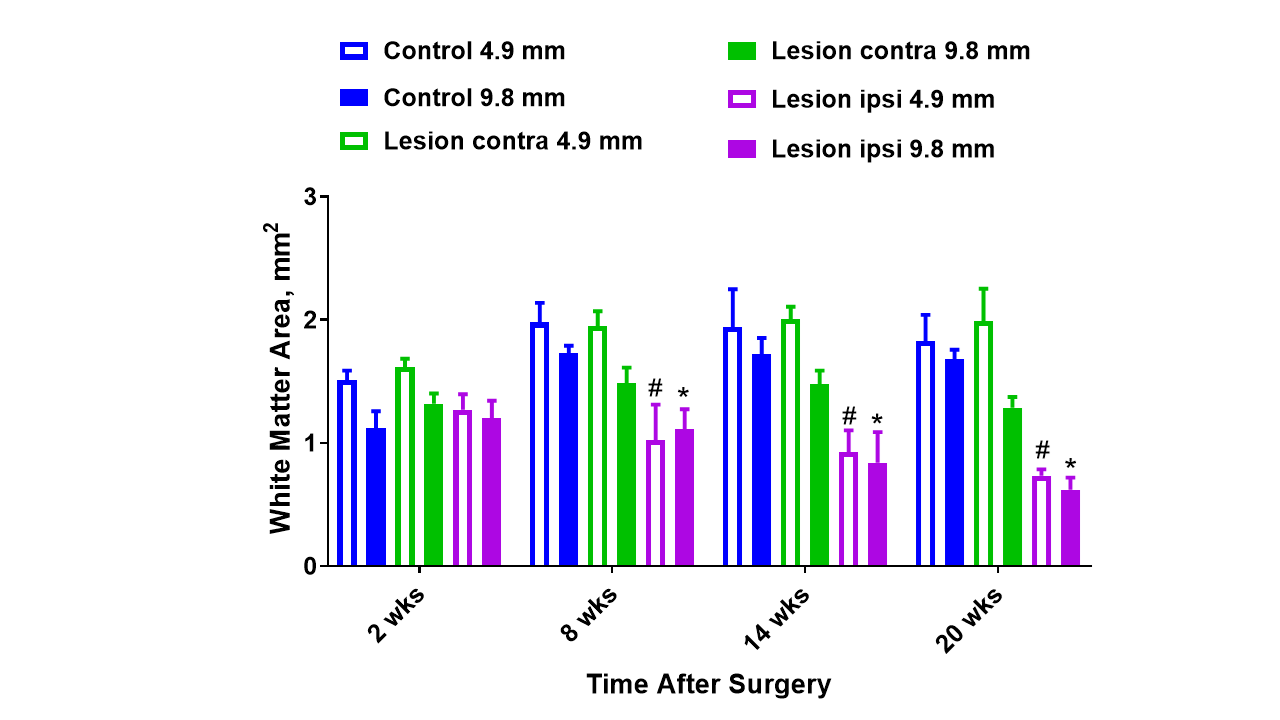
Figure 4 shows area of myelin (white matter) in the ipsilateral side of the spinal cord caudal to lesion decreased gradually following C5 hemisection compared with the corresponding contralateral side.
Conclusion
The 3D UTE MT imaging protocol can differentiate white matter and grey matter, enabling the in vivo characterization of dynamic spinal myelin changes in rats following C5 hemisection lesions, and has potential to monitor the efficacy of stem cells or other remyelination treatments post spinal cord injury.
Acknowledgements
The authors acknowledge grant support from VA Research and Development Services (I01BX005952, I01CX001388, 1 I01 RX003776-01A2 , and I01RX003776) and the National Institutes of Health (R01AR079484, R01AR075825, R01AR068987, and RF1AG075717 ).References
1 Ma, Y. J., Chang, E. Y., Carl, M. & Du, J. Quantitative magnetization transfer ultrashort echo time imaging using a time-efficient 3D multispoke Cones sequence. Magn Reson Med 79, 692-700, doi:10.1002/mrm.26716 (2018).
2 Sled, J. G. & Pike, G. B. Quantitative imaging of magnetization transfer exchange and relaxation properties in vivo using MRI. Magn Reson Med 46, 923-931, doi:10.1002/mrm.1278 (2001).
3 Tozer, D. et al. Quantitative magnetization transfer mapping of bound protons in multiple sclerosis. Magn Reson Med 50, 83-91, doi:10.1002/mrm.10514 (2003).
4 Cohen-Adad, J. et al. Demyelination and degeneration in the injured human spinal cord detected with diffusion and magnetization transfer MRI. Neuroimage 55, 1024-1033, doi:10.1016/j.neuroimage.2010.11.089 (2011).
5 Ugorji, C. O. et al. Grey and White Matter Magnetisation Transfer Ratio Measurements in the Lumbosacral Enlargement: A Pilot In Vivo Study at 3T. PLoS One 10, e0134495, doi:10.1371/journal.pone.0134495 (2015).
6 Afshari, R. et al. One-minute whole-brain magnetization transfer ratio imaging with intrinsic B(1) -correction. Magn Reson Med 85, 2686-2695, doi:10.1002/mrm.28618 (2021).
Figures