4972
Bilateral resting-state functional connectivity reflects spontaneous neural interactions measured by mouse fMRI with optogenetic silencing1Center for Neuroscience Imaging Research, Institute for Basic Science (IBS), Suwon, Korea, Republic of, 2Department of Biomedical Engineering, Sungkyunkwan University, Suwon, Korea, Republic of, 3Department of Intelligent Precision Healthcare Convergence, Sungkyunkwan University, Suwon, Korea, Republic of
Synopsis
Keywords: Functional Connectivity, fMRI
Motivation: Despite the widespread use of resting-state fMRI in the neuroscience field, the relationship between functional connectivity and neural interactions is not fully understood.
Goal(s): We aimed to explore whether resting-state functional connectivity arises from spontaneous neural interactions among brain regions.
Approach: We conducted resting-state and multi-site optogenetic fMRI in excitatory or inhibitory neuron-specific optogenetic mouse models and examined their relationship.
Results: Resting-state functional connectivity patterns were strongly correlated with optogenetic silencing-induced connectivity which revealed extensive intrahemispheric and interhemispheric neural interactions during rest. This result suggests that functional connectivity arises from neural interactions via polysynaptic structural connectivity.
Impact: The results
support the notion that functional connectivity stems from spontaneous neural
interactions between regions. Our next goal is to investigate whether brain
state-dependent functional connectivity alterations stem from enhanced or
weakened neural interactions, using multi-site optogenetic silencing fMRI.
Introduction
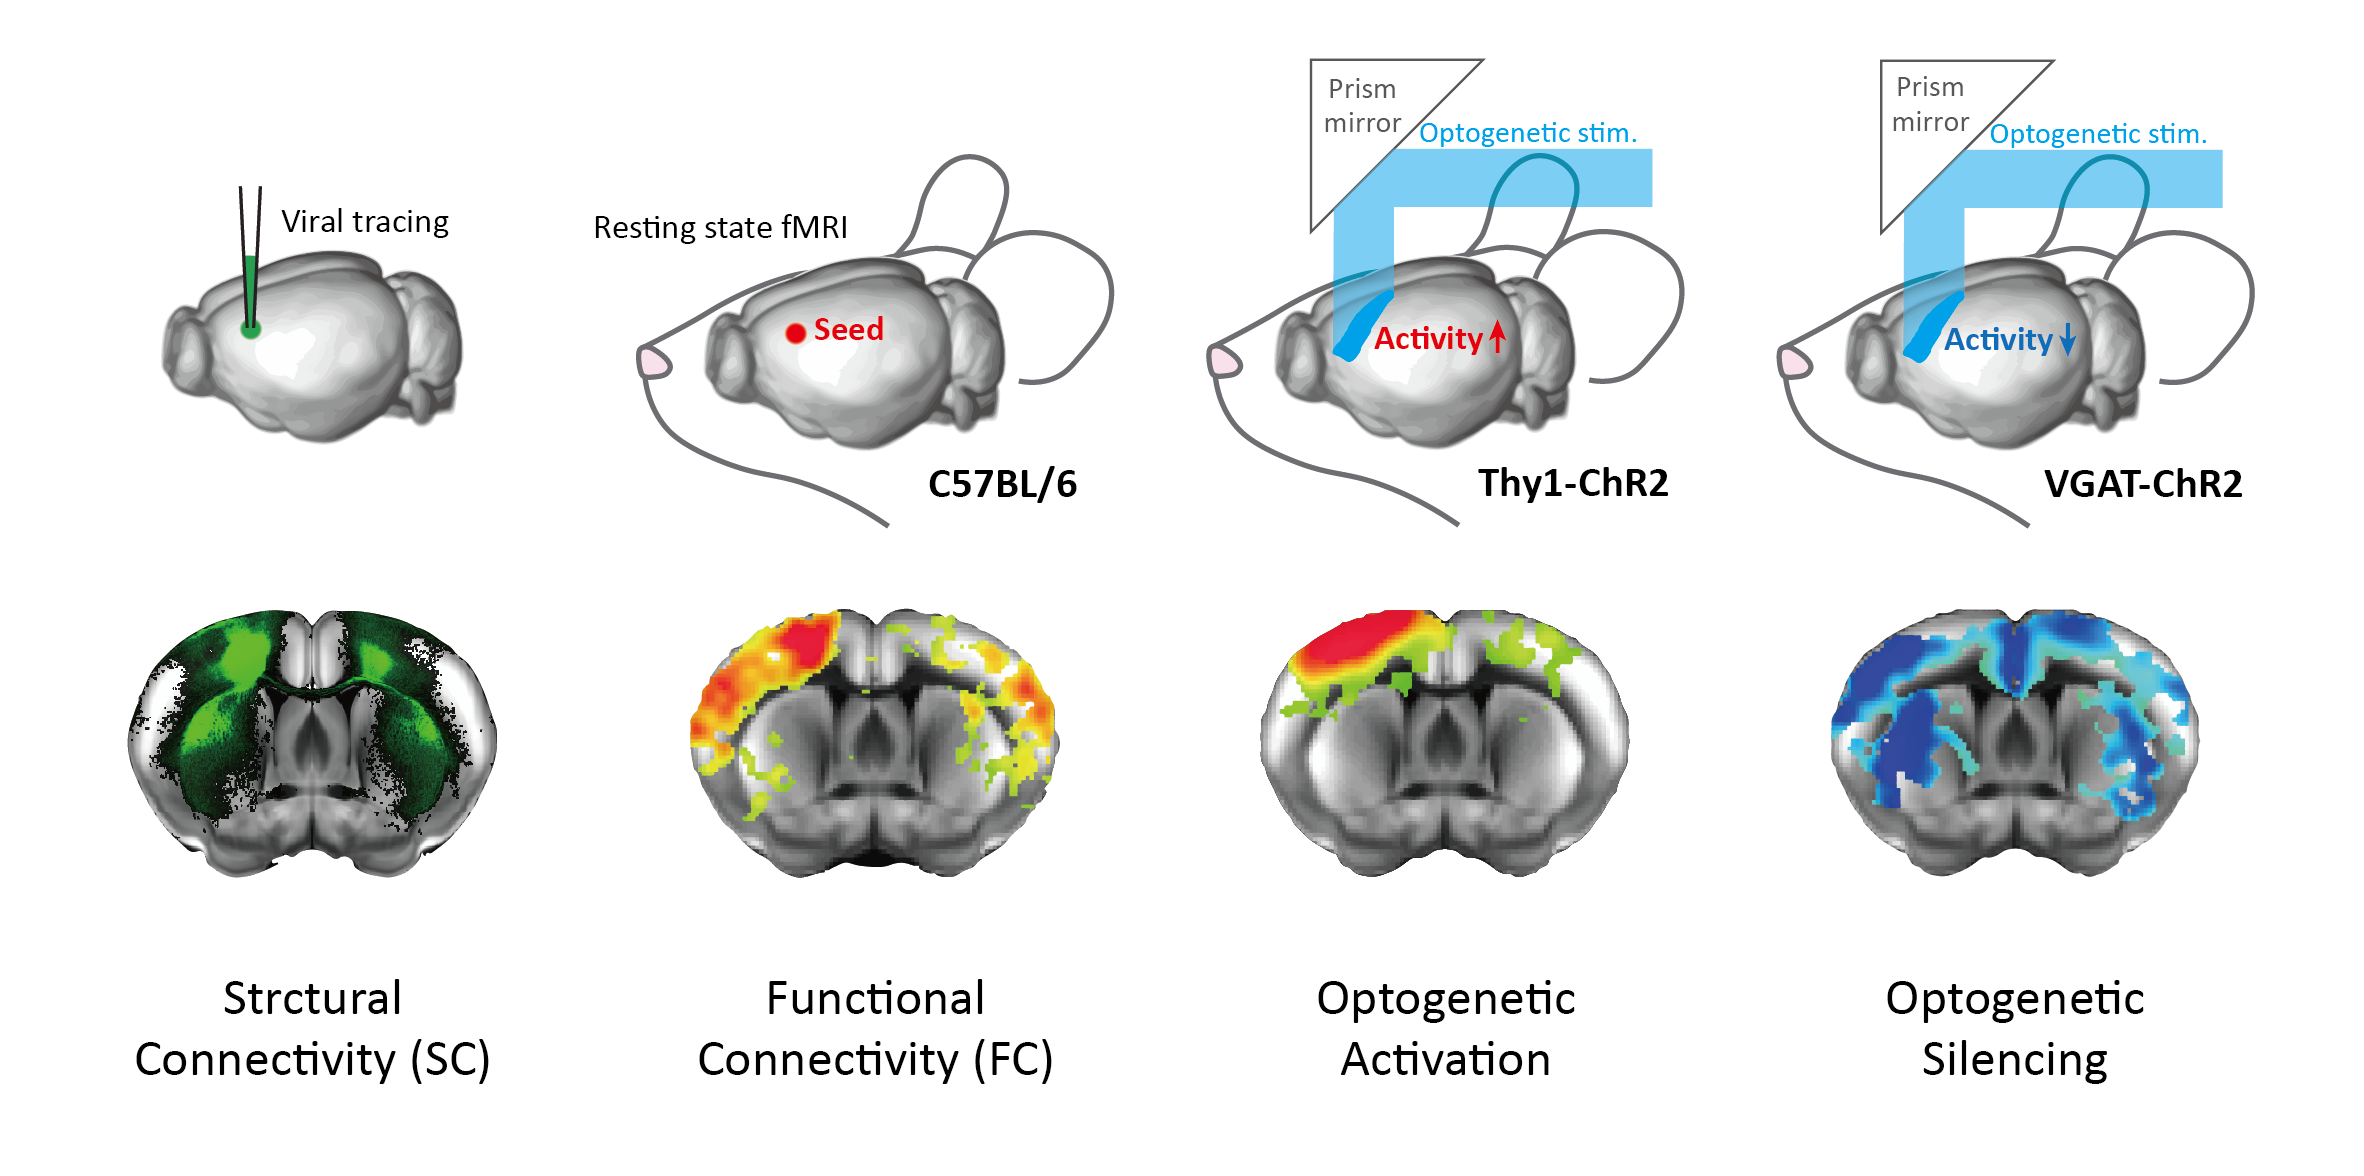
Resting-state (RS) fMRI is a potent tool for mapping brain-wide functional connectivity (FC), gaining substantial interest in neuroscience and clinical fields. Nevertheless, the RS FC mechanism is not fully understood. Although FC is often thought to represent neural interactions among brain regions, recent studies have suggested that FC may arise from various sources, which obscures the interpretation1. Particularly, RS FC only partially corresponds to monosynaptic structural connectivity (SC) while characterized by strong interhemispheric connections, attributing to polysynaptic or indirect connectivity2,3. However, a causal link between spontaneous neural interactions and FC has yet to be established. Optogenetic fMRI may offer a potential solution to this question by mapping changes in neural activity induced by precise spatiotemporal manipulation of neural activity (effective connectivity; EC). Interestingly, optogenetic activation of local excitatory neurons leads to predominantly ipsilateral connections, resembling SC4,5. We hypothesized that this discrepancy arises because the upregulation of neural activity does not account for spontaneously occurring connectivity. To address this, we employed optogenetic silencing to assess the extent of ongoing interactions during RS. In this study, we investigated (de)activation patterns resulting from excitatory and inhibitory neuron-specific optogenetic EC and their relationship with SC and FC (Figure 1).Methods
For optogenetic fMRI, VGAT-ChR2-EYFP mice (n=12; JAX #014548) and Thy1-ChR2-EYFP (n=8; JAX #007615) were used for specific modulation of inhibitory/excitatory neurons. These mice were prepared with a thinned-skull cranial window covering the entire dorsal cortex for cortex-wide patterned optogenetic stimulation5. For cerebral blood volume (CBV)-weighted fMRI, monocrystalline iron oxide nanoparticles (MION; 25 mg/kg) were intravenously injected. Optogenetic fMRI data were acquired at 9.4T (Bruker Biospec) using 2D EPI with the following parameters: FOV = 16(L-R) × 8(V-D) mm2; 18 contiguous 0.5-mm thick coronal slices; in-plane resolution = 0.167 × 0.167 mm2; TR/TE = 1000/8.35 ms; FA = 47°; scan time = 120 s. For resting state BOLD fMRI, eight C57BL/6N were scanned at 15.2T (Bruker Biospec) with 2D EPI with the following parameters: FOV = 15.8(L-R) × 7.65(V-D) mm2; 20 contiguous 0.5-mm thick coronal slices; in-plane resolution = 0.132 × 0.132 mm2; TR/TE = 1000/11.5 ms; flip angle (FA) = 50°; scan time = 600 s. Mice were anesthetized under a continuous infusion of dexmedetomidine (0.05 mg/kg/h) with 0.3% isoflurane during experiments. All fMRI data were preprocessed and normalized to the Allen mouse brain atlas6. Whole-brain SC dataset was obtained from a previous study7, which contains a full connectivity matrix among 15,314 parcels each of which consists of 27 voxels. To match the SC resolution, our RS fMRI dataset was resampled to this parcellation, and an FC matrix was generated by pairwise correlation between parcels. For ROI-level analysis, SC and FC were further computed in 86 atlas-based bilateral cortical ROIs.Results
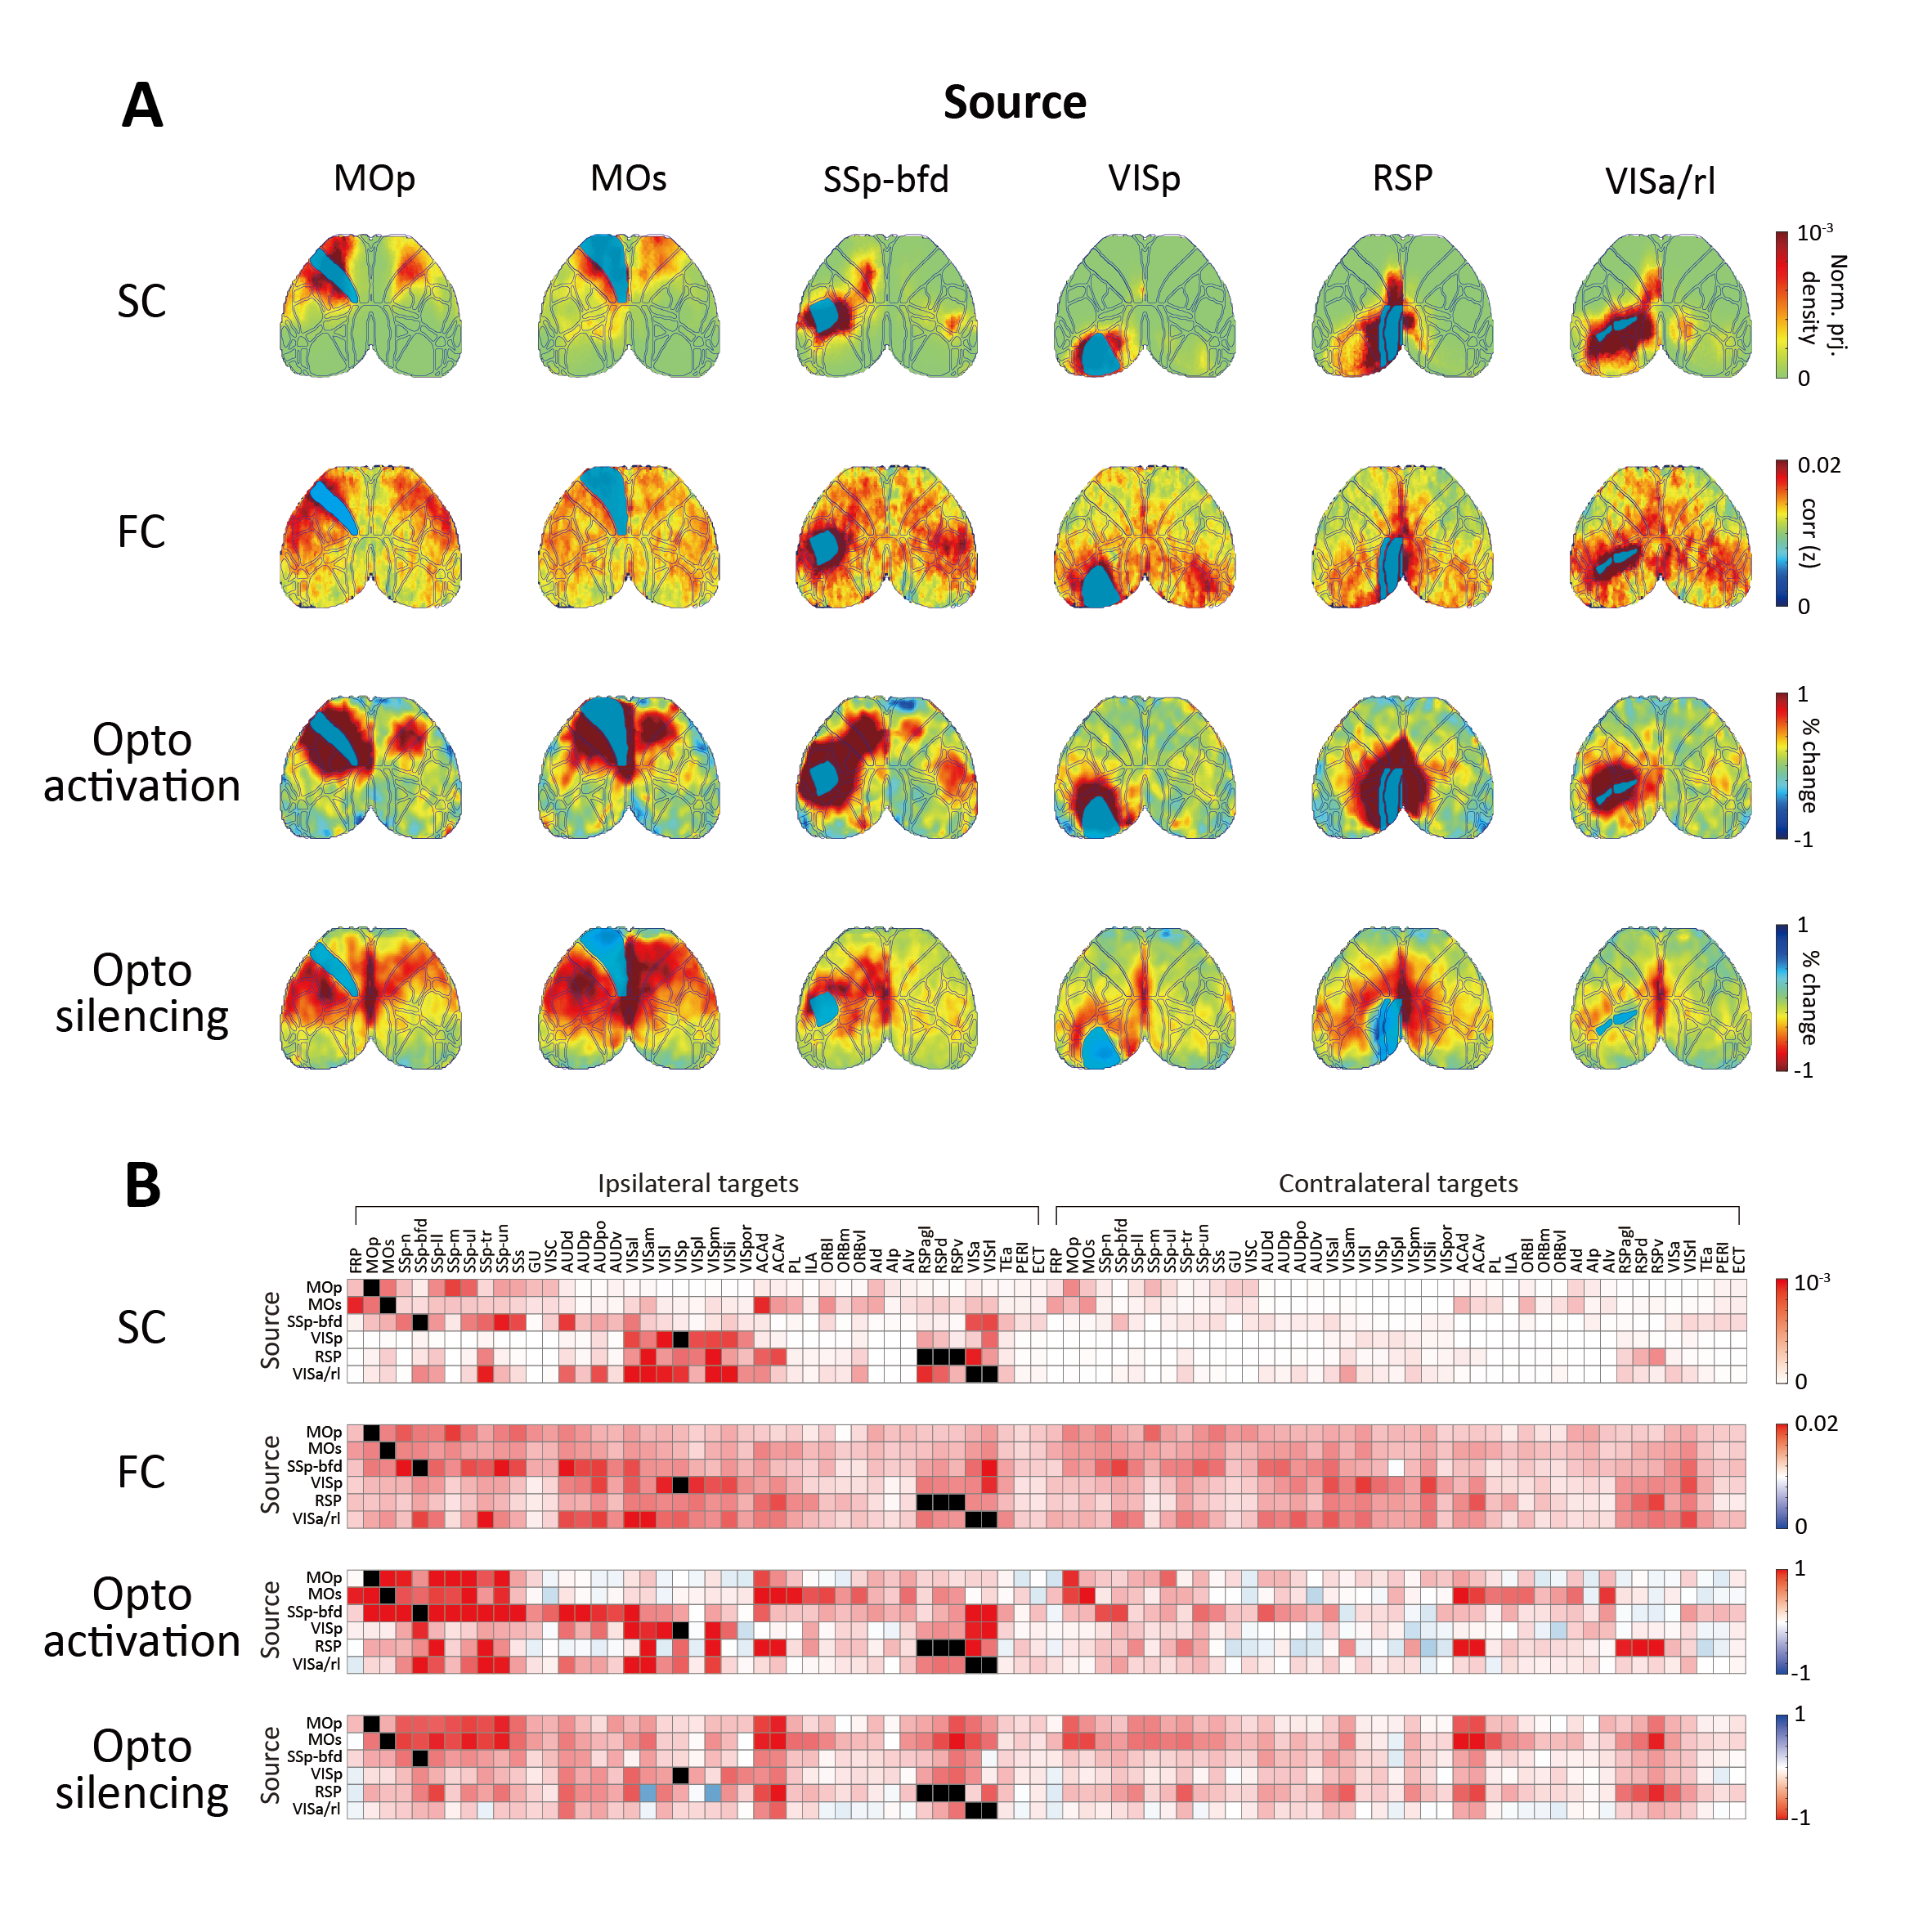
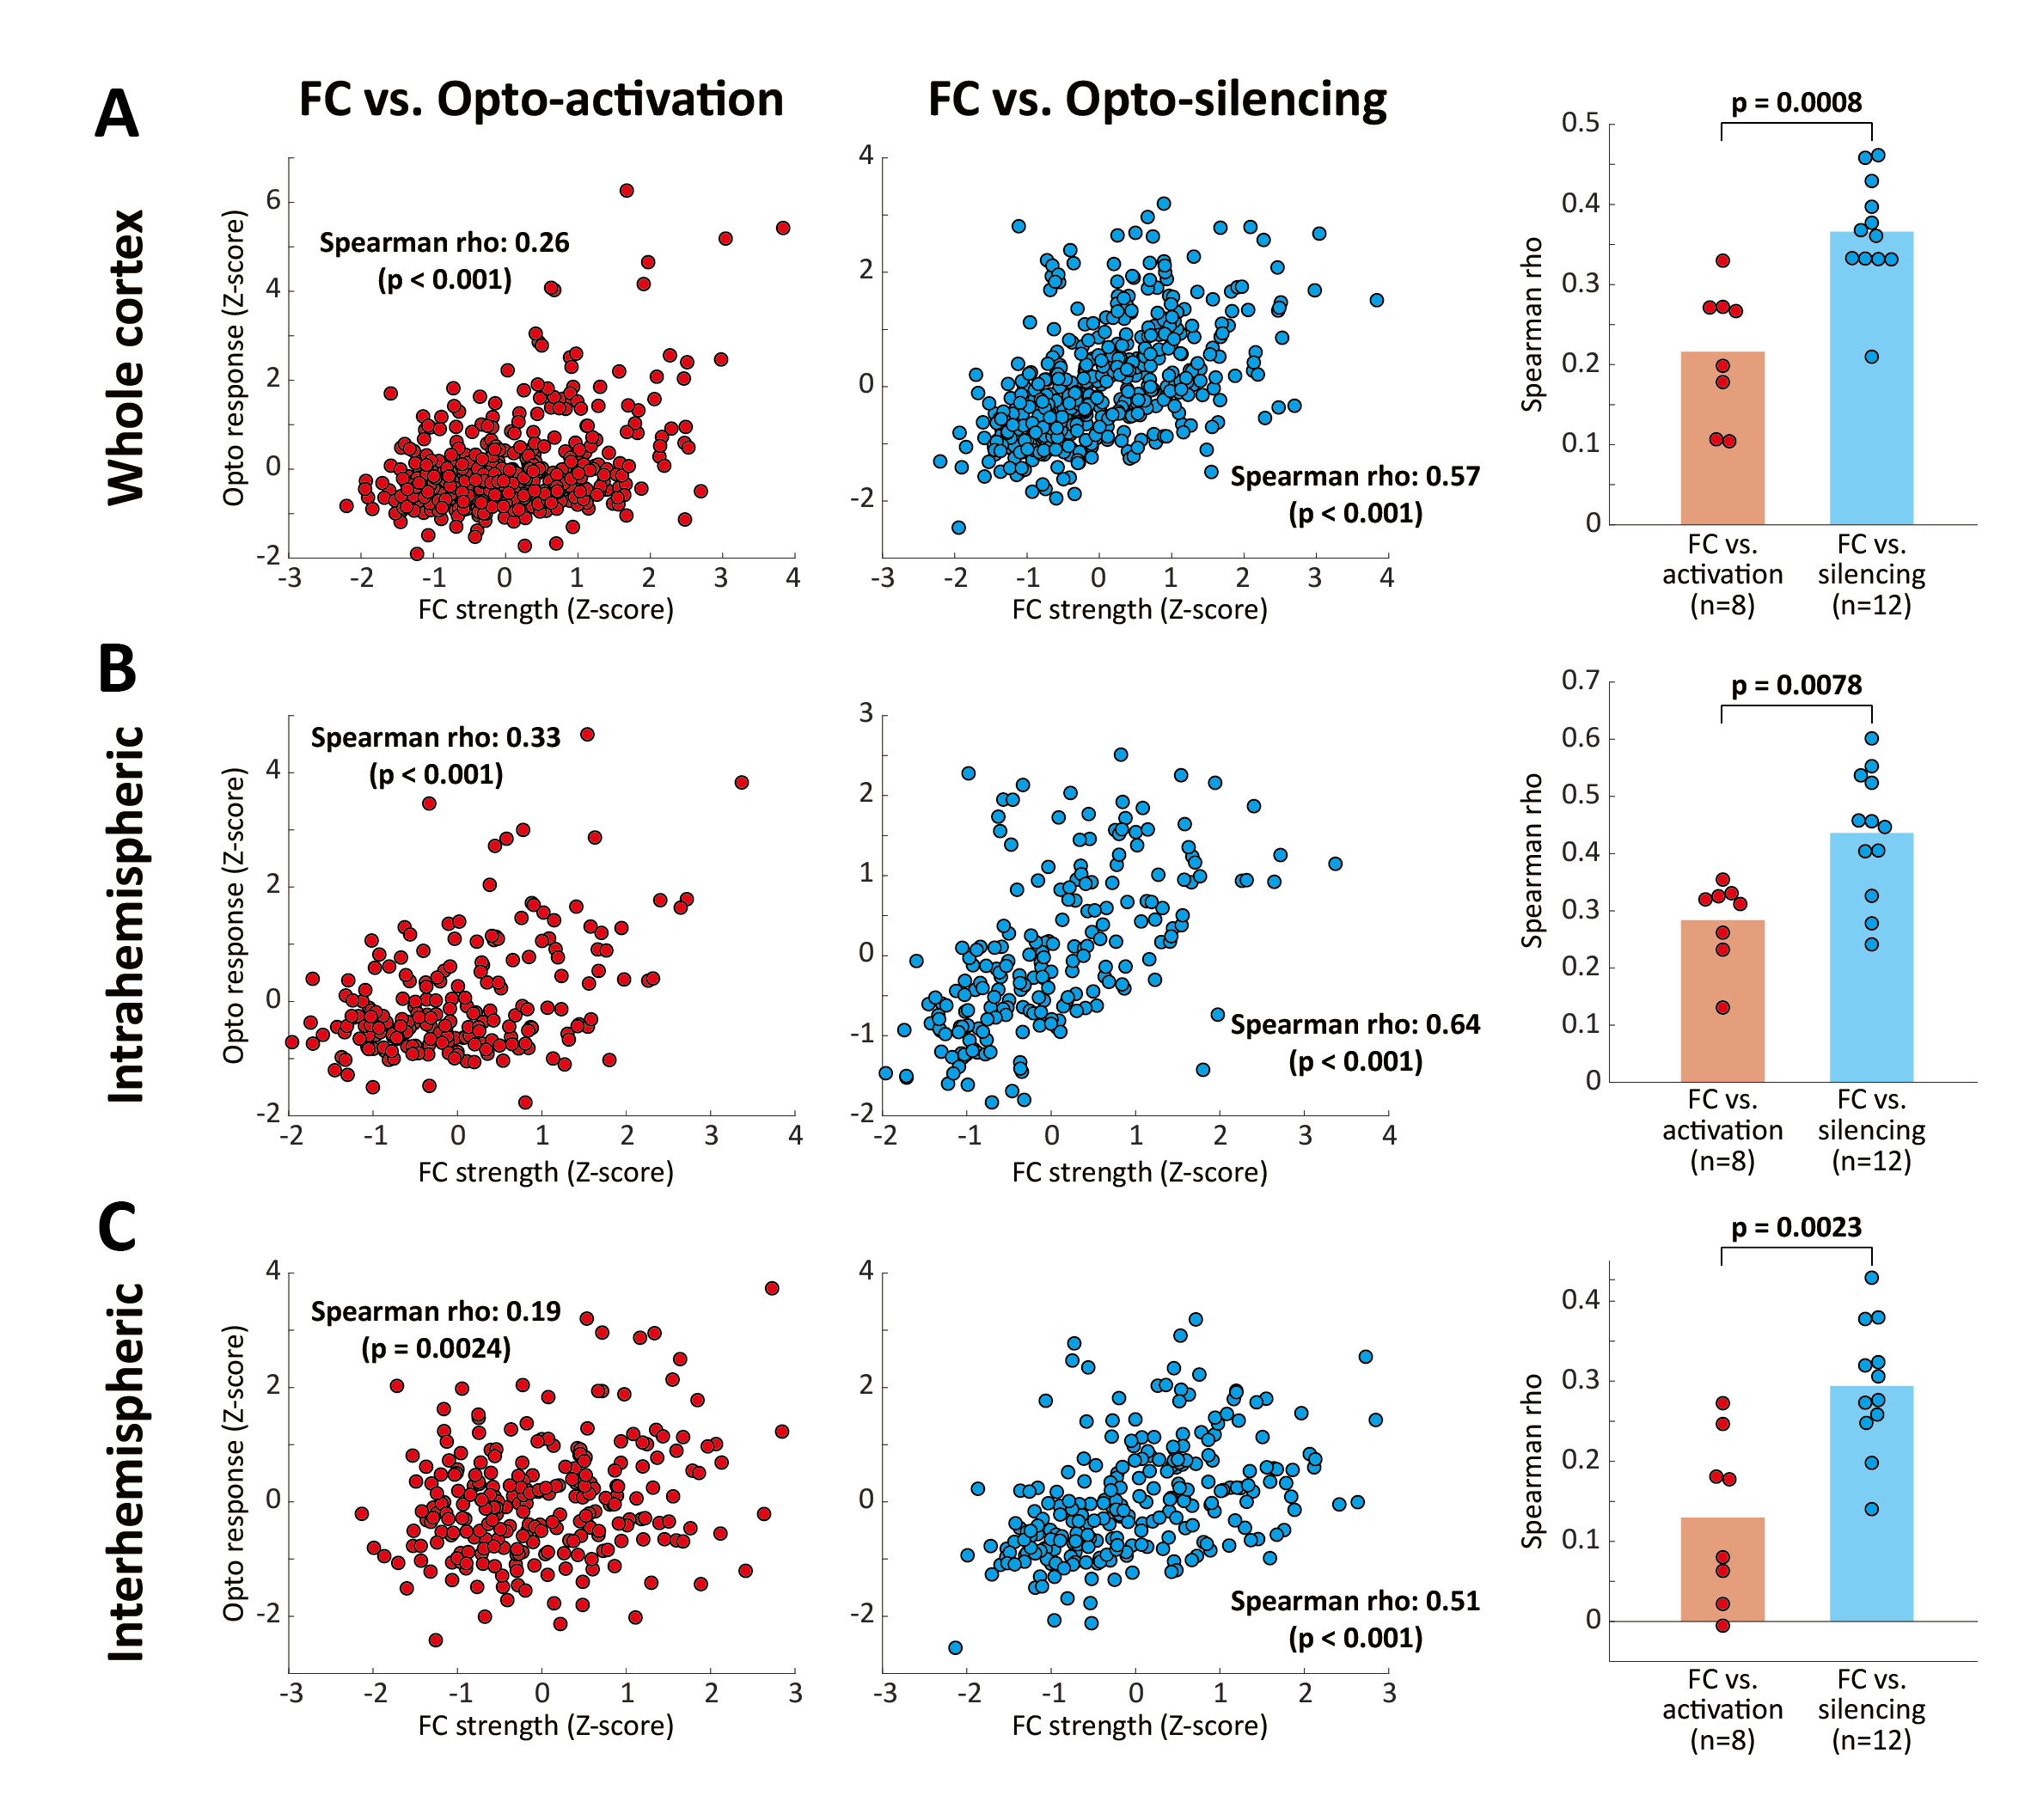
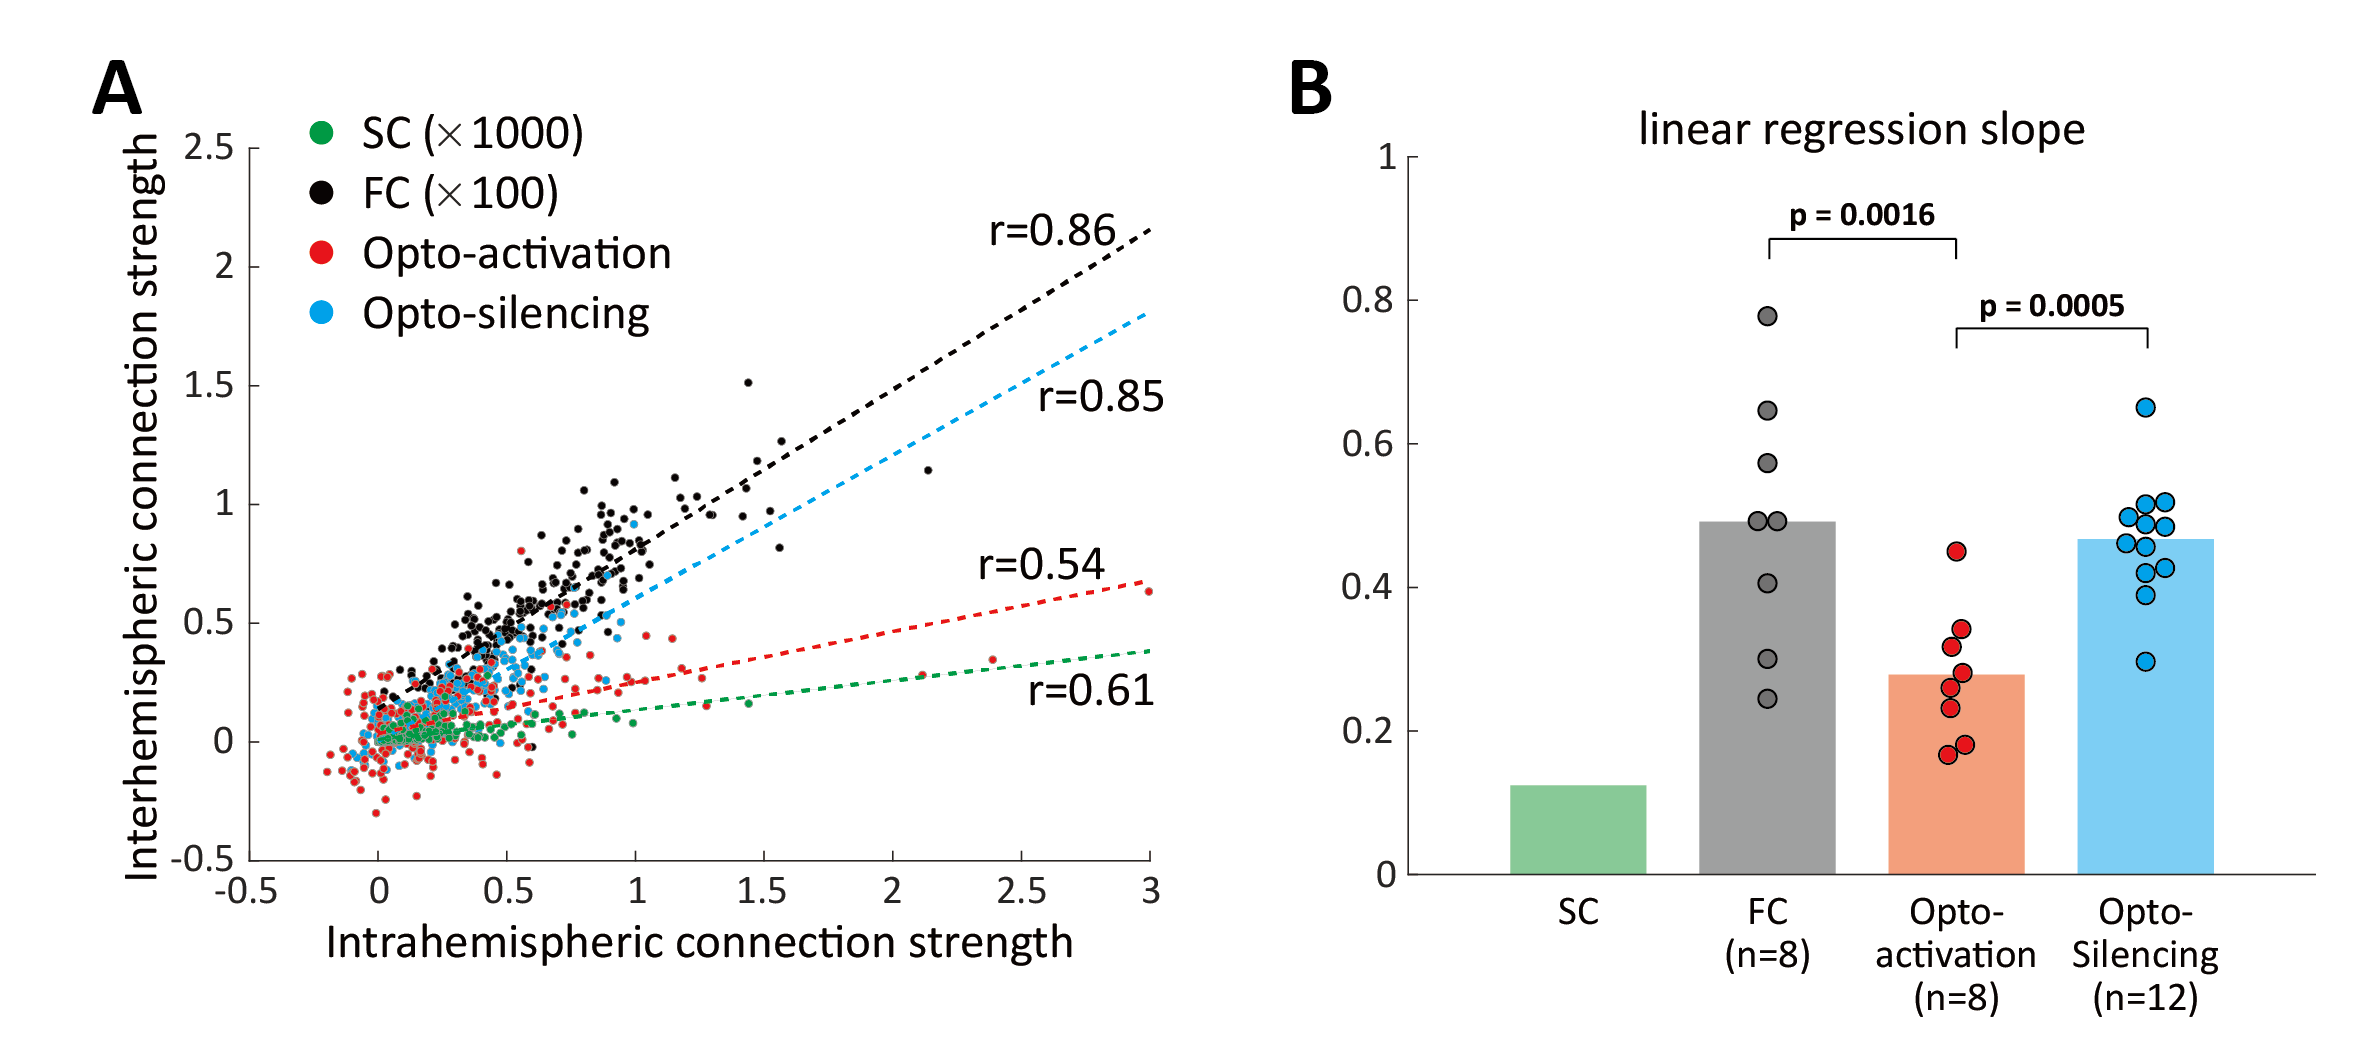
Six cortical regions were selected for optogenetic fMRI (primary/secondary motor area, MOp/MOs; primary somatosensory area barrel field, SSp-bfd; primary visual area, VISp; retrosplenial area, RSP; anterior and rostrolateral visual area, VISa/rl (or posterior parietal cortex, PTLp). Overall, FC exhibited more extensive connectivity patterns than SC (Figure 2A). Notably, optogenetic activation induced localized responses in structurally connected areas, while optogenetic silencing led to more widespread responses in the cortex. Connectivity strengths were quantified in 86 bilateral cortical ROIs for further analysis (Figure 2B). We found that optogenetic silencing-induced responses showed a stronger association with FC strengths, compared to optogenetic activation (Figure 3A). Since interhemispheric connectivity with weak or no monosynaptic SC is a hallmark of FC, we examined intra- and inter-hemispheric connections separately (Figure 3B, C). Optogenetic silencing exhibited connections to contralateral regions, demonstrating that interhemispheric FC results from neural interactions via indirect structural pathways. In line with this finding, we found a strong linear relationship between the strength of intrahemispheric connections and their contralateral counterparts (Figure 4), where the slope of linear regression was highest (~0.5) for FC and optogenetic silencing, followed by optogenetic activation (~0.3), and lowest for SC (~0.1).Discussion & Conclusion
In this study, we employed multi-site optogenetic fMRI to investigate the neural underpinning of FC. Our study has several important implications. First, optogenetic silencing of cortical regions induced extensive connectivity patterns that significantly differed from optogenetic activation. Notably, the connectivity patterns by optogenetic silencing were highly correlated with FC, implying that FC depends more on spontaneous activity than evoked activity, as initially hypothesized. Second, our study proposes the causal relationship between neural interactions and FC. We revealed that cortical regions have resting-state interactions not only with contralateral homotopic regions but also with heterotopic regions, possibly via polysynaptic structural pathways. This result highlights that interhemispheric FC originates, at least partially, from neural interaction during RS.Acknowledgements
This research was supported by the Institute of Basic Science (IBS-R015-D1).References
1. Drew, P. J., Mateo, C., Turner, K. L., Yu, X. & Kleinfeld, D. Ultra-slow oscillations in fMRI and resting-state connectivity: neuronal and vascular contributions and technical confounds. Neuron 107, 782-804 (2020).
2. Honey, C. J. et al. Predicting human resting-state functional connectivity from structural connectivity. Proceedings of the National Academy of Sciences 106, 2035-2040 (2009).
3. Grandjean, J., Zerbi, V., Balsters, J. H., Wenderoth, N. & Rudin, M. Structural basis of large-scale functional connectivity in the mouse. Journal of Neuroscience 37, 8092-8101 (2017).
4. Bauer, A. Q. et al. Effective Connectivity Measured Using Optogenetically Evoked Hemodynamic Signals Exhibits Topography Distinct from Resting State Functional Connectivity in the Mouse. Cerebral Cortex 28, 370-386 (2018).
5. Kim, S. et al. Whole-brain mapping of effective connectivity by fMRI with cortex-wide patterned optogenetics. Neuron 111, 1732-1747. e6 (2023).
6. Wang, Q. et al. The Allen mouse brain common coordinate framework: a 3D reference atlas. Cell 181, 936-953. e20 (2020).
7. Coletta, L. et al. Network structure of the mouse brain connectome with voxel resolution. Science Advances 6, eabb7187 (2020).
Figures