4969
Effects of MRI acoustic noise on resting state functional connectivity1National Institute of Advanced Industrial Science and Technology, Tsukuba, Japan, 2Okinawa Institute of Science and Technology Graduate University, Onna, Japan
Synopsis
Keywords: Functional Connectivity, Brain Connectivity, MRI acoustic noise
Motivation: Loud acoustic noise during resting state fMRI can affect functional connectivity (FC), but the precise effect of MRI acoustic noise on FC is not well understood.
Goal(s): To clarify the impact of MRI acoustic noise on FC.
Approach: FC in mice under MRI acoustic noise was investigated using functional ultrasound (fUS), a functional imaging method based on relative cerebral blood volume, and the FC obtained was compared with FC by fMRI.
Results: As acoustic noise increased, in the auditory network FC between the retrosplenial dysgranular and auditory cortexes decreased, while in the non-auditory network FC anticorrelation between the infralimbic and motor cortexes increased.
Impact: Anticorrelation between the default mode network (e.g., infralimbic cortex) and task-positive networks (e.g., motor cortex) is an important feature of brain network antagonism. Attention should be paid to the acoustic noise level when fMRI to evaluate anticorrelation of such networks.
Introduction
Loud acoustic noise from the scanner during fMRI can affect functional connectivity (FC) observed in the resting state [1], but the precise effect of the MRI acoustic noise on resting state FC is not well understood. Functional ultrasound (fUS) [2] is a neuroimaging method that visualizes brain activity based on relative cerebral blood volume (rCBV), a similar neurovascular coupling response to that measured by fMRI, but without the audible acoustic noise. In this study, the effects of MRI acoustic noise on resting state FC were investigated in awake mice using fUS by comparing it with fMRI. The target brain regions were part of the default mode network (DMN), sensorimotor network, and auditory network, which are present in both mice and humans.Methods
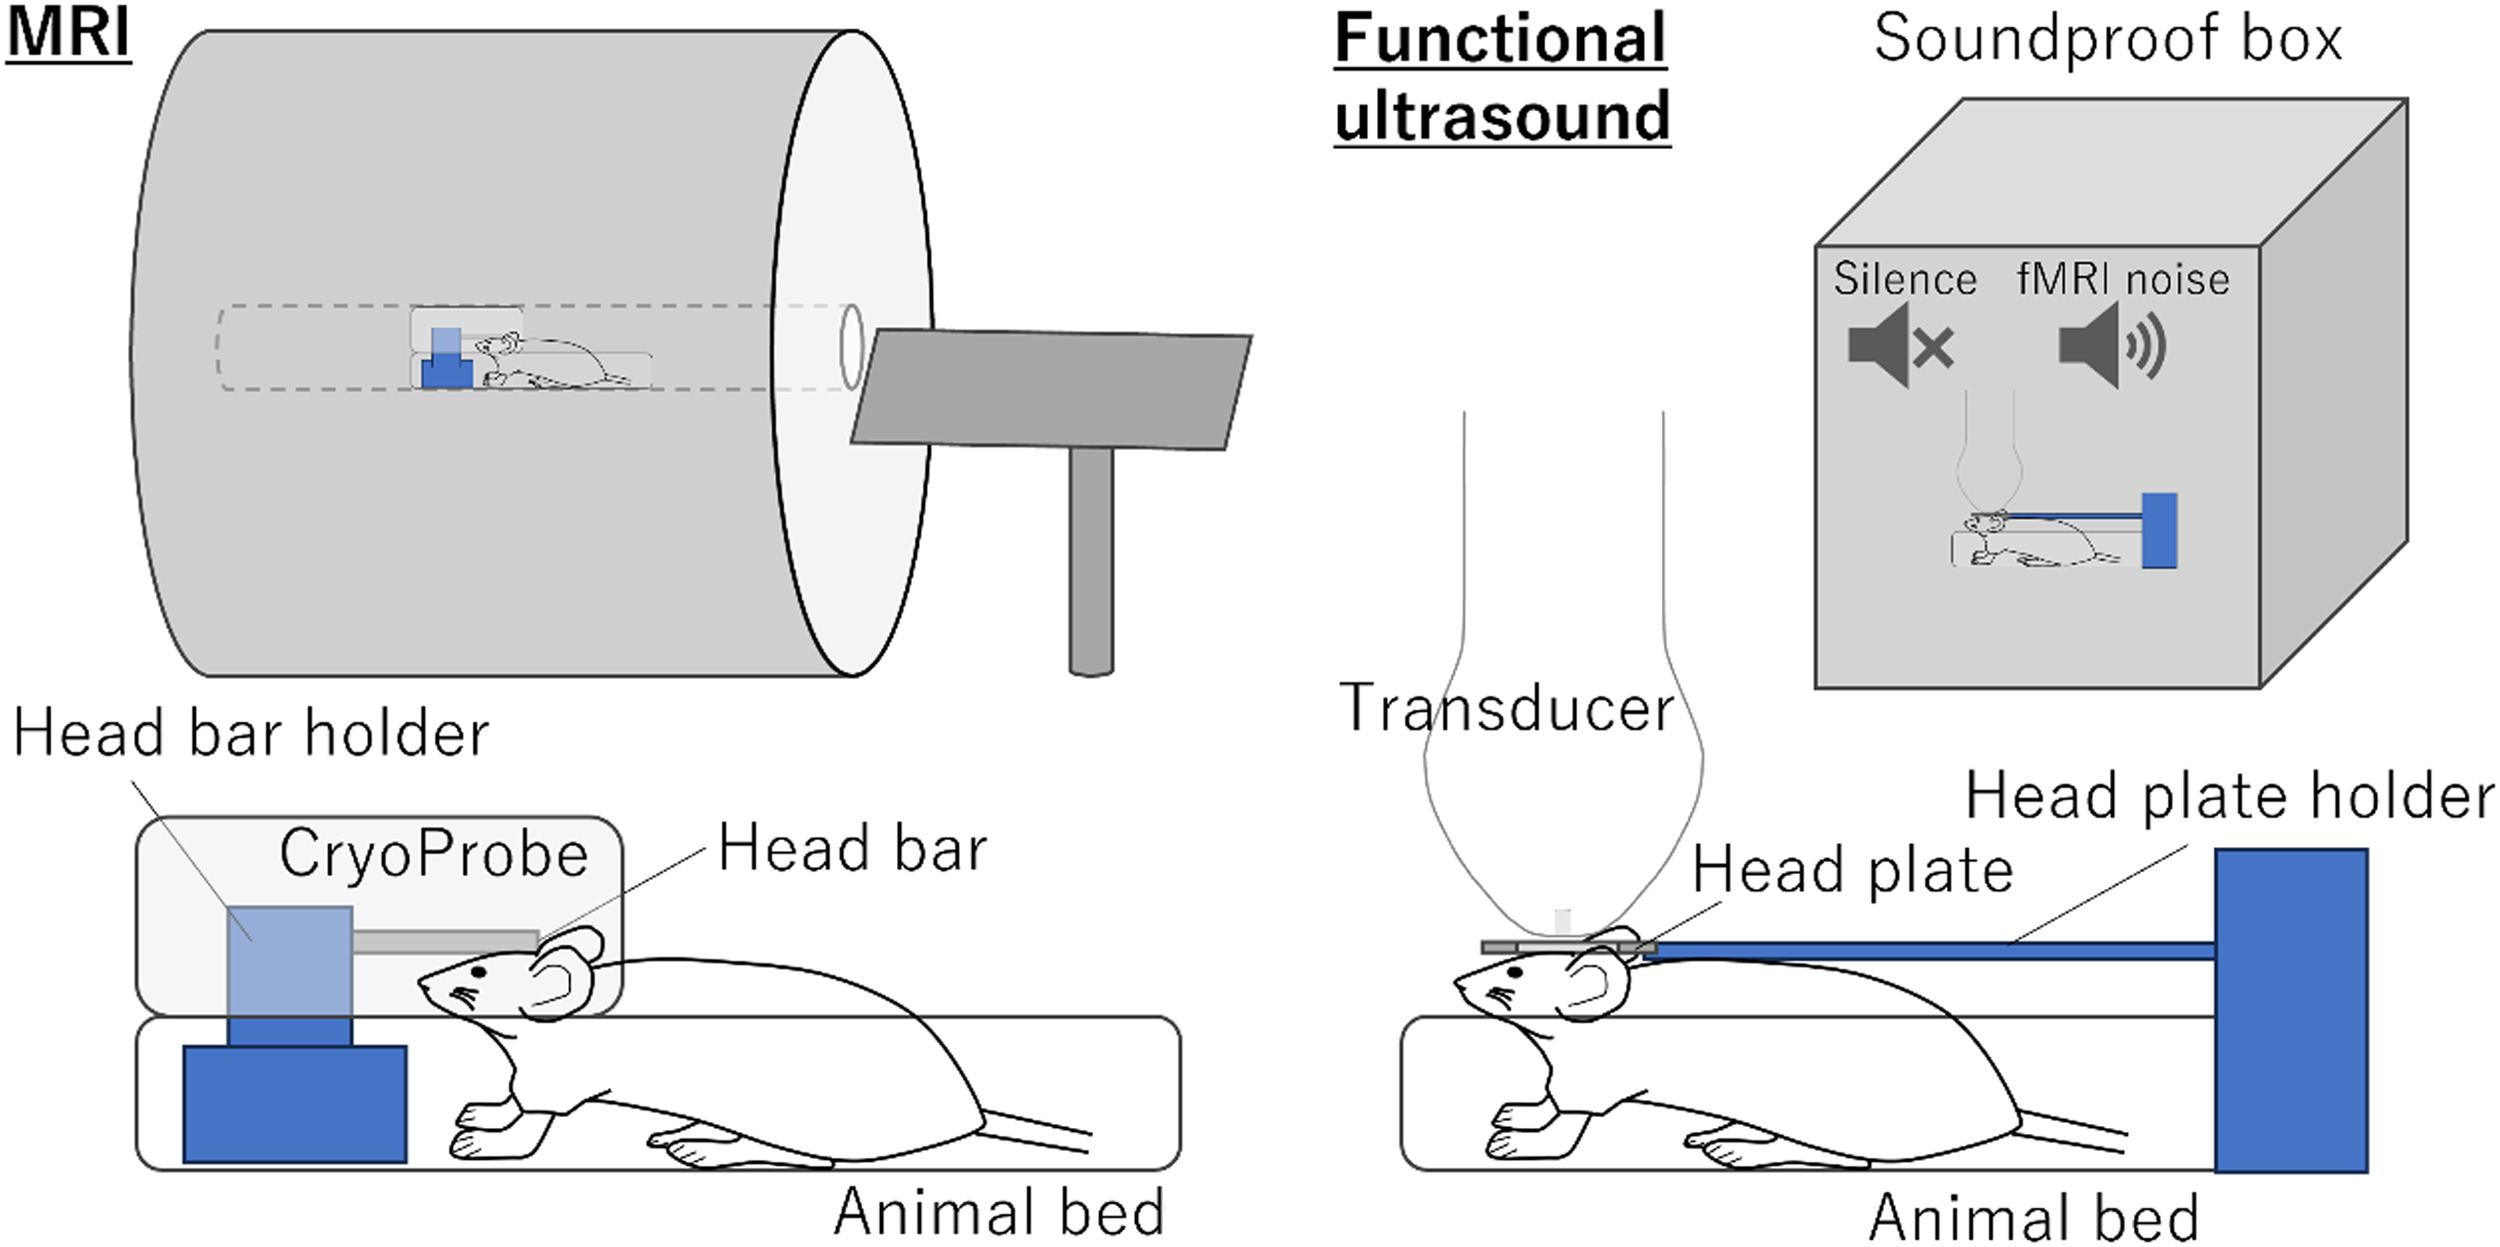
Twenty male mice were used for the study. The Ethics Committee (approval number: 2018–214, 2020–0359) approved all procedures. For rsfMRI, head bar implantation, and for rsfUS, head plate implantation and craniotomy were performed, respectively. After recovery from the surgery, handling, and habituation to the head bar and plate holders and habituation training to MRI acoustic noise were performed for awake measurement. rsfMRI data was acquired using gradient-echo-planar imaging (repetition time = 1500 ms, flip angles = 50 deg, echo time = 15 ms, 300 scans) with an 11.7-Tesla MRI scanner (BioSpec117/11) and a cryogenically-cooled RF coil, while rsfUS data was acquired using a high-frequency linear array transducer with center frequency of 18MHz and a programable ultrasound system. During rsfUS, mice were exposed to three acoustic noise conditions (silence, 80dB, 110dB SPL) in a soundproof box (Fig.1). Low-frequency fluctuations of BOLD by rsfMRI and rCBV by rsfUS were extracted, and FC was calculated using the Pearson correlation coefficient. In MRI acoustic noise stimulation experiments using fUS, group-averaged correlation maps were generated, and temporal profiles of rCBV changes were extracted. Differences in the FC matrices between the three acoustic conditions and differences in the FC matrices between rsfUS and rsfMRI were quantified using Cohen's d effect size estimates. Changes in FC between the three acoustic conditions were evaluated using t-tests with Bonferroni correction of significance thresholds for multiple comparisons.Results
Altered resting state FC under MRI acoustic noiseRsfUS experiments revealed a significant reduction in FC between the retrosplenial dysgranular and auditory cortexes (0.56 ± 0.07 at silence vs 0.05 ± 0.05 at 110 dB, p=.01, Fig.2) and a significant increase in FC anticorrelation between the infralimbic and motor cortexes (−0.21 ± 0.08 at silence vs −0.47 ± 0.04 at 110 dB, p=.017, Fig. 3) as acoustic noise increased from silence to 80 dB and 110 dB. We also found that the greater the acoustic noise condition in rsfUS, increased the consistency of the FC pattern between rsfUS and rsfMRI (Fig. 2 & 3).
Hemodynamic response to stimuli with MRI acoustic noise
MRI acoustic noise stimulation experiments using fUS showed strong positive rCBV changes (16.5% ± 2.9% at 110 dB, Fig. 4) in the auditory cortex, and negative rCBV changes (−6.7% ± 0.8% at 110 dB, Fig. 4) in the motor cortex, both being constituents of the brain network that was altered by the presence of acoustic noise in the resting state experiments.
Discussion
Even when loud acoustic noise is continuously present during scanning, as in fMRI, it is thought that the acoustic noise elevates the BOLD baseline in the auditory cortex [4]. Although the reduction of resting state FC in the auditory network is thought to be due to the direct influence of acoustic noise on auditory functions, the reasons for the reduction in FC in non-auditory networks are not well understood. In our study, the sound stimulation experiments revealed that MRI acoustic noise directly affects not only the auditory cortex but also the motor cortex. An electrophysiological experiment reported that activity in the primary motor cortex was suppressed by loud sounds [5]. We thus hypothesize that MRI acoustic noise exogenously affects the weak endogenous DMN-sensorimotor network anticorrelation, changing it to moderate anticorrelation.Conclusion
The fUS measurements conducted under MRI acoustic noise clearly showed that the resting state FC of the auditory network was suppressed and that the anticorrelation between the DMN and the motor network was strengthened. Anticorrelation between constituent brain regions of the DMN and those of task-positive sensorimotor networks is known to be an important feature of brain network antagonism, and has been studied as a biological marker of brain disfunction and disease. These findings suggest that attention should be paid to acoustic noise levels when assessing those networks using rsfMRI.Acknowledgements
A part of this work was carried out by AMED under Grant Numbers (JP20he0422004j0001 and JP22ym0126803j0001), by a Grant-in-Aid for Scientific Research (21K19749), by a Grant for Basic Science Research Projects from The Sumitomo Foundation (200372).References
[1] Andoh et al., Neuroimage. 2017.
[2] Mace et al., Nat Methods. 2011.
[3] Sforazzini et al., Neuroimage. 2014.
[4] Hall et al., Hum. Brain Mapp. 1999.
[5] Furubayashi et al., Clin. Neurophysiol. 2000.
Figures
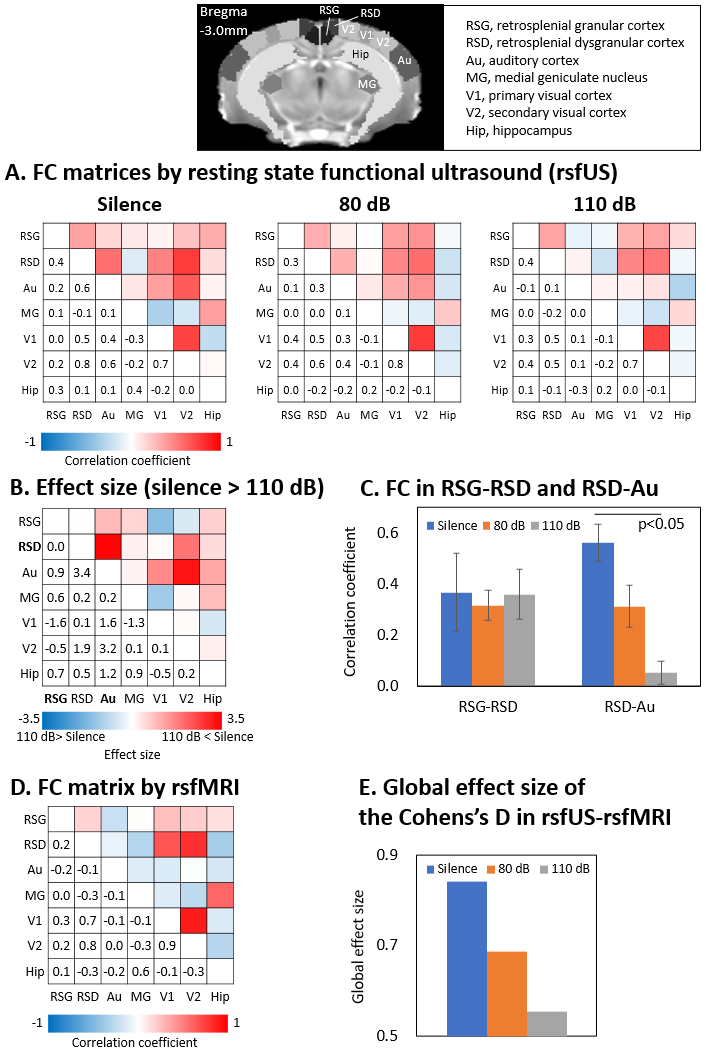
FC changes measured by resting state functional ultrasound (rsfUS) in a slice including the auditory cortex under MRI acoustic noise and FC by rsfMRI in the same slice
A FC matrices measured by rsfUS under the three acoustic noise conditions. B Cohen’s d matrix showing the effect size used to indicate the standardized difference between the FC matrices of silence and 110 dB.
C FC under the three acoustic noise conditions of silence, 80 dB, and 110 dB for RSD-Au and RSG-RSD.
D FC matrix measured by rsfMRI.
E Global effect size within the Cohens’s D between rsfMRI and rsfUS.
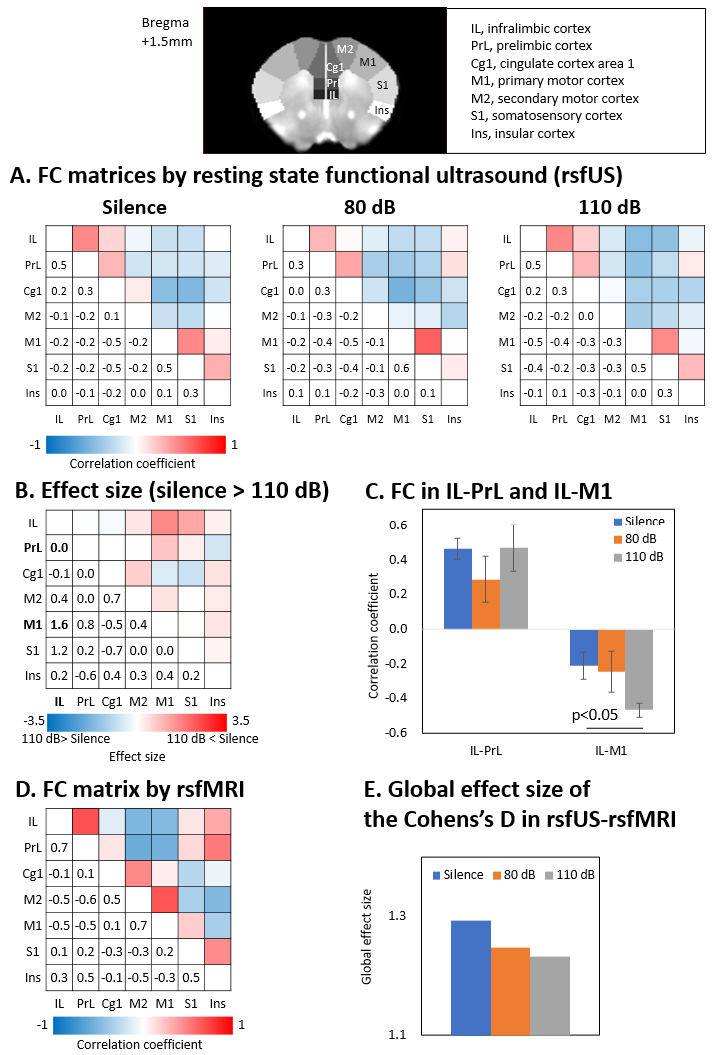
FC changes measured by resting state functional ultrasound (rsfUS) in a slice including the primary motor cortex under MRI acoustic noise and FC by rsfMRI in the same slice
A FC matrices measured by rsfUS under the three acoustic noise conditions. B Cohen’s d matrix showing the effect size used to indicate the standardized difference between the FC matrices of silence and 110 dB.
C FC under the three acoustic noise conditions of silence, 80 dB, and 110 dB for IL-PrL and IL-M1.
D FC matrix measured by rsfMRI.
E Global effect size within the Cohens’s D between rsfMRI and rsfUS.
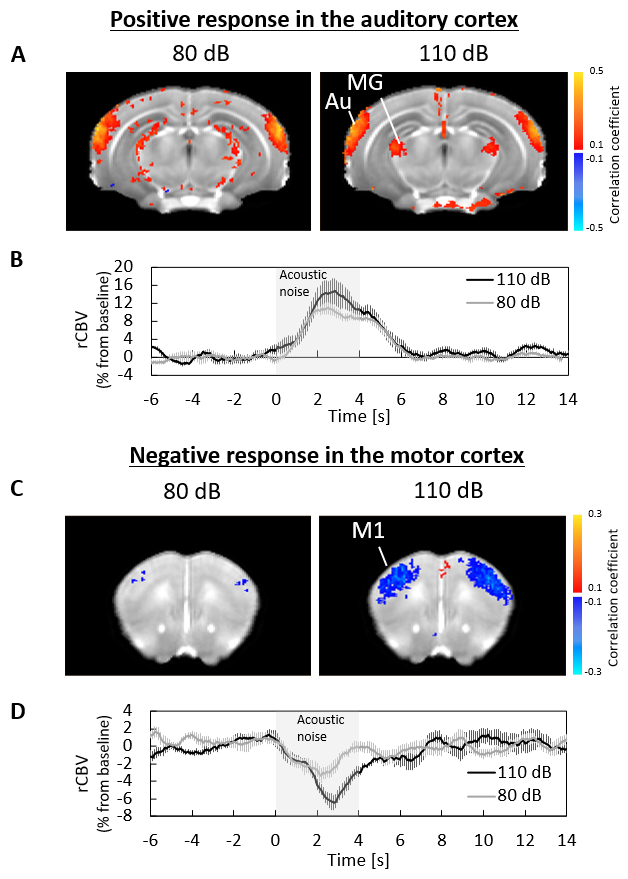
Functional US (fUS)-measured rCBV changes elicited by the MRI acoustic noise stimulation
A Correlation coefficient map showing correlations between rCBV changes and the square-wave pattern of the stimulation in a slice including the Au.
B Averaged rCBV change in the Au ROI.
C Correlation coefficient map showing correlations between rCBV changes and the square-wave pattern of the stimulation in a slice including the M1.
D Averaged rCBV change in the M1 ROI.
Abbreviations: Au, auditory cortex; MG, medial geniculate nucleus, M1, primary motor cortex.