4965
White matter-engaged multilayer network for evaluation of functional deficits in Alzheimer’s disease1Vanderbilt University Institute of Imaging Science, Nashville, TN, United States, 2Department of Electrical and Computer Engineering, Vanderbilt University, Nashville, TN, United States, 3Department of Radiology and Radiological Sciences, Vanderbilt University Medical Center, Nashville, TN, United States, 4Department of Biomedical Engineering, Vanderbilt University, Nashville, TN, United States
Synopsis
Keywords: Functional Connectivity, Alzheimer's Disease
Motivation: The role of white matter (WM) in the functional connectivity within brain networks has not been well studied.
Goal(s): Our goal was to use a high-order graph model to comprehensively analyze brain functional networks that engage WM.
Approach: We constructed multilayer networks and analyzed network parameters in the brains of subjects with Alzheimer’s disease (AD).
Results: Multilayer network analysis showed increased sensitivity for detecting significant deterioration in functional connectivity (FC) in AD.
Impact: Multilayer networks allow more comprehensive understanding of structure-function relations within the whole brain and may provide deeper insight into the pathophysiology of degenerative brain disease.
Introduction
Network theory is a valuable tool widely used in various fields including neuroimaging. Traditional network analysis assumes all network nodes belong to the same category with single type of edges (i.e., a single-layer network). In the brain, gray matter (GM) voxels or regions are typically regarded as nodes, while the structural and functional connections between them are considered as edges. By combining these essential components, a graph structure is established, forming the basis for numerous studies corresponding to network analysis 1-3. However, the engagement of a crucial component in brain structure, namely white matter (WM), which connects GM nodes, has usually been neglected. While historically BOLD signals in WM have been overlooked in fMRI studies due to uncertainties regarding their significance and detectability 4, recently there has been converging and compelling evidence that WM BOLD signals encode neural activity information 5,6. In order to fully investigate the functional involvement of WM in brain networks, there is a need for new architectures capable of incorporating WM and providing natural and more accurate representations of complex networks. Multilayer networks have emerged as a remedy, which comprise network nodes connected by multilayers of edges of different types, reflecting real-world complexity. In this preliminary study, we demonstrate that a multilayer network model is superior to a traditional single-layer counterpart in detecting functional alterations in subjects with Alzheimer’s disease (AD).Methods
Data used in this study were aggregated from the Alzheimer’s Disease Neuroimaging Initiative (ADNI) database, stages 2 and 3 (ADNI-2&3, https://adni.loni.usc.edu). Three hundred and forty-two individuals were selected for analysis, which were grouped into cognitively normal (CN) subjects (n=288), and patients with AD (n=54). Table 1 shows the characteristics of subjects analyzed. Preprocessing of the data was implemented with an automatic pipeline we established earlier (see the previous report 7 for details). Preprocessed fMRI signals were then averaged across voxels within each GM region defined by Brodmann areas and each WM bundle defined by the JHU ICBM-DTI-81 WM atlas 8. In this study, we characterized the contribution of WM to GM functional connectivity by investigating high-order interactions within triplets consisting of each WM bundle and pairs of GM nodes. These high-order interactions were considered as intralayer connections between two nodes representing GM regions in a layer corresponding to each single WM bundle. For the calculation of these high-order interactions, initially, the averaged fMRI signals from these three nodes (comprising two GM regions and one WM bundle) were discretized and treated as random variables. Subsequently, interaction information was computed based on these three discretized signals.After constructing the multilayer network, we first assessed the consistency by examining the element-wise correlation between the overlay networks of multilayer networks (i.e., the summation of individual layers) and GM-GM correlation coefficients (CC). Additionally, we evaluated the element-wise correlation between GM-WM networks and the degree matrices defined by the overall connection intensity to a GM node in a WM layer. Next, we calculated differences in mean overlay networks and averaged GM-GM CC between CN subjects and AD patients. Finally, we calculated the differences in averaged degree matrix of the multilayer networks between CN subjects and AD patients.
Results
Figure 1 demonstrated high correlation coefficients (CC) between the overlay network of a multilayer network and elements of the GM-GM connectivity matrix for controls (top row; mean CC = 0.7034). Additionally, the correlation coefficients between the degree matrix of multilayer networks and elements of the GM-WM correlation matrix for CN subjects were also found to be high (bottom row, mean CC = 0.6385). Figure 2 revealed that the majority of GM-GM connections revealed significant decreases (p<0.05) for both the overlay networks and Pearson correlation coefficients, and it is noticeable that more regions showed functional connection decreases in AD patients for overlay networks of multilayer networks. In Figure 3, we observed significant decreases (p<0.05) in AD patients in most elements of averaged degree matrix, but no significant increases in these patients.Discussion
We have demonstrated the intrinsic consistency of multilayer networks with single-layer networks, and presented an improved sensitivity of multilayer networks in detecting functional connectivity deficits in AD over single-layer network structures. Next, by comparing fundamental network parameters of the multilayer networks between CN subjects and AD patients, we further provide supporting evidence for apparent deterioration in node connectivity strength. These results show the feasibility and value of employing multilayer networks which incorporate BOLD signals within the WM to investigate brain networks, particularly in brains with neurological disorders and diseases, which lays a foundation for future in-depth research in this area.Acknowledgements
This work was supported by NIH grant R01 NS129855 (Z.D.), RF1 MH123201 (J.C.G.), R01 NS113832 (J.C.G.), T32EB001628 (J.C.G), K01EB032898 (K.G.S).References
1 Watts, D. J. & Strogatz, S. H. Collective dynamics of ‘small-world’networks. nature 393, 440-442 (1998).
2 Bassett, D. S., Meyer-Lindenberg, A., Achard, S., Duke, T. & Bullmore, E. Adaptive reconfiguration of fractal small-world human brain functional networks. Proceedings of the National Academy of Sciences 103, 19518-19523 (2006).
3 Zhou, C., Zemanová, L., Zamora, G., Hilgetag, C. C. & Kurths, J. Hierarchical organization unveiled by functional connectivity in complex brain networks. Physical review letters 97, 238103 (2006). 4 Logothetis, N. K. & Wandell, B. A. Interpreting the BOLD Signal. Annual Review of Physiology 66, 735-769 (2004). https://doi.org/10.1146/annurev.physiol.66.082602.092845
5 Gore, J. C. et al. Functional MRI and resting state connectivity in white matter-a mini-review. Magnetic resonance imaging 63, 1-11 (2019).
6 Ding, Z. et al. Detection of synchronous brain activity in white matter tracts at rest and under functional loading. Proceedings of the National Academy of Sciences 115, 595-600 (2018).
7 Gao, Y. et al. in Medical Imaging 2023: Image Processing. 155-161 (SPIE).
8 Mori, S. et al. Stereotaxic white matter atlas based on diffusion tensor imaging in an ICBM template. Neuroimage 40, 570-582 (2008).
Figures

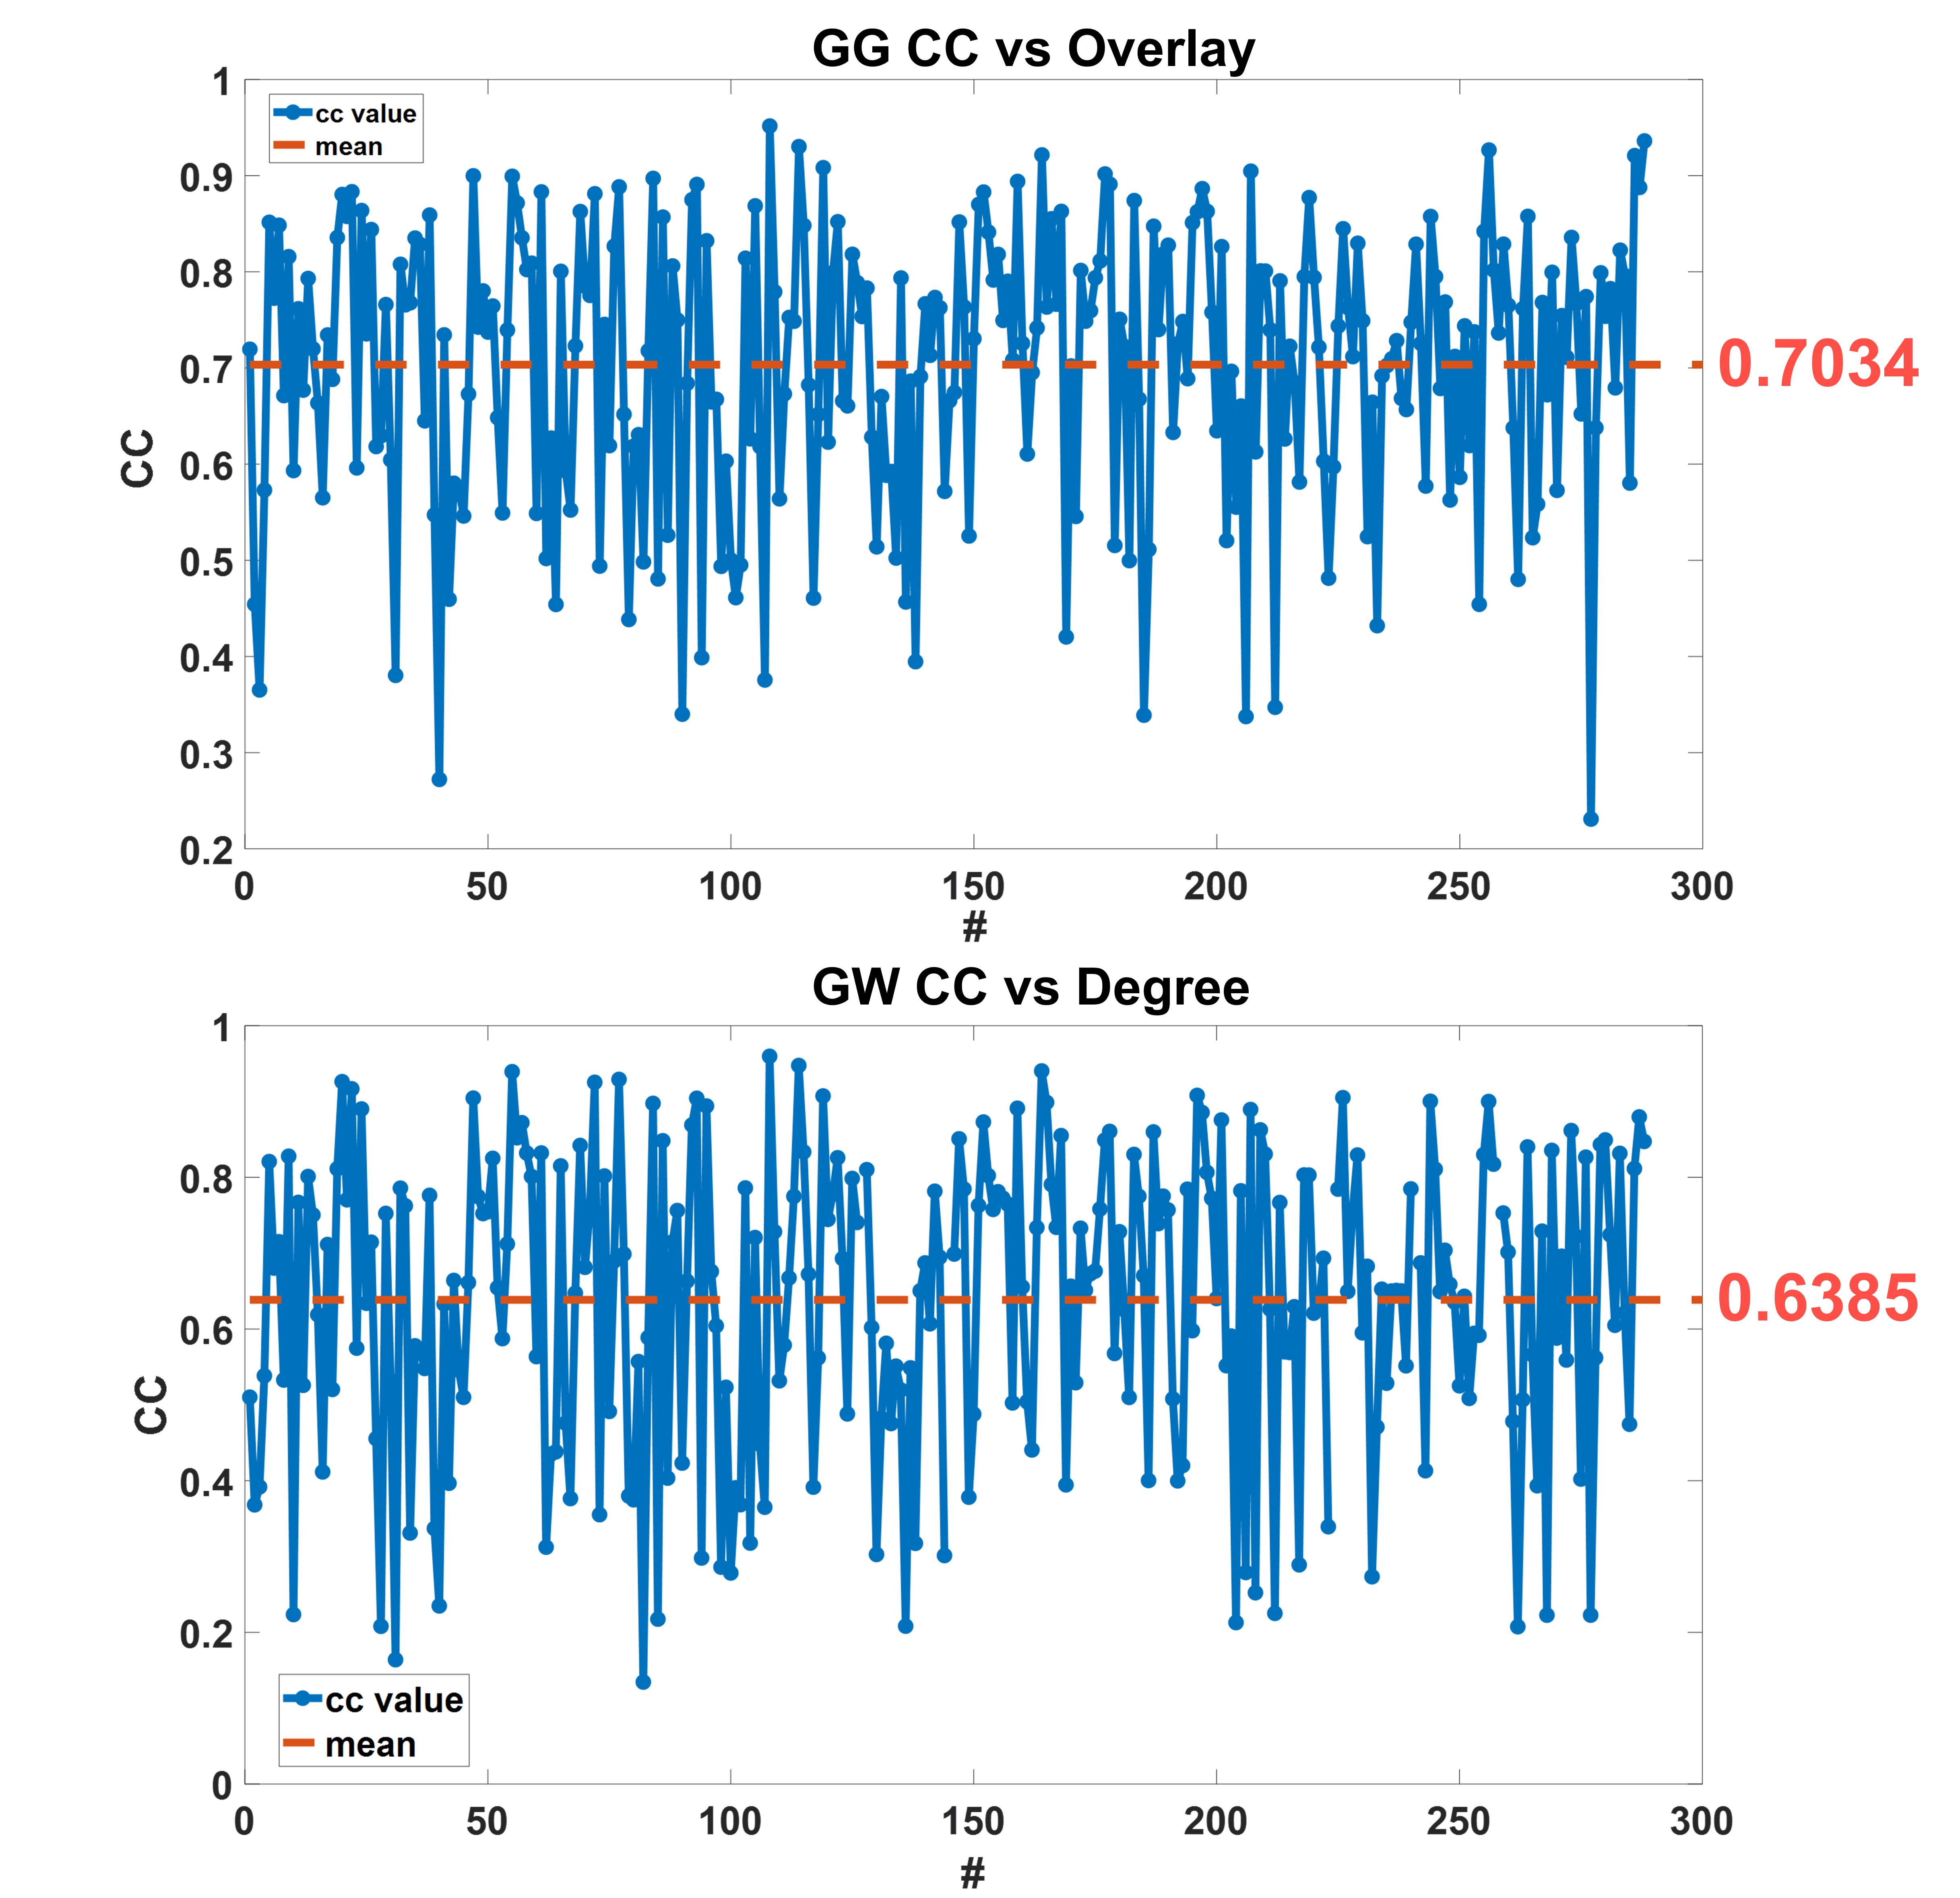
Figure 1. Correlation coefficients between elements of overlay networks of multilayer networks and those of GM-GM connectivity matrices (top) and correlation coefficients between elements of degree matrices of multilayer networks and those of GM-WM connectivity matrices (bottom) for CN subjects. Each blue dot represents the correlation coefficient corresponding to each subject, and the red dashed line represents the averaged correlation coefficient.
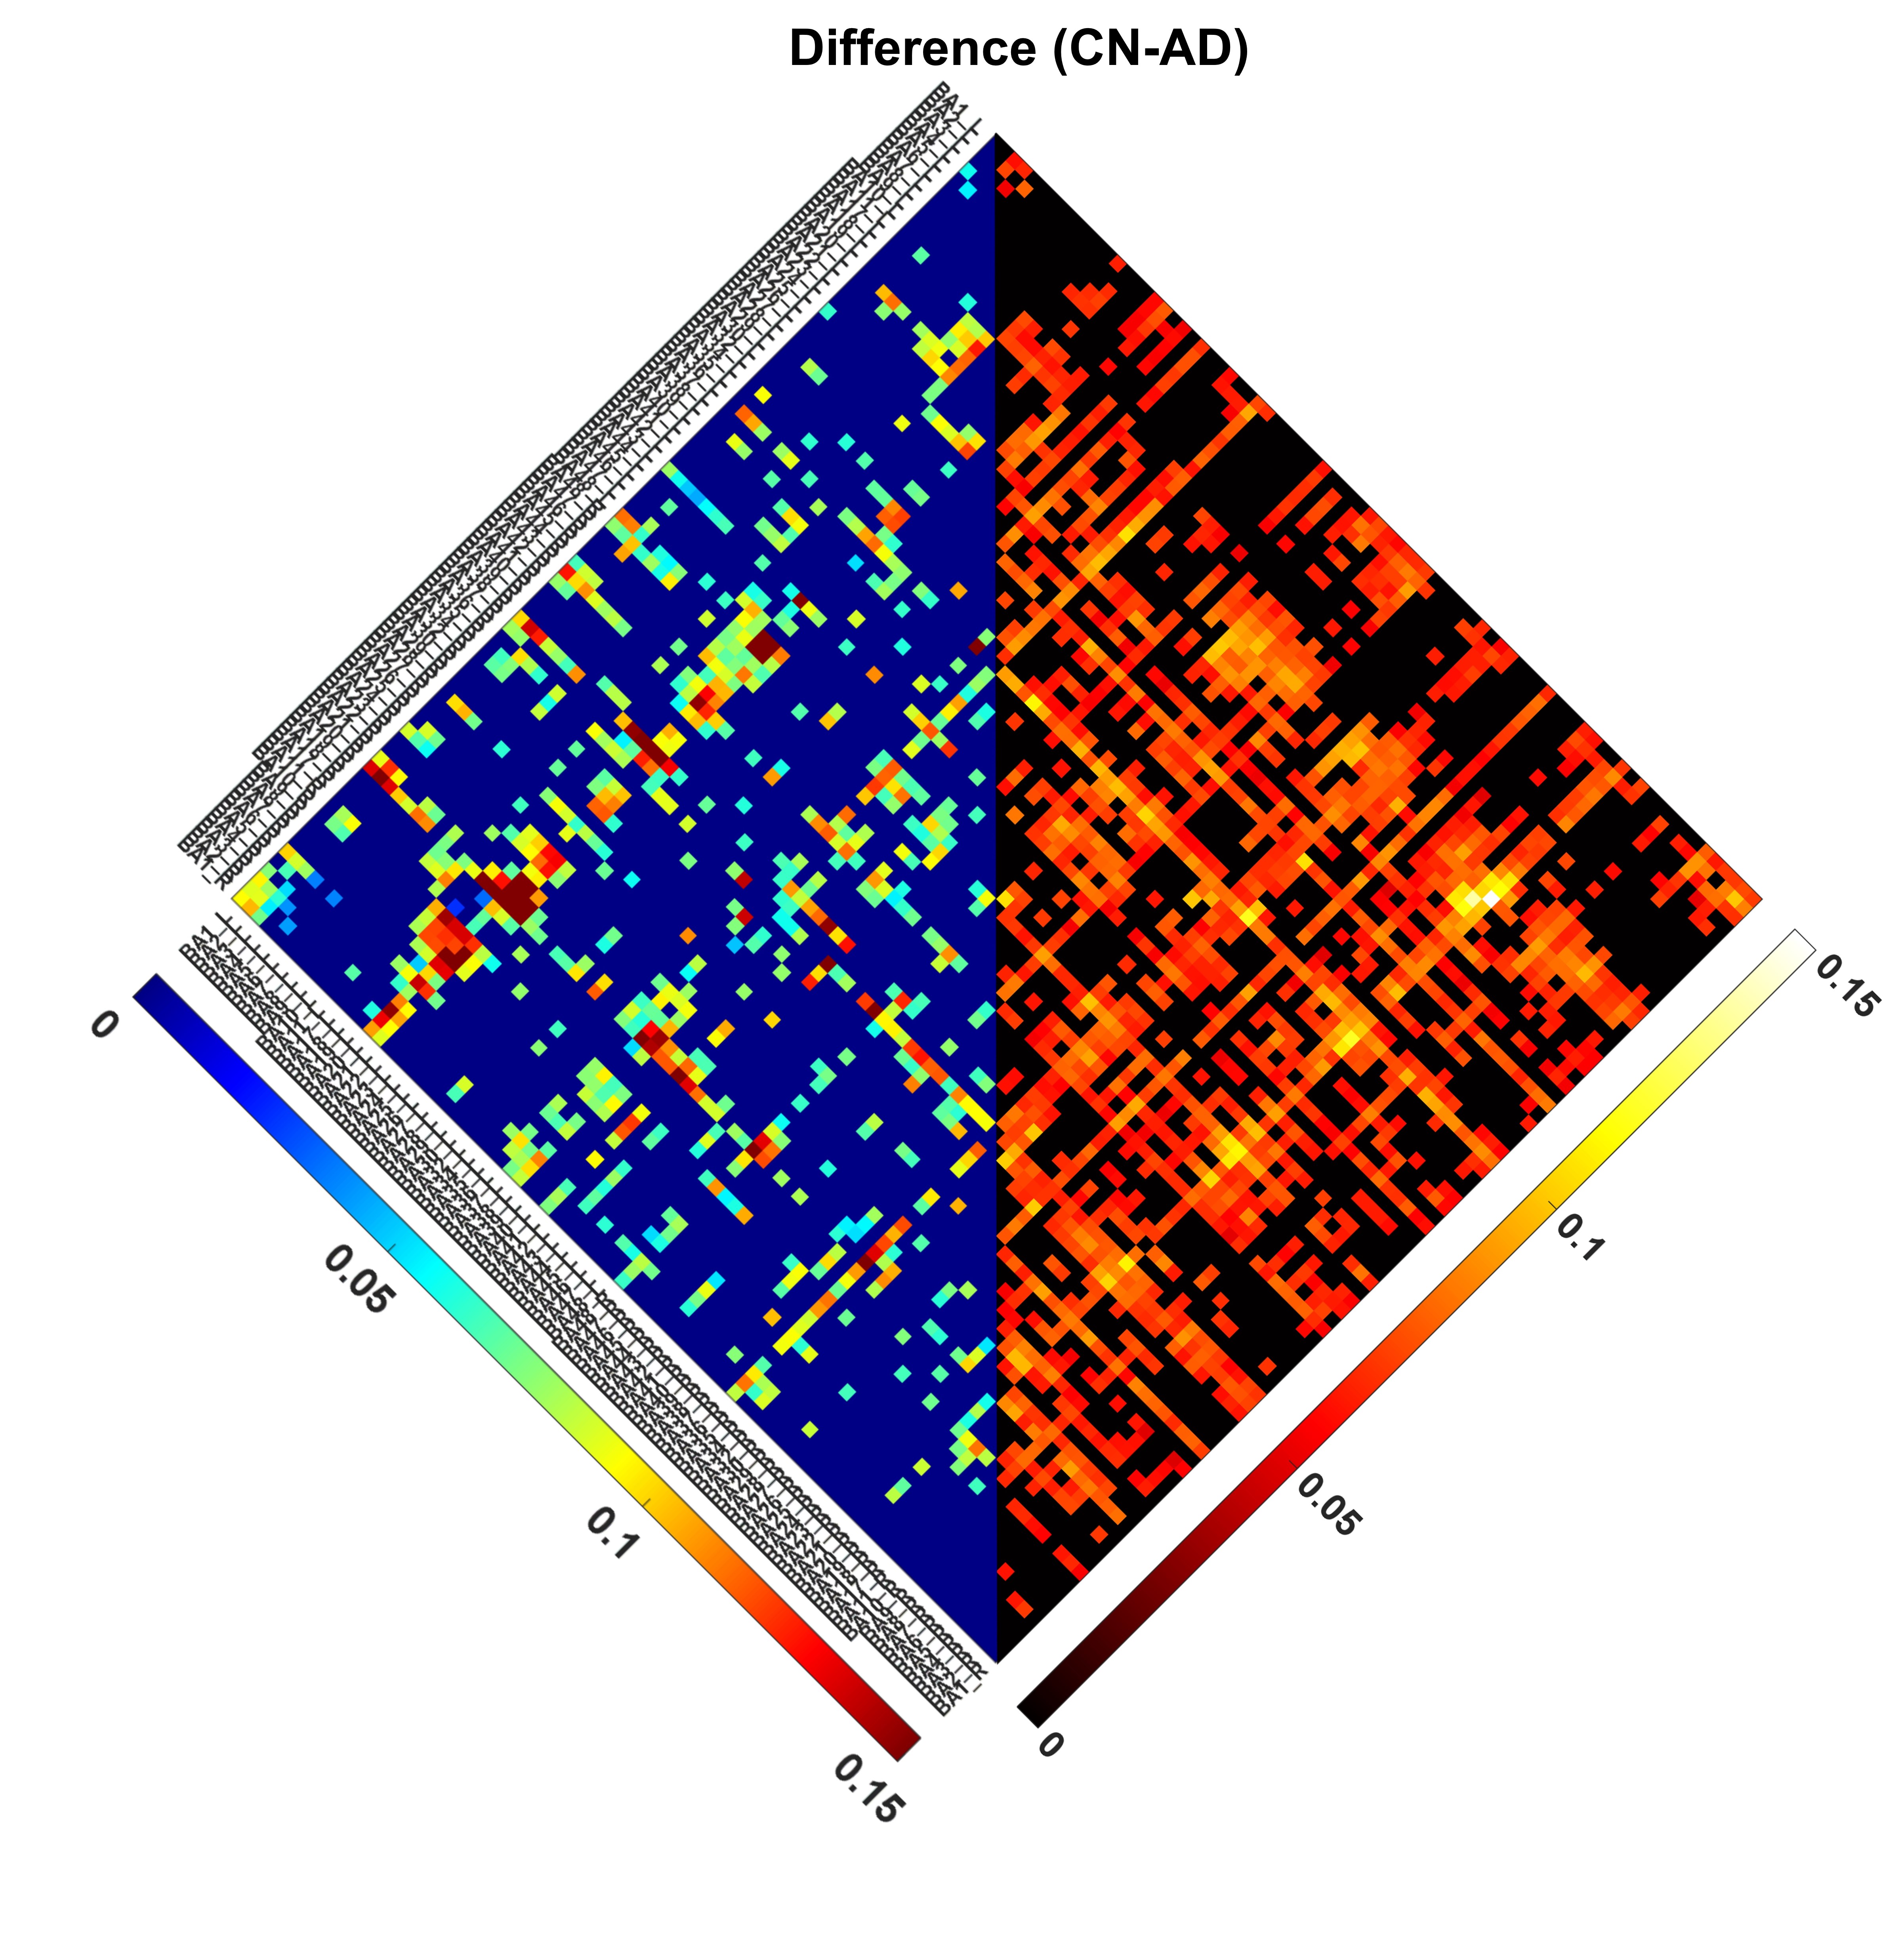
Figure 2: Significant differences (p<0.05) in mean GM-GM correlation coefficients (left triangle) and averaged overlay networks (right triangle) of multilayer networks.
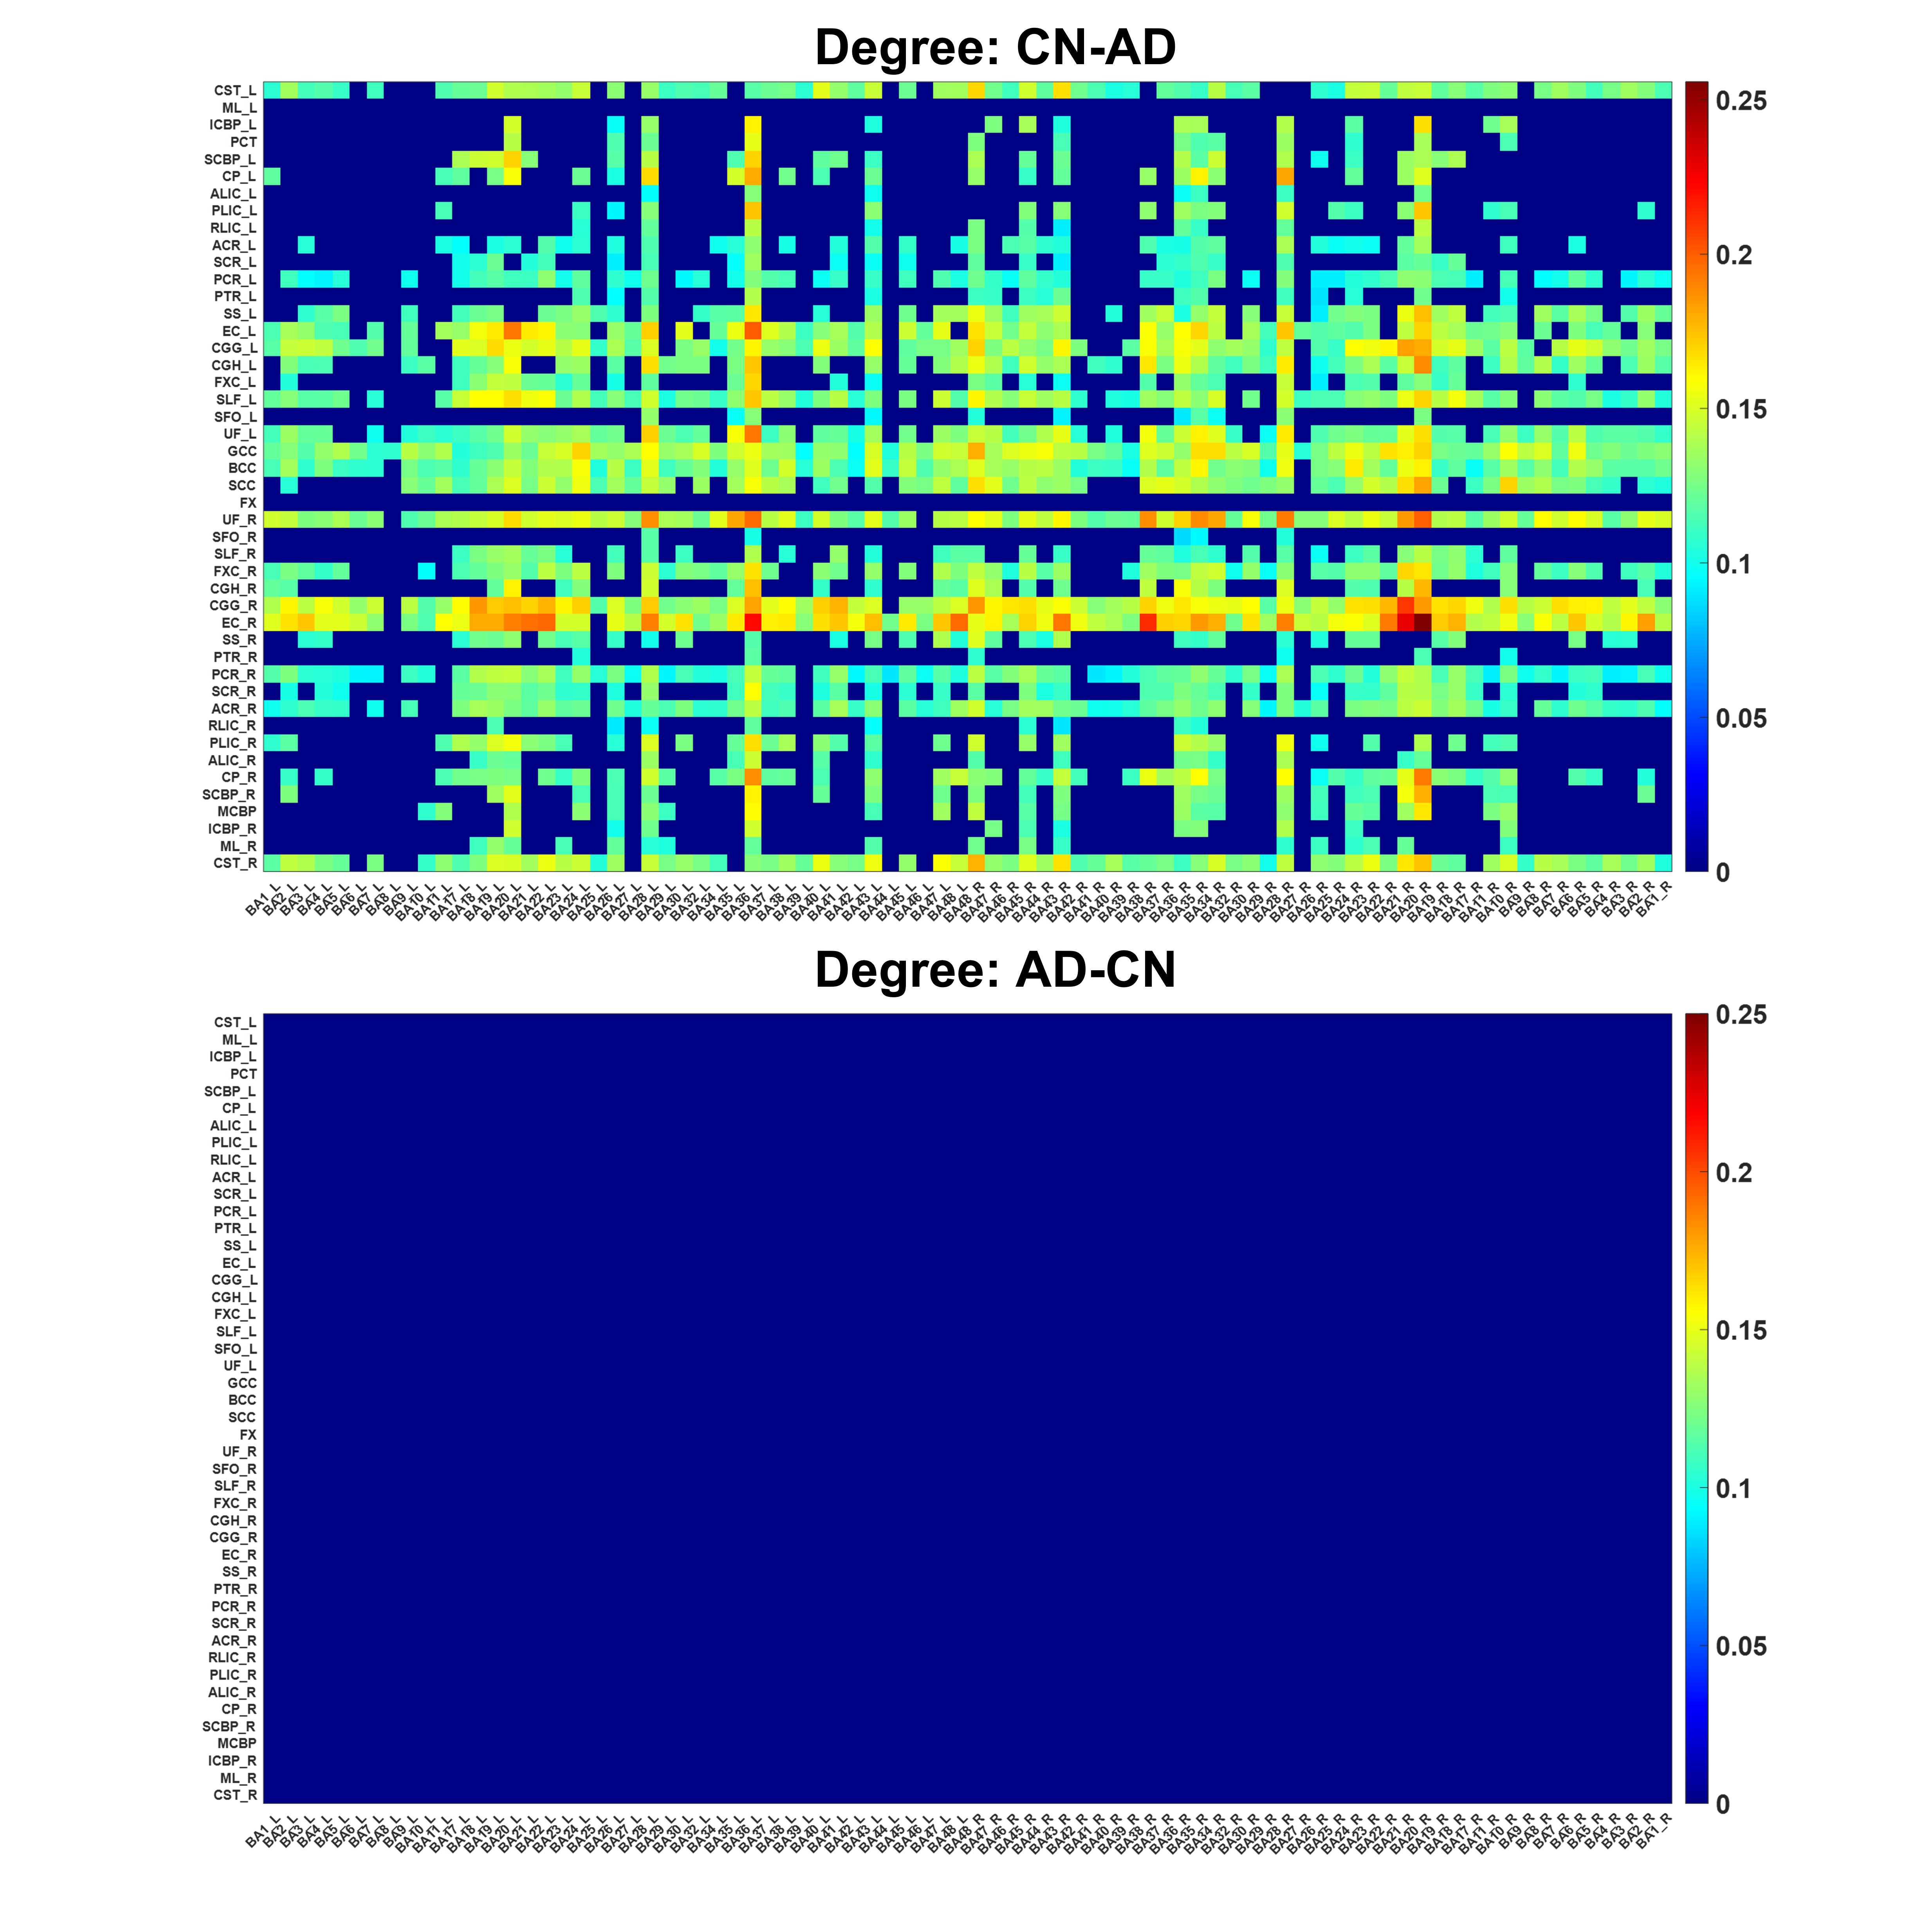
Figure 3: Significant differences (p<0.05) in mean degree matrix of multilayer networks. (Top: positive differences between CN subjects and AD patients; Bottom: positive differences between AD patients and CN subjects.)