4957
A Comparison of FLASH-based Volumetric B1+ Mapping Methods in Phantom at 7 Tesla1Wellcome Centre for Integrative Neuroimaging, FMRIB, Nuffield Department of Clinical Neurosciences, University of Oxford, Oxford, United Kingdom, 2Siemens Healthcare AG, Erlangen, Germany, 3Spinoza Centre for Neuroimaging, Amsterdam, Netherlands, 4Department of Computational Cognitive Neuroscience and Neuroimaging, Netherlands Institute for Neuroscience, KNAW, Amsterdam, Netherlands, 5Department of Radiology and Nuclear Medicine, Amsterdam University Medical Centers, University of Amsterdam, Amsterdam, Netherlands, 6Oxford Centre for Clinical Magnetic Resonance Research, John Radcliffe Hospital, University of Oxford, Oxford, United Kingdom, 7Department of Imaging Methods, Institute of Measurement Science, Slovak Academy of Sciences, Bratislava, Slovakia, 8Research & Collaborations GB&I, Siemens Healthcare Ltd, Frimley, United Kingdom
Synopsis
Keywords: High-Field MRI, Pulse Sequence Design, B1+ Mapping, SatTFL, Sandwich, SA2RAGE, 7 Tesla
Motivation: Fast and accurate B1+ mapping is critical for parallel transmission in ultra-high field MRI, but several options exist, and which is the most optimal is unknown.
Goal(s): To evaluate three FLASH-based volumetric B1+ mapping methods; 2D SatTFL, 3D SA2RAGE and 3D Sandwich.
Approach: We acquired fully sampled absolute B1+ maps at 7T in a realistic human head phantom across multiple transmission voltages to establish a ground truth and assess the dynamic range of each method.
Results: SA2RAGE and Sandwich both enable low-power non-selective RF pulses and maintain accuracy for low B1+ regions. Sandwich has a 60% shorter acquisition time than SA2RAGE.
Impact: This study will help to inform a choice of B1+ mapping sequences when imaging at ultrahigh field.
Introduction
Ultra-high field MRI (≥7T) offers significant advantages over clinically available field strengths, but challenges remain in overcoming the increased B1+ inhomogeneity. Parallel transmission (pTx) is the solution, but needs fast and accurate B1+ maps to realise its full potential. FLASH-based absolute B1+ mapping is suitable for UHF and is flow-insensitive and robust to motion. 2D B1+ sequences, e.g. presaturated Turbo-FLASH (SatTFL)[1], are often used in the cerebrum due to their fast acquisition times. However, the compromise is anisotropic voxels, slice profile effects, and smaller coverage, and it may not be feasible in other body regions such as the heart. Additionally, the use of slice-selective saturation pulses can be SAR-limiting due to their high peak voltage. A 3D B1+ mapping sequence is desirable, but a 3D sequential SatTFL acquisition is too slow. In this abstract, we assessed three FLASH-based B1+ mapping methods in phantom at 7T.Methods
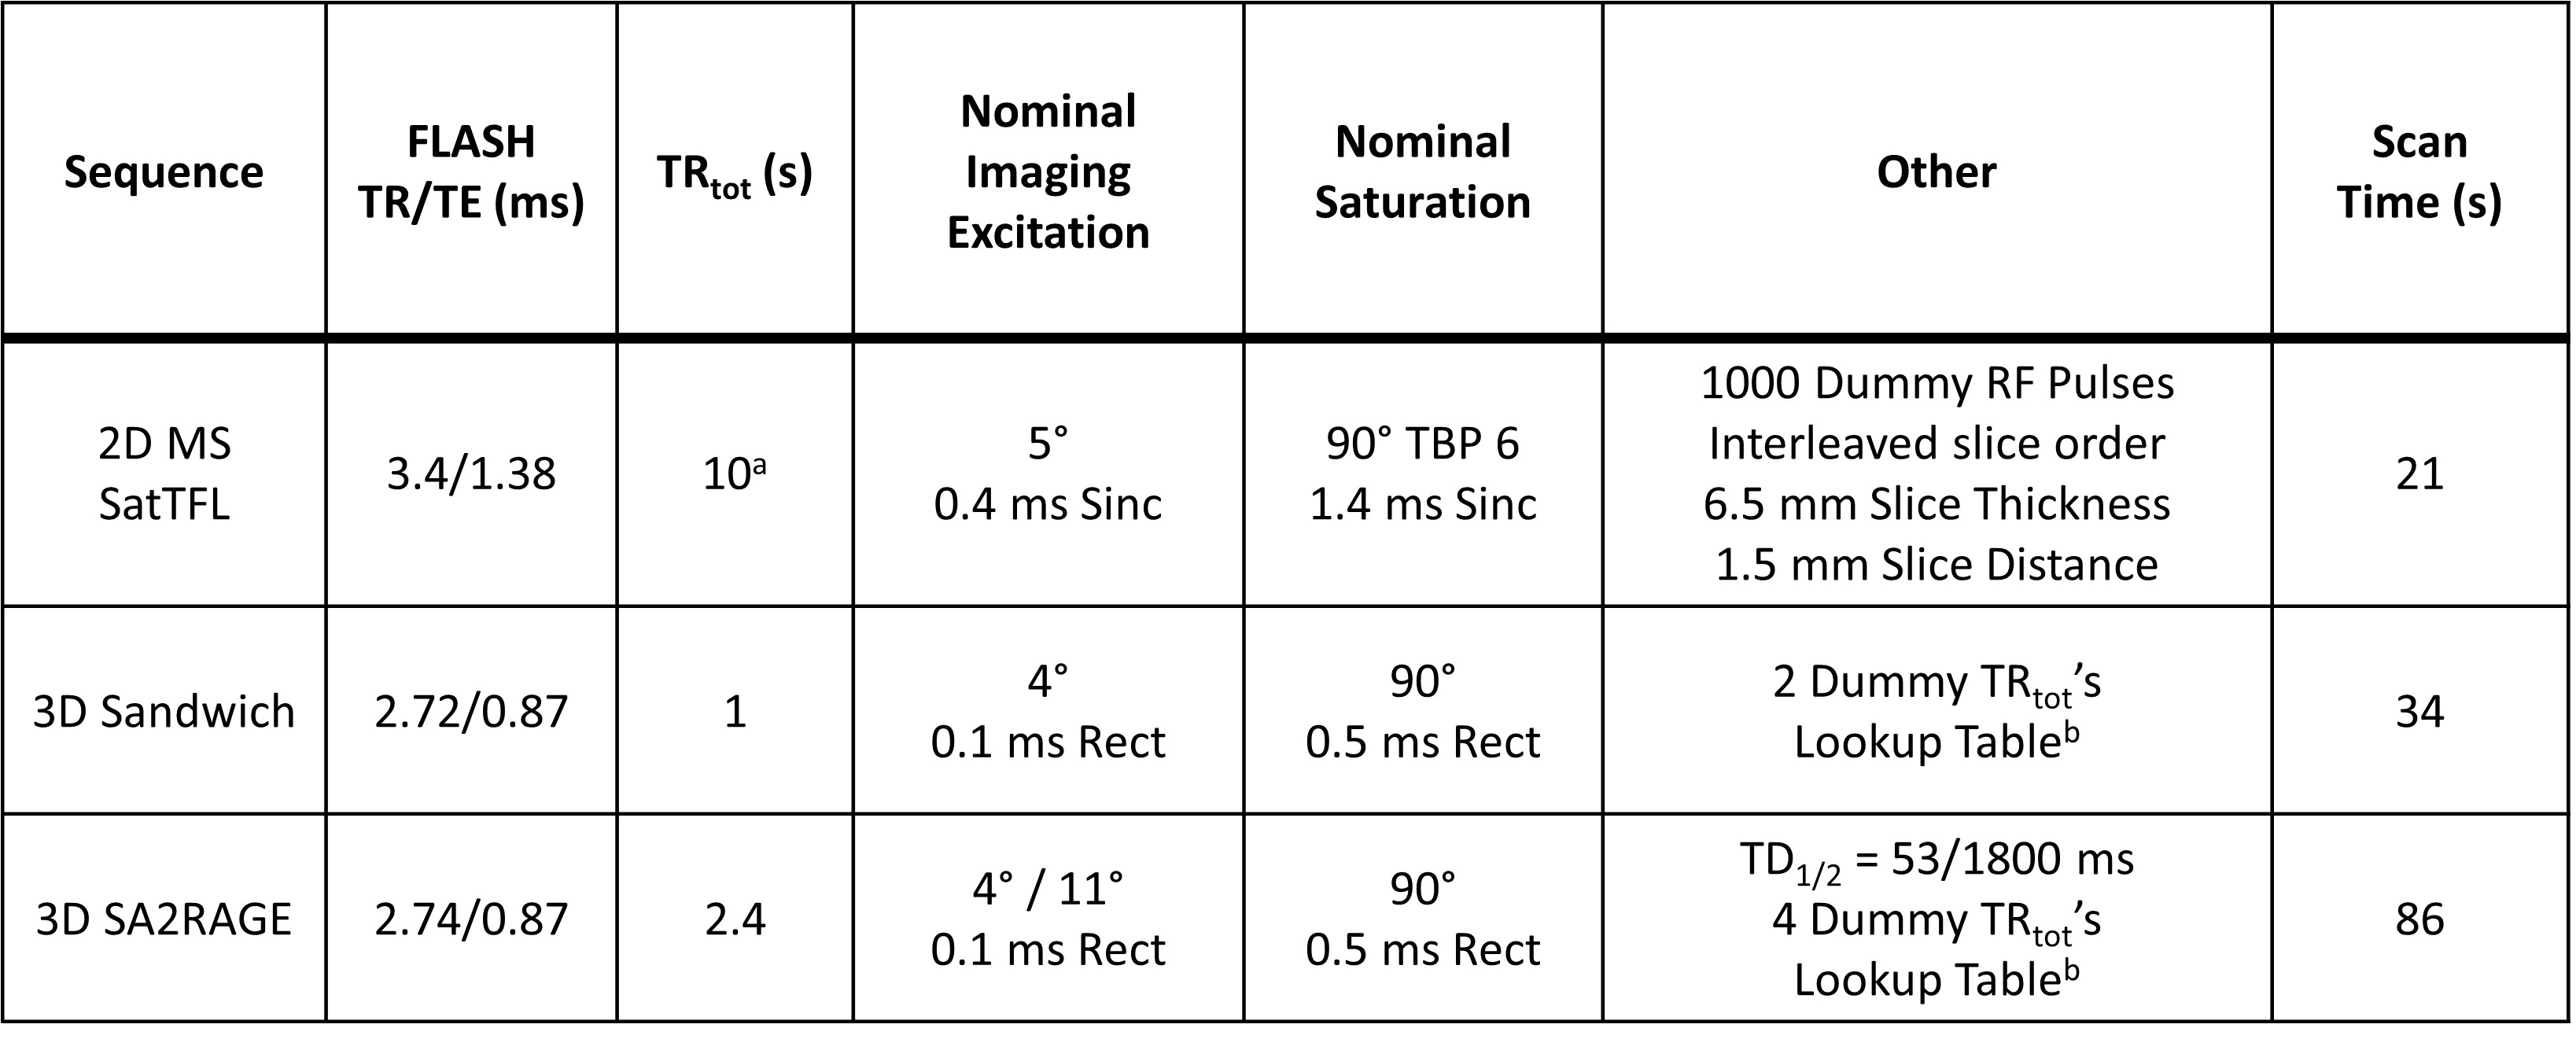
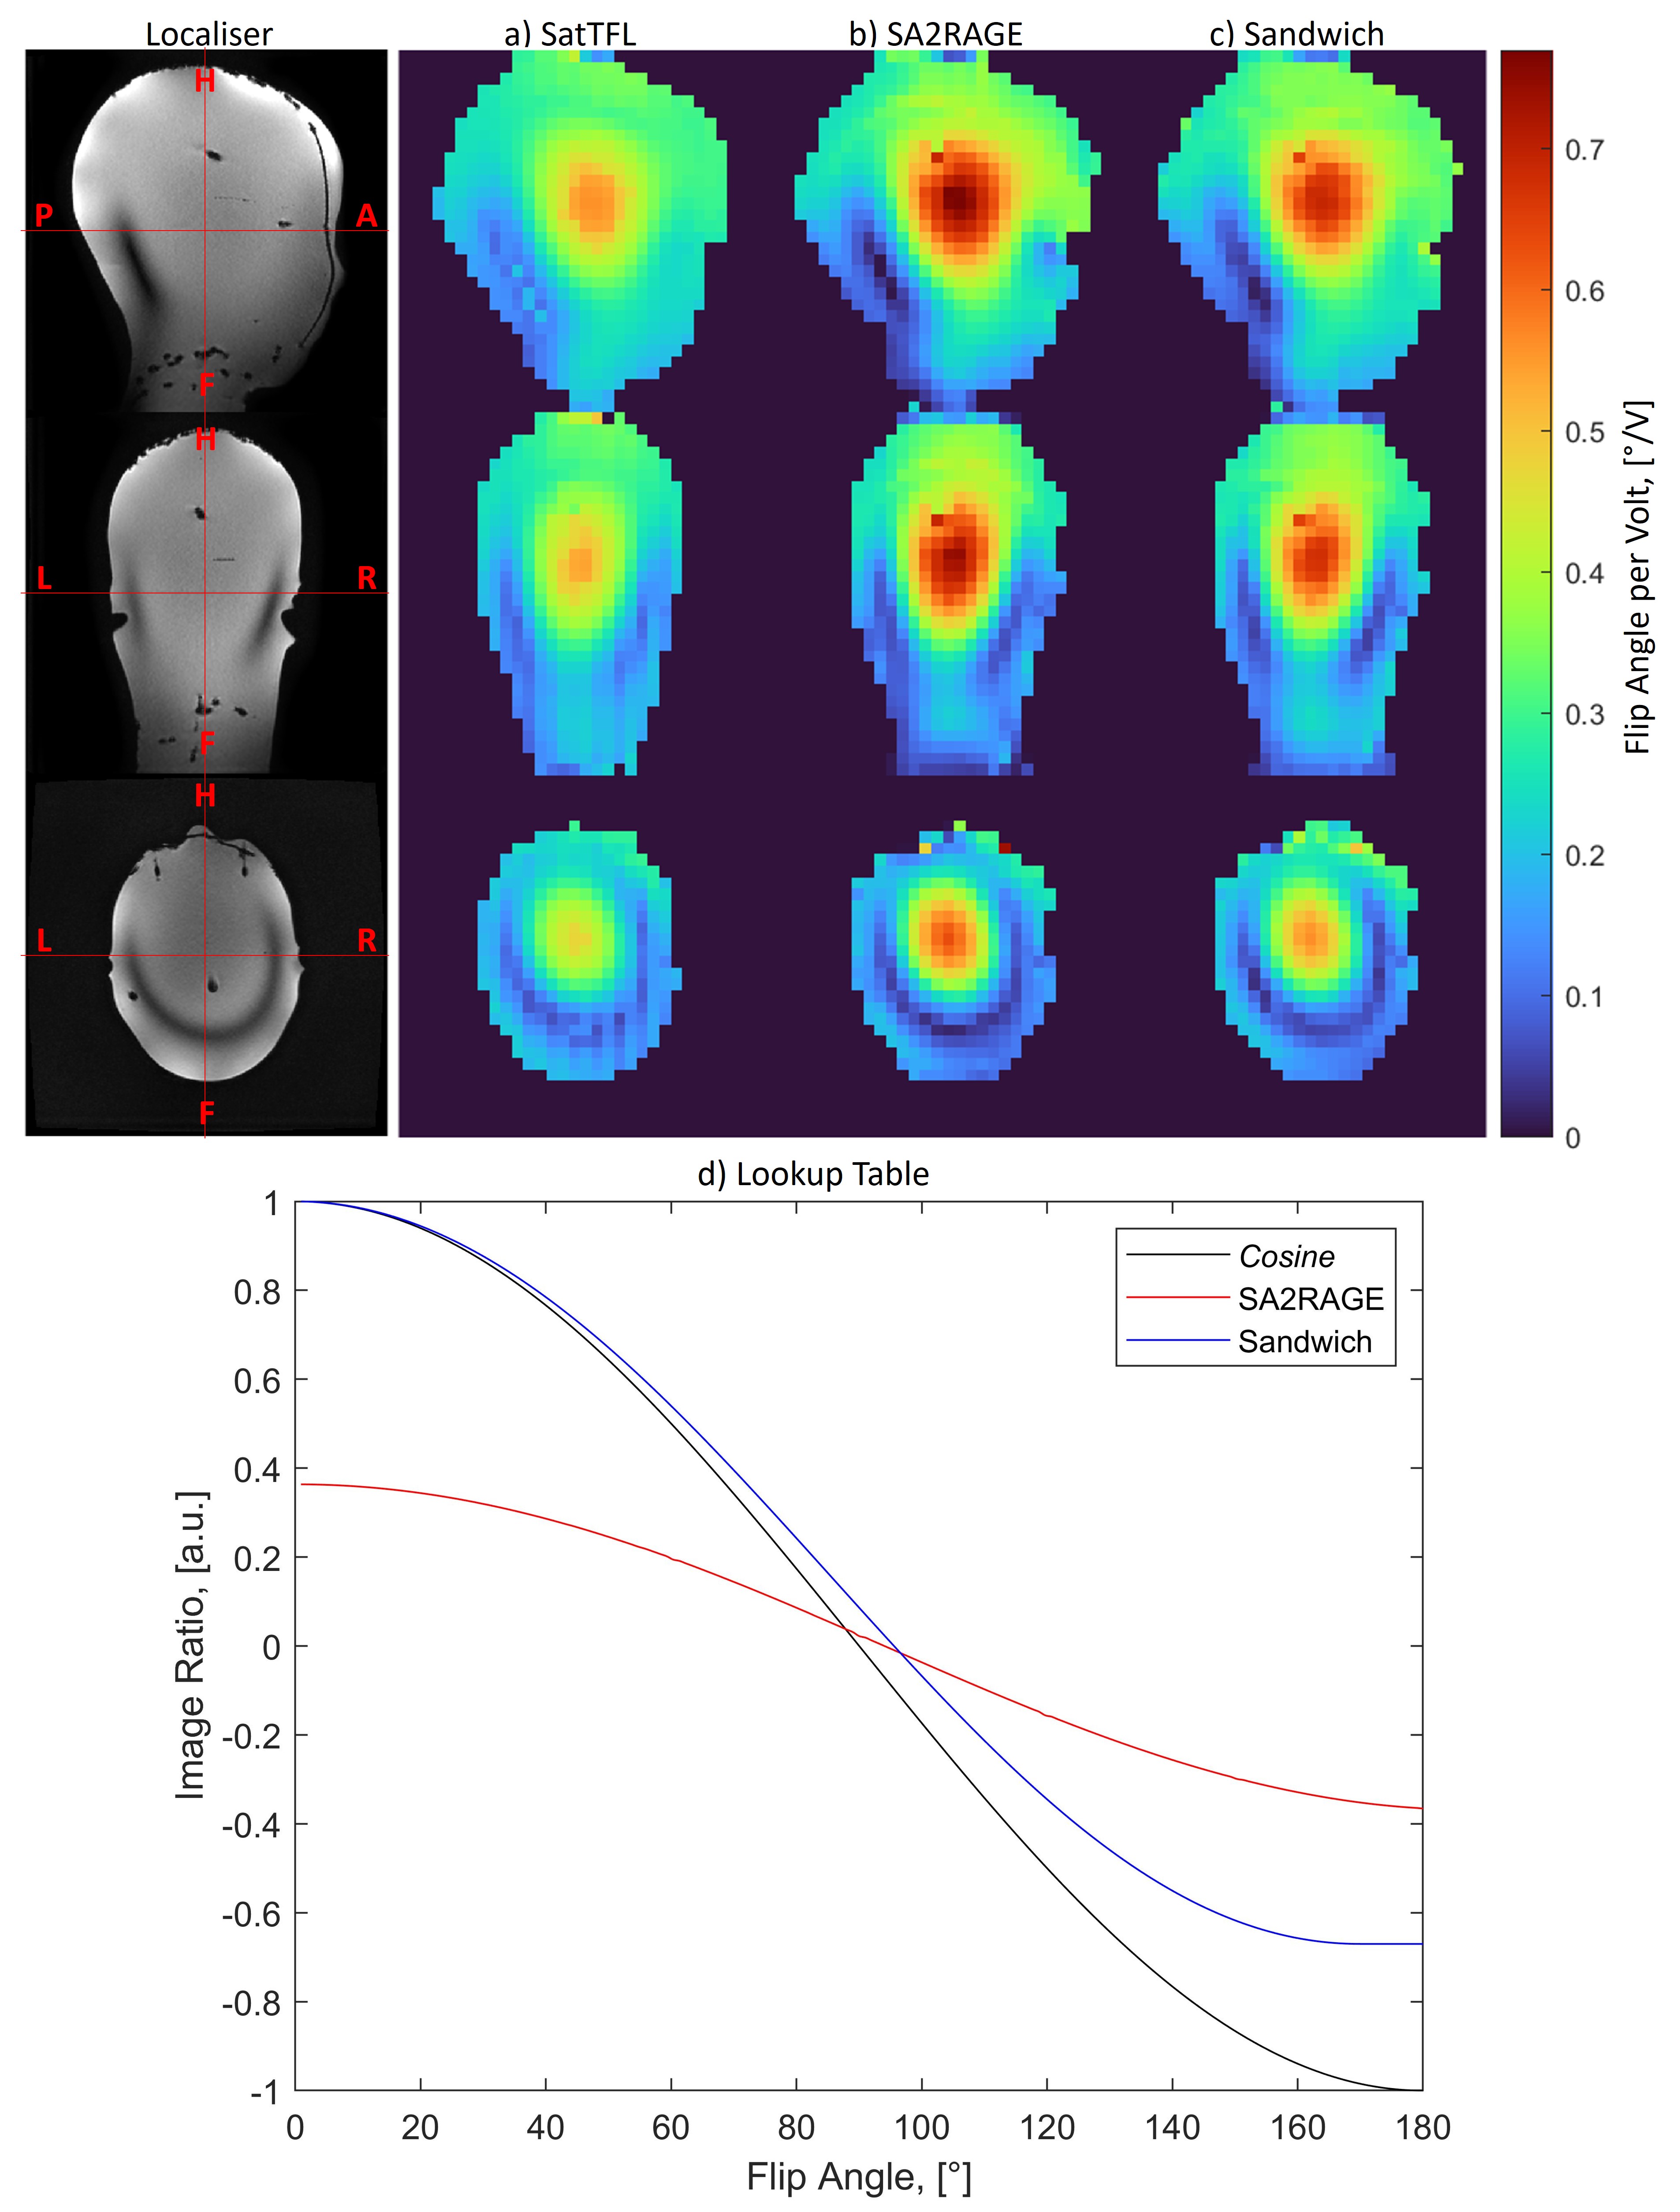
3D Sandwich[2] and 3D SA2RAGE[3] sequences were implemented by making minor pulse sequence modifications to a FLASH product sequence. An ‘Ella’ head phantom with realistic dielectric properties (61% distilled water, 36% polyvinylpyrrolidone, 0.7% NaCl, 1.5% Agarose) was imaged using an 8Tx/32Rx head coil (Nova Medical, Wilmington, MA) using a single-shim mode (CP+) at 7T (MAGNETOM Terra.X, Siemens Healthineers, Germany). A 2D SatTFL protocol was chosen to closely match that of a default product protocol. Appropriate Sandwich and SA2RAGE parameters were chosen from the literature[2,6]. All sequences acquired a fully sampled 24×32×32 scan matrix (including asymmetric echo) for a large (256)3 mm3 FOV covering the entire head, linearly encoded, bandwidth = 500Hz/px, TurboFactor = 32 and RF spoiled. Sequence-specific parameters and acquisition times are summarised in Table 1. B1+ maps were acquired at 9 reference voltages (channel-combined) between 50V and 450V in 50V increments and combined to produce a common ‘ground truth’ across the entire FOV[4]. Image reconstruction was performed offline in MATLAB (MathWorks, USA) and coil sensitivities were estimated using ESPIRiT[5]. Images were masked based on the reference image intensity. As in the literature, B1+ maps were calculated using an arccosine function for SatTFL, and using a lookup table for Sandwich and SA2RAGE which were generated from EPG and Bloch simulations with an assumed T1 of 1.5 seconds, shown in Figure 1 d). Maps were additionally masked based on two simple criteria; firstly, that there is a minimum amount of signal in the reference images and secondly, that the measured flip angle should be increasing with voltage, otherwise the voxel was excluded from the ‘ground truth’. The reconstruction code and data are openly available at https://github.com/jameslewiskent/FLASH-B1-Mapping.Results
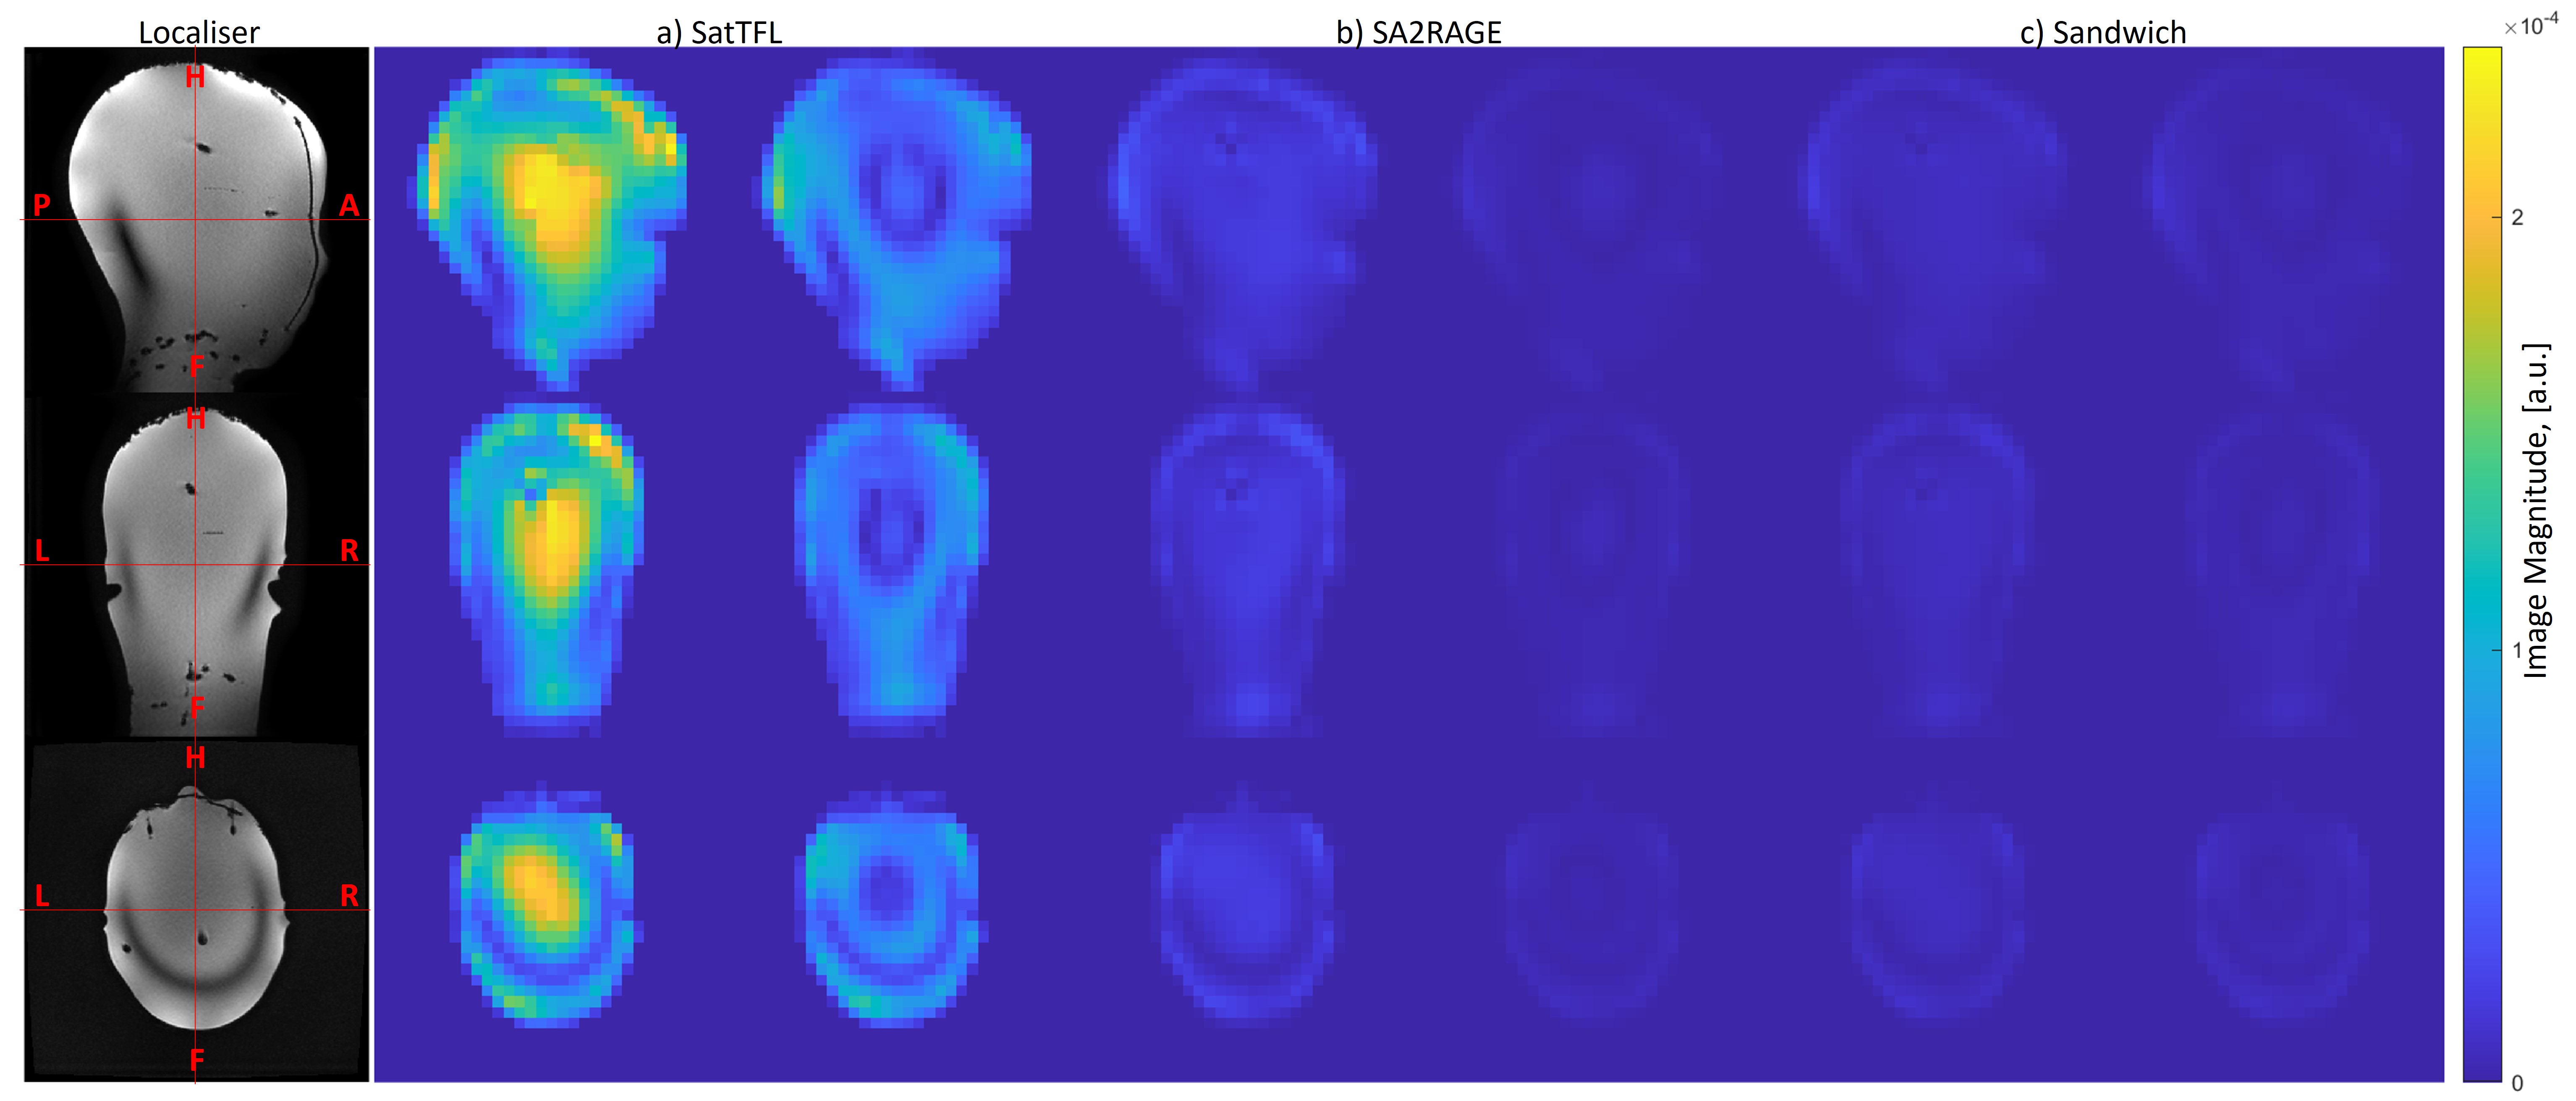
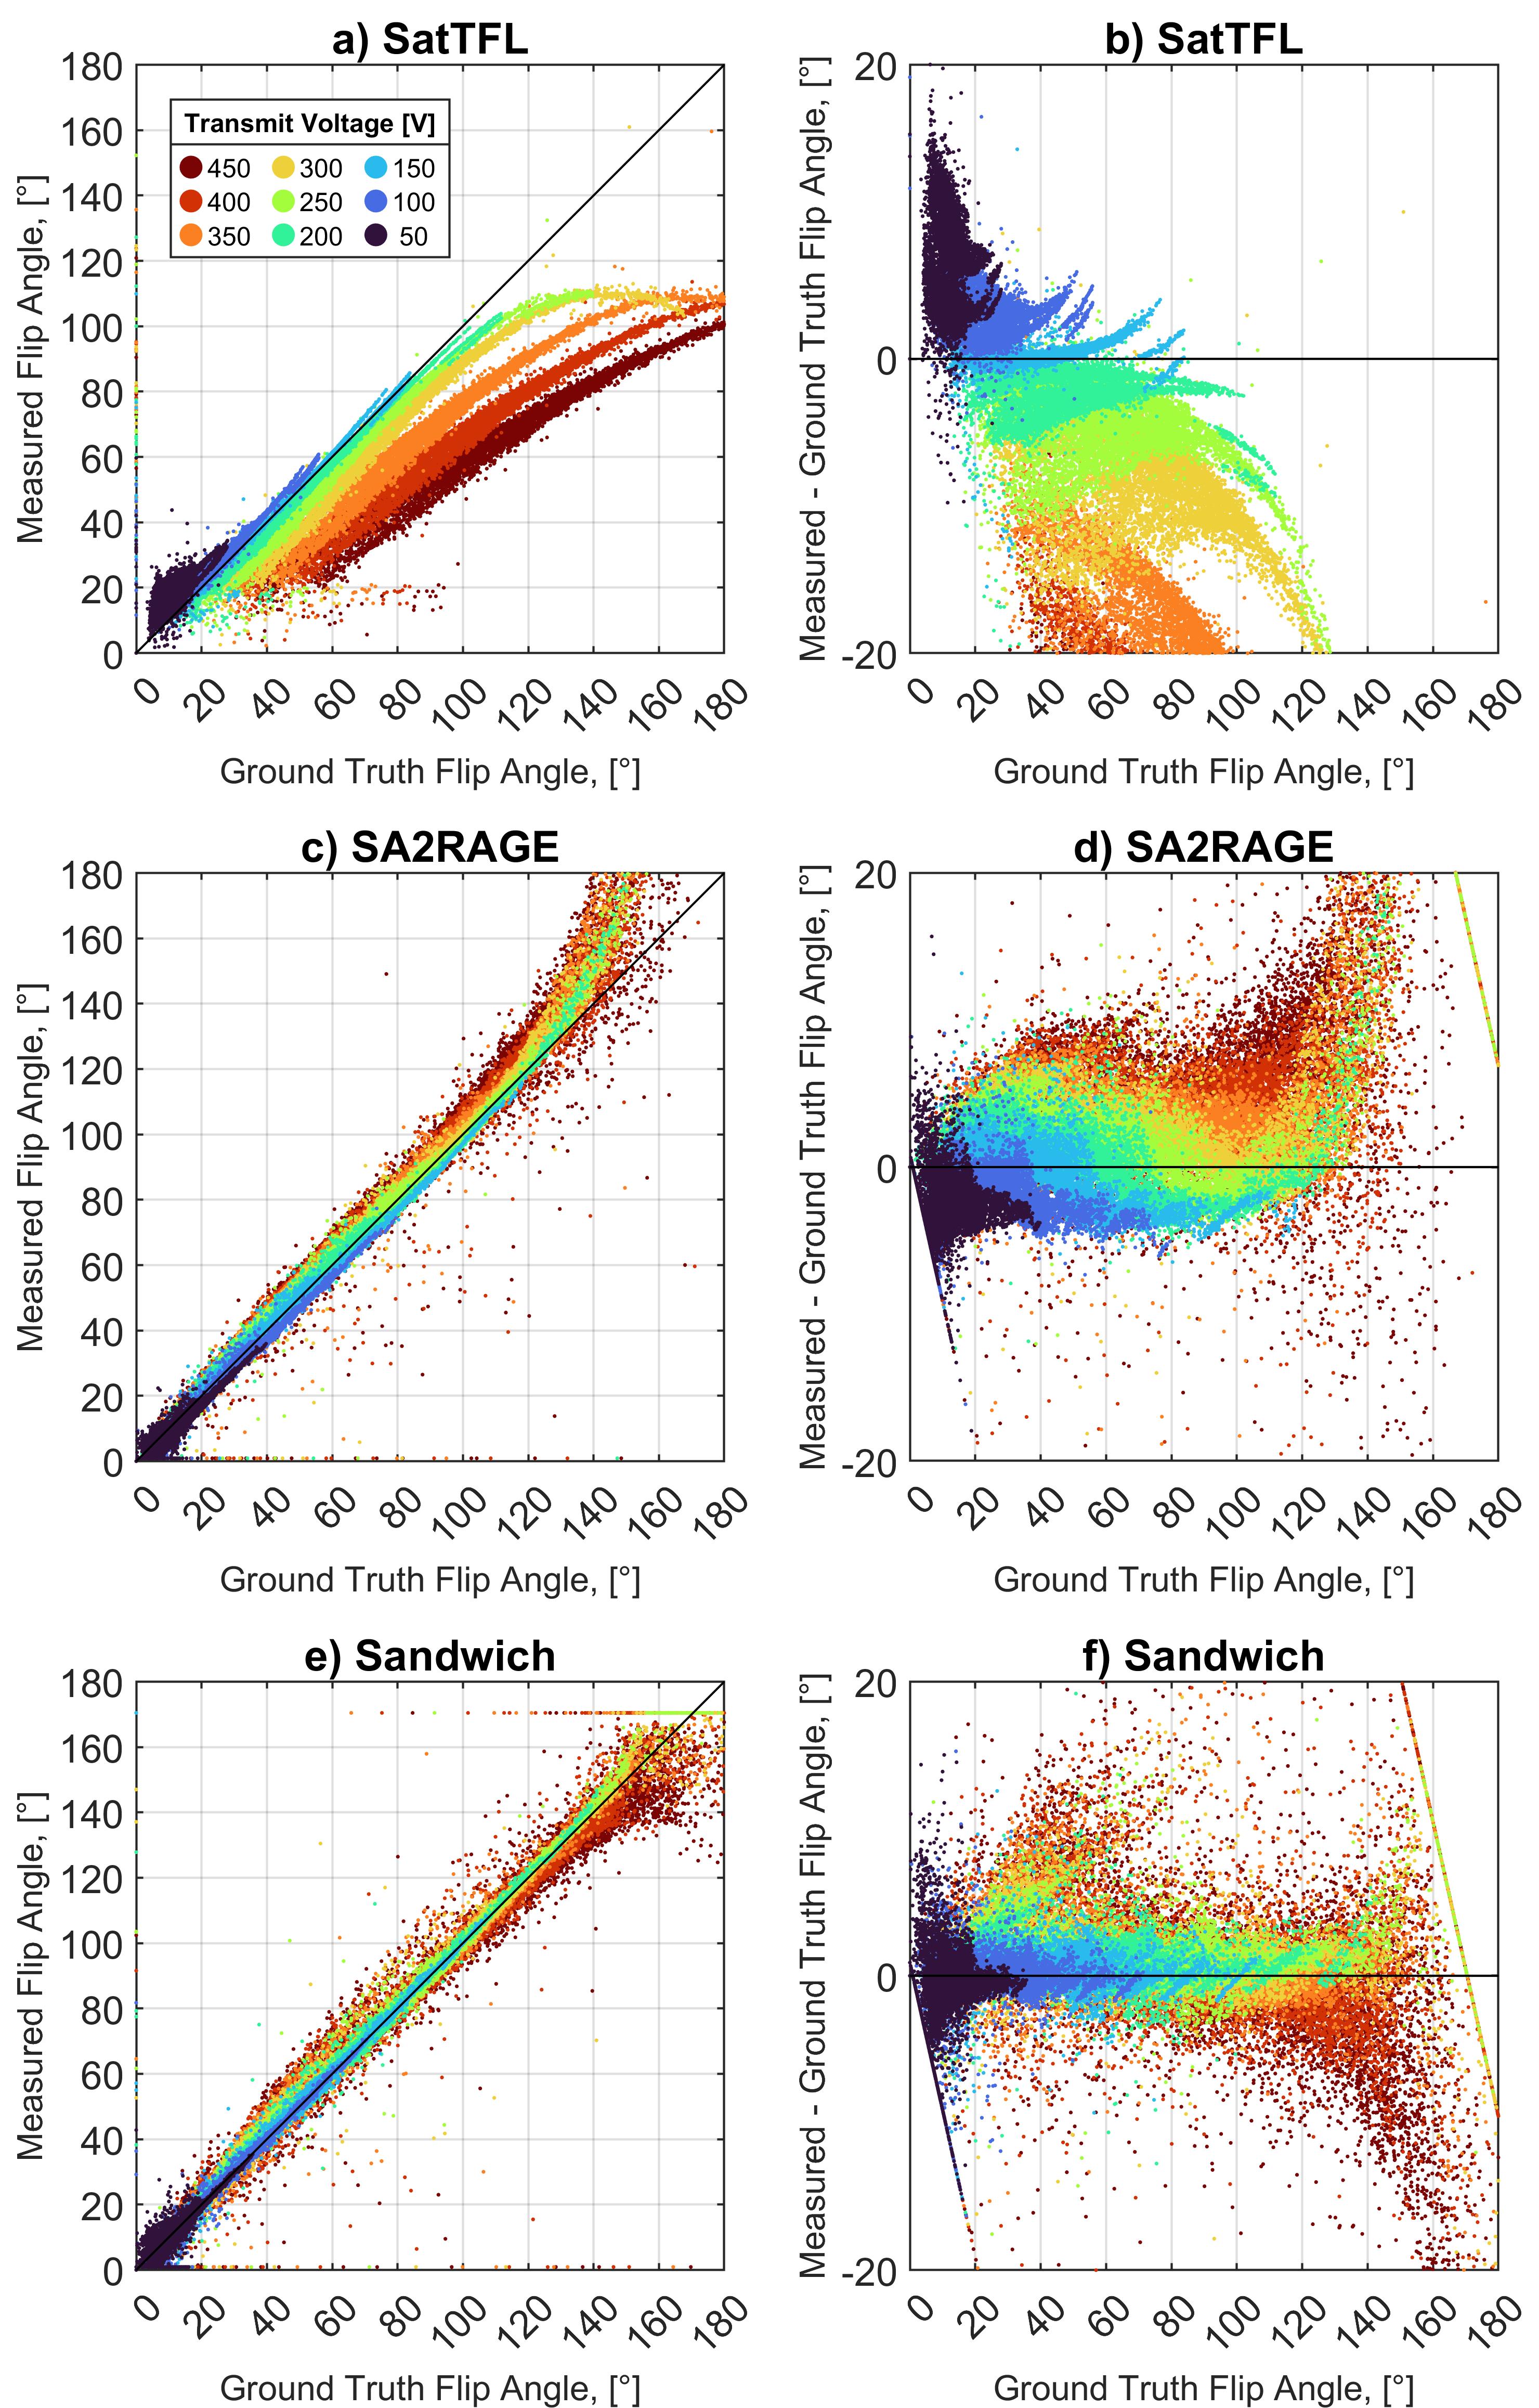
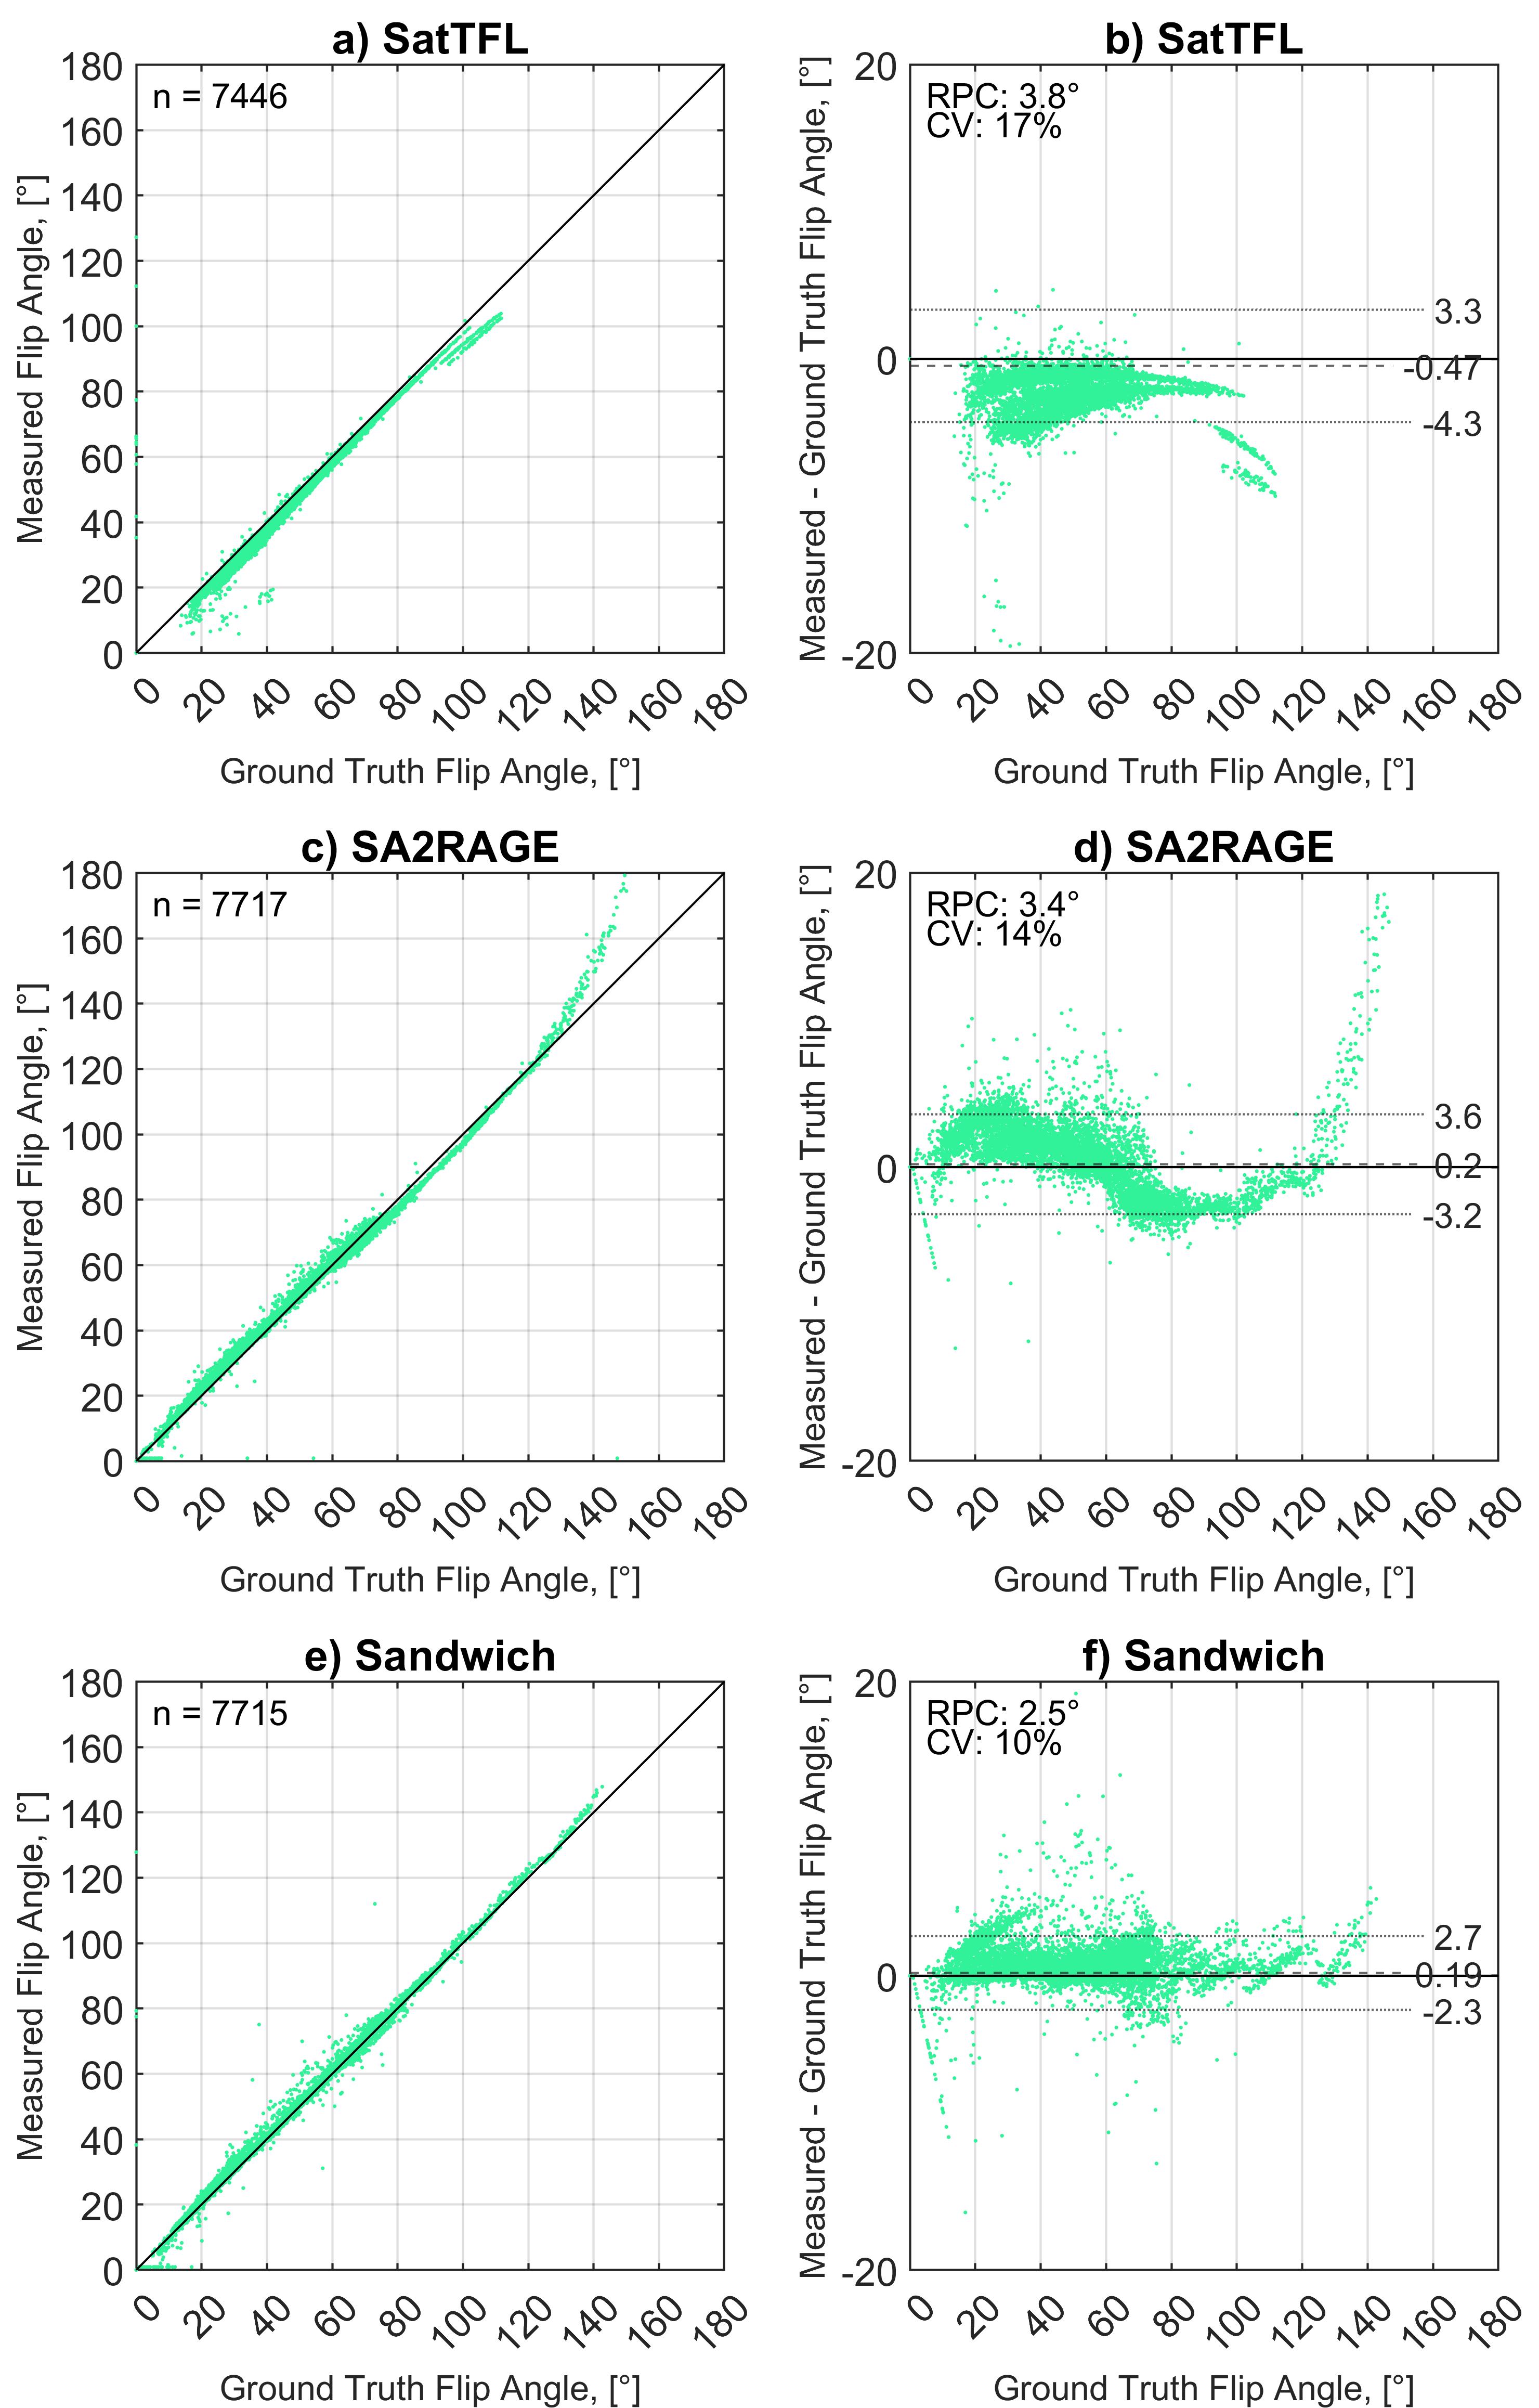
The ‘ground truth’ maps shown in Figure 1 a) to c) had a mean flip angle per volt across the entire head of 0.25 ± 0.02 °/V for SatTFL, 0.26 ± 0.03 °/V for SA2RAGE and 0.26 ± 0.01 °/V for Sandwich. Streaking artefacts are noticeable in the transverse view of the SatTFL ‘ground truth’ maps. Figure 2 shows the reference and prepared images for each of the sequences. SatTFL shows the greatest signal magnitude due to the long (10s) recovery time between the two images. SA2RAGE had an average reference image magnitude of 2.3× Sandwich, whereas Sandwich had an average prepared image magnitude of 1.1× SA2RAGE. Figure 3 shows correlation and Bland-Altman plots for each sequence. SA2RAGE and Sandwich show good agreement with similar dynamic ranges of 20°-140°, whereas SatTFL shows a reduced dynamic range of 20°-100°. Reference voltages for SatTFL above 275V lead to clipping of the saturation RF, hence voxels from measurements above this were not included in the ‘ground truth’ calculation. Using a lookup table for SatTFL instead of the arccosine function did not improve the SatTFL results. Both SatTFL and Sandwich tend to underestimate high flip angles, whereas SA2RAGE overestimates. Figure 4 shows a single measurement at 200V where the standard deviation from the ‘ground truth’ was 1.9°, 1.7° and 1.3° for SatTFL, SA2RAGE and Sandwich, respectively.Discussion
Typically, the Sandwich sequence makes use of a non-adiabatic HS8 pulse as the saturation, giving better B0 insensitivity than a rectangular pulse. However, since SA2RAGE could also benefit from this saturation pulse, we have not used this to allow for a fairer comparison. Recently, a SA2RAGE acquisition accelerated with compressed sensing achieved up to 15-fold undersampling with <5% relative error in B1+[6]. Going forward, we intend to investigate how Sandwich and SA2RAGE compare when accelerated, given the slight differences in SNR of the two methods.Conclusion
SA2RAGE and Sandwich both enable non-selective RF pulses with lower transmit power demand maintaining accuracy for low B1+ regions.Acknowledgements
JK acknowledges the support of EPSRC through an iCASE award in collaboration with Siemens Healthcare Ltd. The Wellcome Centre for Integrative Neuroimaging is supported by core funding from the Wellcome Trust (203139/Z/16/Z and 203139/A/16/Z). LV is funded by a Sir Henry Dale Fellowship awarded jointly by the Wellcome Trust and the Royal Society (221805/Z/20/Z) and also acknowledges the support of the Slovak Grant Agencies VEGA (2/0004/23) and APVV (#21–0299).References
[1] Chung S, Kim D, Breton E, Axel L. Rapid B1+ mapping using a preconditioning RF pulse with TurboFLASH readout. Magn Reson Med 2010;64:439–446.
[2] Kent JL, Dragonu I, Valkovič L, Hess AT. Rapid 3D absolute B1+ mapping using a sandwiched train presaturated TurboFLASH sequence at 7T for the brain and heart. Magn Reson Med 2023;89:964–976.
[3] Eggenschwiler F, Kober T, Magill AW, Gruetter R, Marques JP. SA2RAGE: A new sequence for fast B1+-mapping. Magn Reson Med 2012;67:1609–1619.
[4] de Buck MHS, Kent JL, Jezzard P, Hess AT. Head‐and‐neck multichannel B1+ mapping and RF shimming of the carotid arteries using a 7T parallel‐transmit head coil. Magn Reson Med 2023:1–15.
[5] Uecker M, Lai P, Murphy MJ, et al. ESPIRiT - An eigenvalue approach to autocalibrating parallel MRI: Where SENSE meets GRAPPA. Magn Reson Med 2014;71:990–1001.
[6] Bonanno G, Hilbert T, Liebig P, Marques JP, Kober T. Whole-brain 3D B1+ mapping in under 30 seconds: compressed-sensing accelerated SA2RAGE. In: In Proc Intl Soc Mag Reson Med. Vol. 31. 2023. p. 1423.
Figures