4953
A comparison of different sources of soy lecithin for the production of MRI phantoms with systematic analysis of effects on T1, T2, and diffusion1Department of Diagnostic and Interventional Radiology, University of Tuebingen, Section on Experimental Radiology, Tübingen, Germany, 2Institute for Diabetes Research and Metabolic Diseases of the Helmholtz Centre Munich at the University of Tuebingen, Tübingen, Germany, 3German Center for Diabetes Research (DZD), Neuherberg, Germany
Synopsis
Keywords: Phantoms, Phantoms
Motivation: While soy lecithin has been shown to be a beneficial substance for the production of diffusion phantoms, there is no research to date on whether this applies generally or only to specific product sources of soy lecithin.
Goal(s): To investigate the variability of the MR-related properties of three different types of soy lecithin (SL-1,SL-2,SL-3).
Approach: Aqueous soy lecithin solutions of different concentrations were prepared for all three soy lecithin sources and examined using DWI and Relaxometry.
Results: It was found that the MR-related properties of aqueous soy lecithin solutions are dependent on the type of soy lecithin used.
Impact: This work shows that MR properties of soy lecithin strongly depend on the product source. Related effects must be considered for the production of phantoms with tissue-like relaxation and diffusion properties.
Introduction
Recently, soy lecithin was found to be a beneficial substance for the construction of MRI phantoms with tissue-like apparent diffusion coefficients (ADC values)1,2,3. Soy lecithin added to water offers a wide range of adjustable ADC values (corresponding to the range in human organs) at relatively low concentrations and shows no additional signal components in the 1H spectrum1,2. With the addition of agar, ADC and T2 can be adjusted almost independently. In addition, soy lecithin is non-toxic, inexpensive, and readily available from various manufacturers. However, since lecithin is a natural product, the composition and properties may vary slightly between different product batches or product sources. This could make reproducibility difficult if different sources of soy lecithin are used. The aim of this work was to investigate the variability of the MR-related properties of different soy lecithin sources. The effects on the ADC and on the relaxation times, T1 and T2, of water were systematically investigated using three different sources of soy lecithin.Materials and Methods
Materials and sample preparationThree different sources of soy lecithin were purchased: SL-1 (soy lecithin, Carl Roth, Karlsruhe, Germany), SL-2 (L-α-lecithin, soybean, Merck Millipore, Burlington, USA), and SL-3 (soy lecithin, Thermo Fisher Scientific, Waltham, USA). The cost of the agents ranged between 25 € (SL-1) and 66 € (SL-3) per 250 grams.
Aqueous soy lecithin solutions of different concentrations (0, 1, 2, 3, 4, 5%) were prepared for each of the three types of lecithin. The solutions were prepared by dissolving the appropriate amount of soy-lecithin in purified water under magnetic stirring at 650 rpm for 10 minutes. After preparation, the solutions were filled into sterilized polypropylene tubes (Greiner Bio-One, Frickenhausen, Germany) and fixed in a cylindrical MR-compatible housing.
Data acquisition and analysis
MRI was performed on a clinical whole-body 3.0 T MR scanner (MAGNETOM Prismafit, Siemens Healthcare, Erlangen, Germany) using a standard 20-channel head coil. All data were collected at room temperature (approx. 21 °C) and processed offline with MATLAB (MathWorks, Inc., Natick, MA).
T1 was measured using a TSE-based inversion recovery pulse sequence with nine different TI values ranging from 25 ms to 6400 ms. TR and TE were set to 10,000 ms and 9.9 ms, respectively. T1 maps were calculated from the acquisitions with multiple TI by pixel-wise monoexponential fitting of signal intensities. T2 was measured using a multiple CPMG spin-echo pulse sequence with a TR of 6000 ms and 32 different TE’s ranging from 50 ms to 1600 ms. T2 maps were calculated by pixelwise monoexponential fitting of the signal intensities. DW-MRI was performed using a readout-segmented spin-echo EPI sequence with 4 different b-values (0, 50, 500, 1000 s/mm2). TR and TE were set to 5000 ms and 51 ms, respectively. ADC maps were calculated from the acquisitions with multiple b-values using a log-linear fitting of the signal intensities. T1, T2 and ADC values of each sample were determined from circular regions of interest (ROI) in the calculated maps.
Results
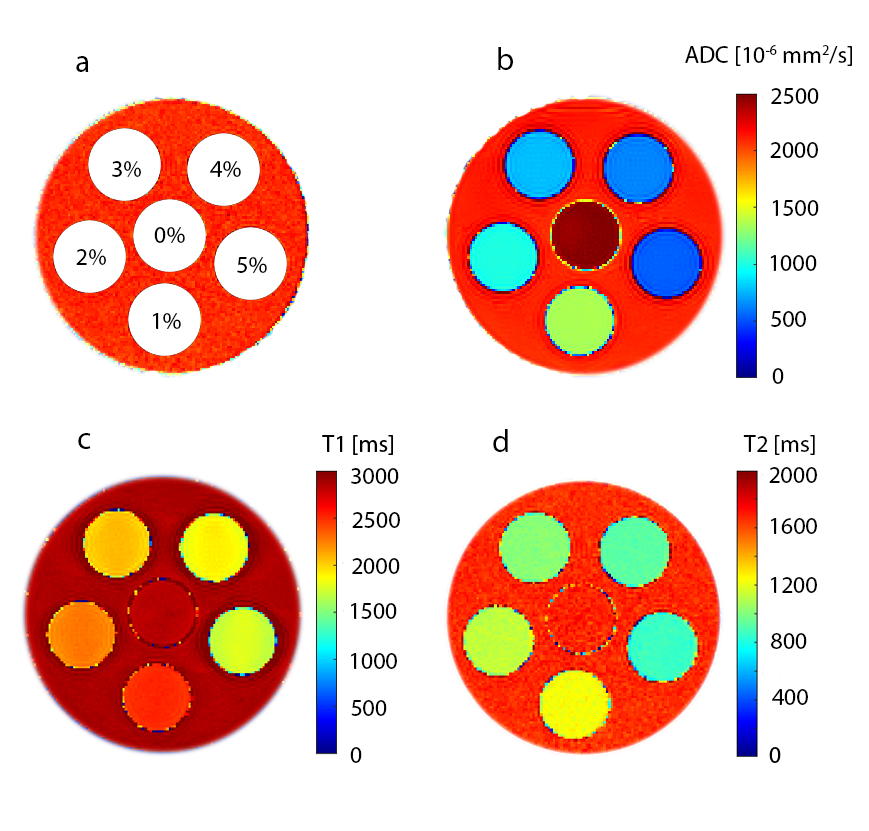
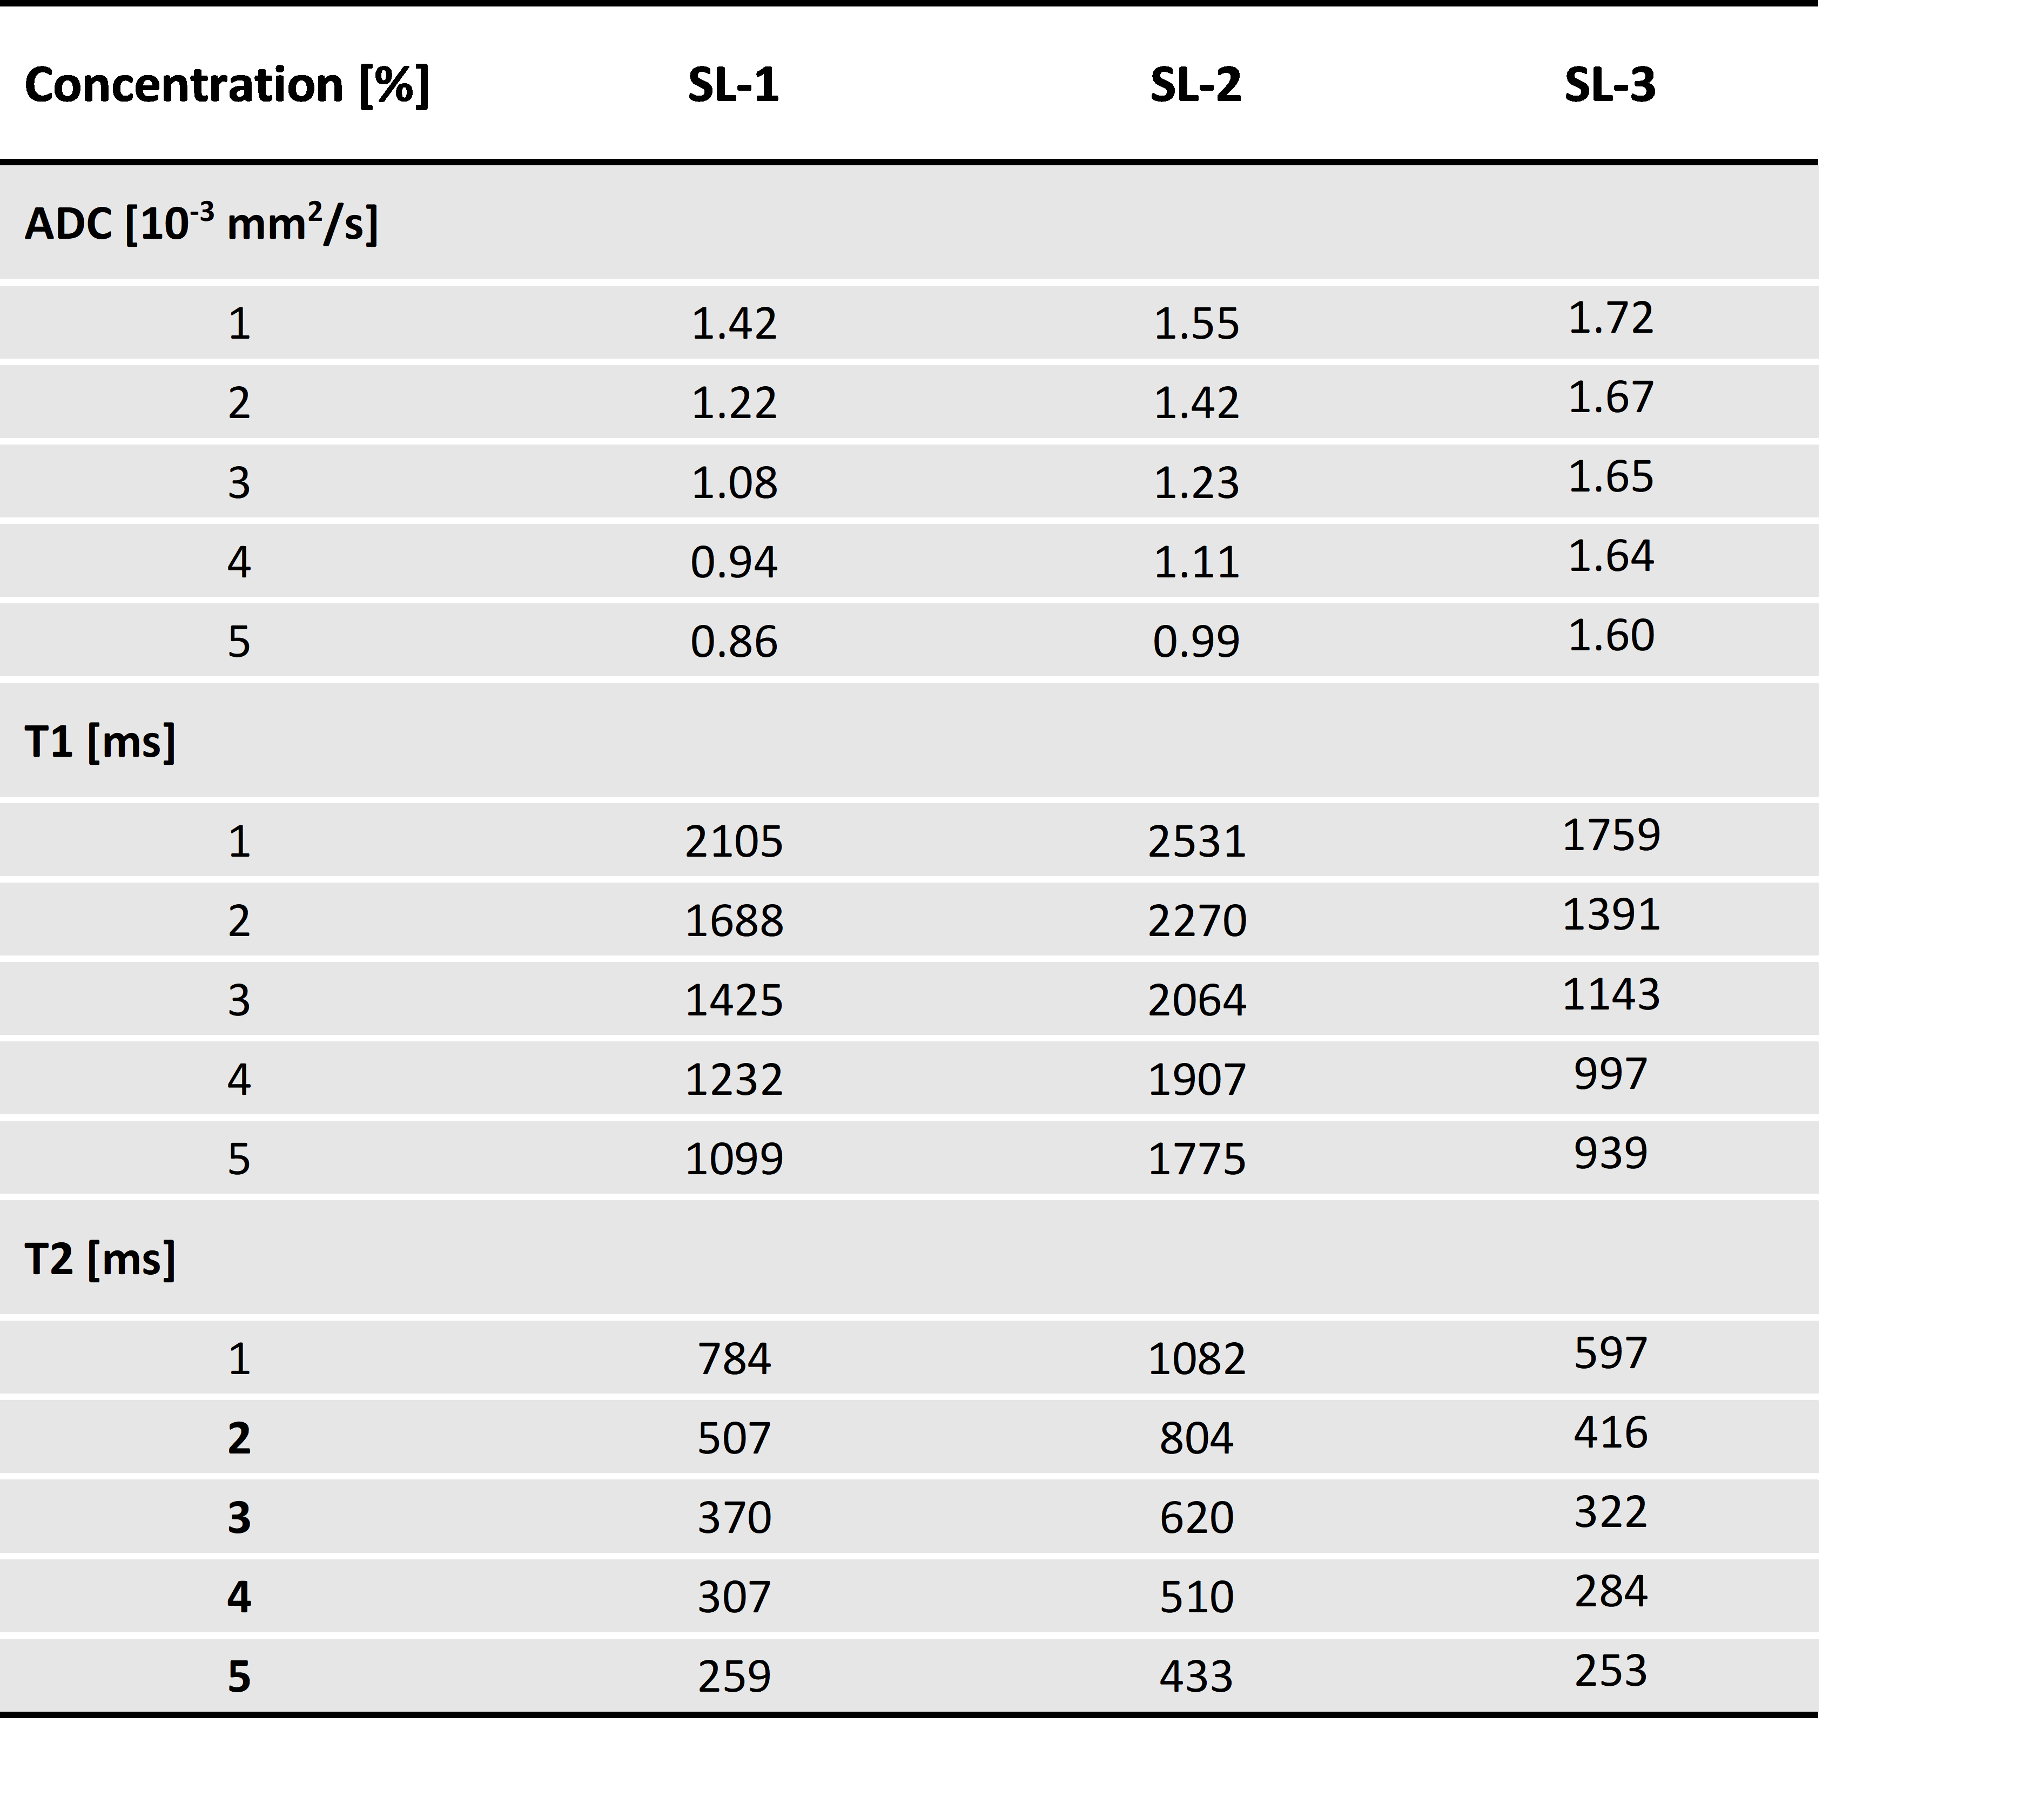
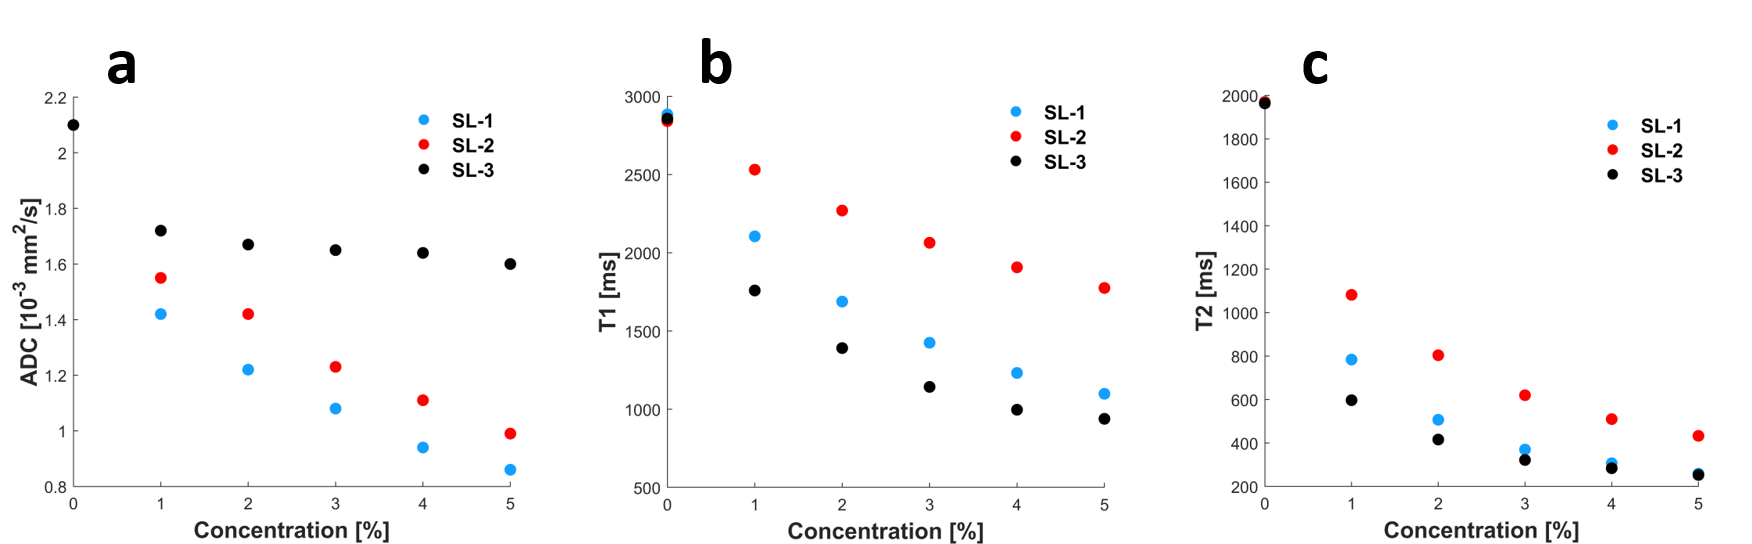
Calculated ADC, T1 and T2 maps (exemplary for SL-2) are shown in Figure 1. Table 2 summarizes the quantitative ADC-, T1- and, T2 values of water as a function of the concentration of dissolved soy lecithin for SL-1, SL-2 and SL-3. All three types of soy lecithin had a different influence on the MR properties (ADC, T1, T2) of water (Figure 2 a-c). The data for SL-3 is particularly striking: while a strong decrease typical for lecithin was observed for T1 and T2, SL-3 appears to have a comparatively small influence on the ADC. With SL-1, on the other hand, all three parameters decreased significantly with increasing concentration. SL-2 influenced the ADC in a similar way to SL-1, but showed a significantly lower influence on the relaxation times. This could be advantageous for the construction of diffusion phantoms, as the ADC value can be adjusted by lecithin without strongly influencing other parameters, such as the relaxation times.Discussion and Conclusion
This work shows that the MR properties of soy lecithin solutions might differ considerably between different product sources. While SL-1 and SL-2 appear to be advantageous substances for the production of diffusion phantoms, this is not the case for SL-3. Future studies using lecithin should consider variable MR properties of soy lecithin from different product sources.Acknowledgements
No acknowledgement found.References
1. Fritz V, Martirosian P, Machann J, Thorwarth D, Schick F. Soy lecithin: A beneficial substance for adjusting the ADC in aqueous solutions to the values of biological tissues. Magn Reson Med. 2023 Apr;89(4):1674-1683.
2. Fritz V, Martirosian P, Machann J, Schick F. Soy lecithin: a phantom material for the adjustment of apparent diffusion coefficient in magnetic resonance imaging. In
Proceedings of the Annual Meeting International Society for Magnetic Resonance
in Medicine (ISMRM), 2022.
3. Fritz V, Martirosian P, Machann J, Daniels R, Schick F. A comparison of emulsifiers for the formation of oil-in-water emulsions: stability of the emulsions within 9 h after production and MR signal properties. MAGMA. 2022 Jun;35(3):401-410.
Figures