4946
B1 SHIM CALIBRATION USING 1D ENCODED B1 DATA1Canon Medical Research USA, Mayfield, OH, United States
Synopsis
Keywords: System Imperfections, System Imperfections: Measurement & Correction, B1 shim
Motivation: To develop a method for fast per-patient calibration of B1 shim parameters.
Goal(s): To reduce scan time for per-patient B1 shimming calibration to improve patient throughput.
Approach: A key insight is that 1D projections acquired with specific projection orientations are sufficient to capture B1 distribution patterns. By comparing a pair of orthogonal B1 projections in the brain or by measuring average B1 amplitude of a pair of ROIs in a single projection across the breast, left-right B1 symmetry can be measured.
Results: Optimal B1 shim settings can be determined with a total time < 1 second as confirmed by B1 maps.
Impact: The proposed method for per-patient B1 shimming calibration using 1D B1 projections instead of 2D B1 maps can quickly calibrate B1 shimming parameters in less than one second.
INTRODUCTION
B1 shimming improves image quality, especially at B0 ≥ 3T [1]. One metric of image quality is left-right symmetry in naturally symmetric anatomies such as brain [2] and breast [1].The conventional approach to calculating per-patient B1 shimming parameters acquires a B1 map for each transmit channel [3] with scan times on the order of tens of seconds. The optimal B1 shim parameter set (gain and phase difference between the transmit channels) can be optimized to minimize ∆B1.
We propose a simple and time-efficient method to optimize per-patient B1 shim parameters based on 1D spatially encoded B1 amplitudes across a projected dimension. Such projection data can be acquired quickly on the order of hundreds of milliseconds.
METHODS
The Bloch-Siegert Shift (BSS) [4] field echo sequence with slice selection, frequency encoding along one spatial dimension (readout), and no phase encoding was used to measure the 1D projection data.The key insight of the method is that a 2D or 3D spatially encoded map is not necessary to detect symmetry in B1. The B1 projection is the average of B1 amplitude across the projected dimension at each 1D spatially encoded position. Hence, high or low regions of B1 are represented in the B1 projection data.
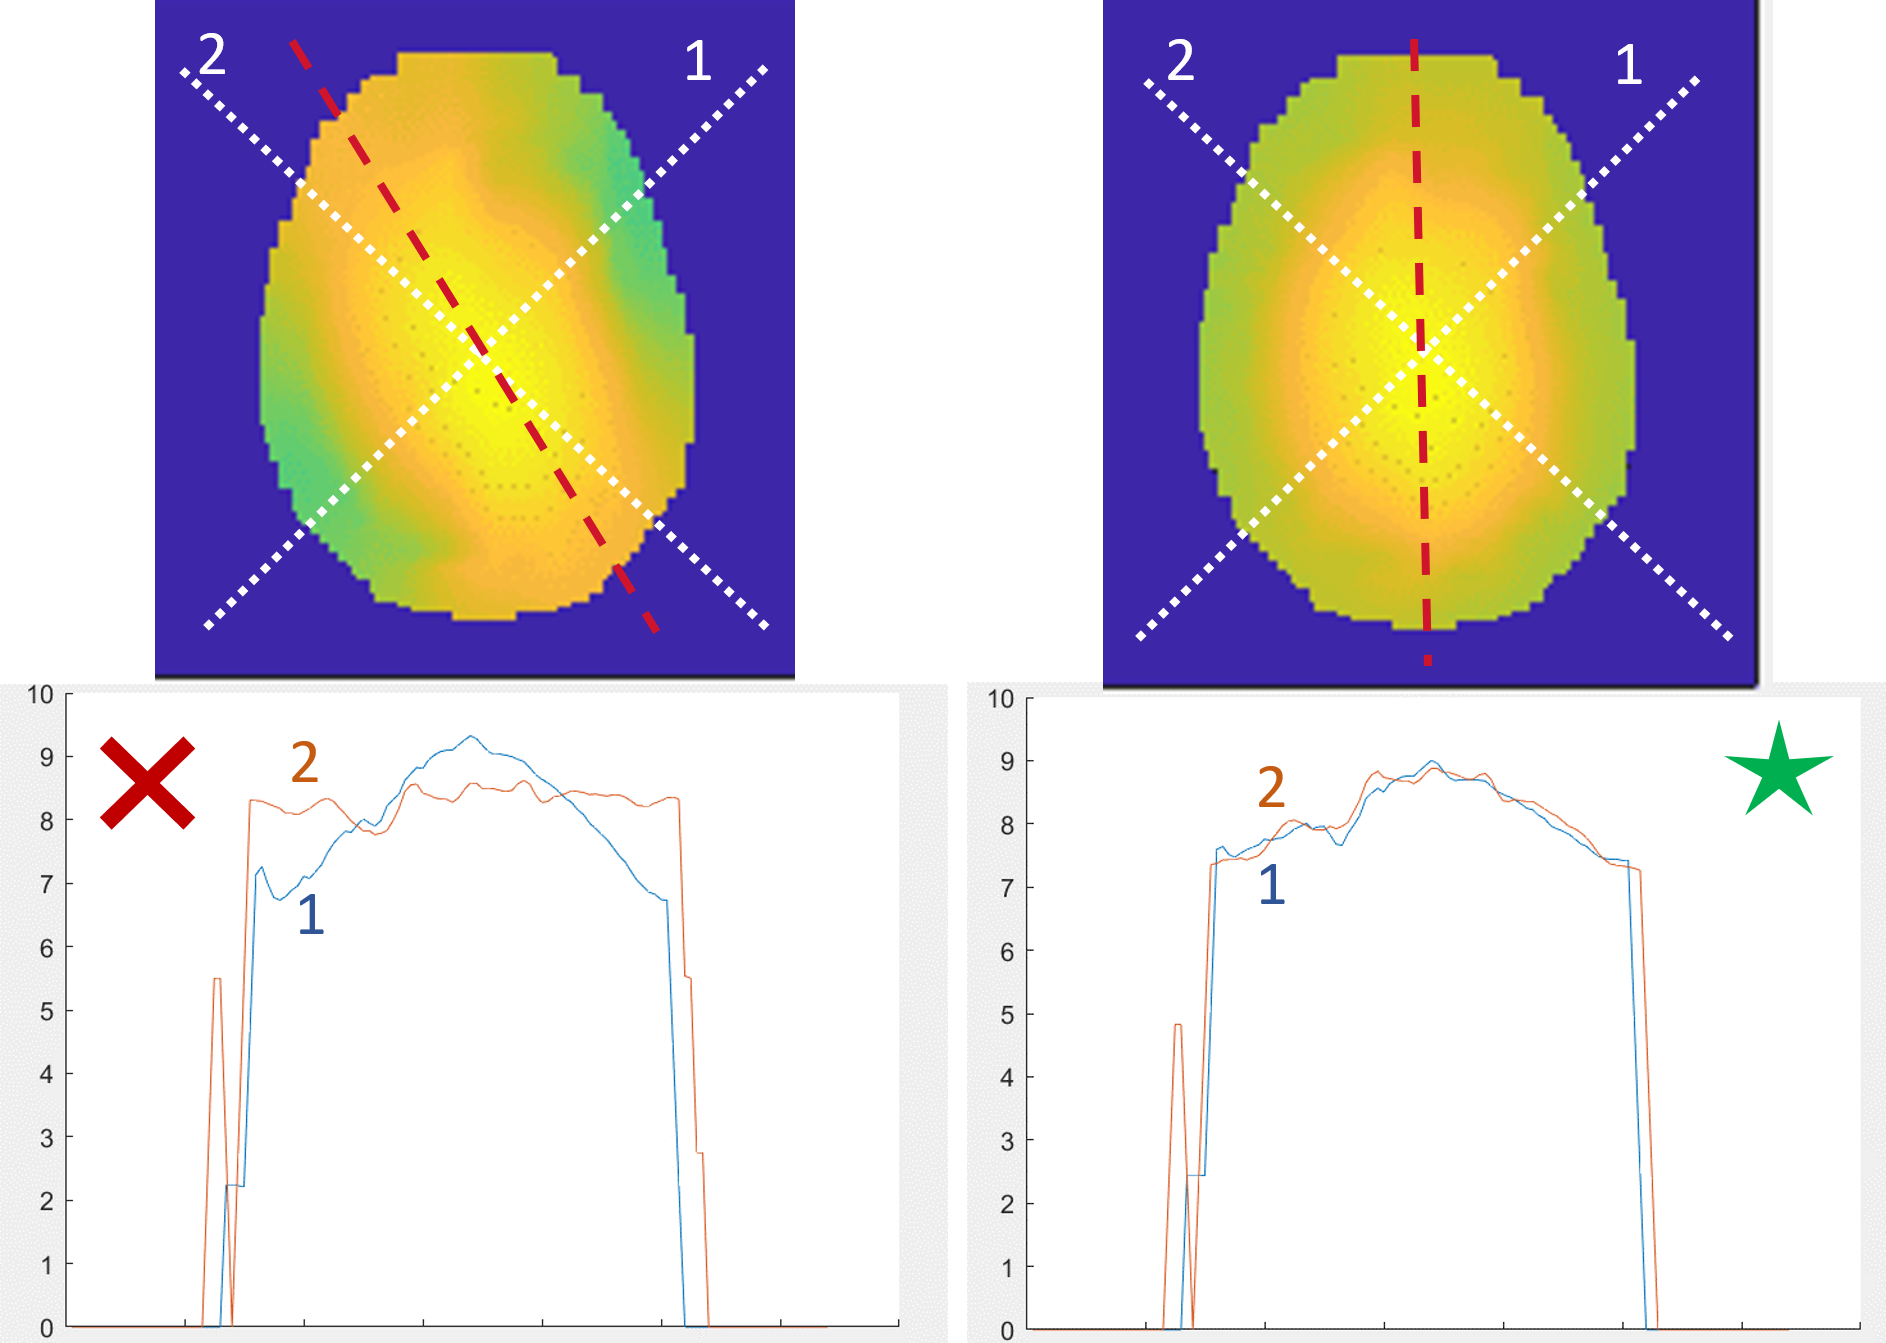
Figure 1 demonstrates the method suitable for brain. Two orthogonal B1 projections are acquired at ±45° angles. By taking the L1 difference of the B1 measurement at each spatially encoded location, we can compute an ‘asymmetry score’ for the pair (ASYMpair) (Equation 1). By repeating the scan for a set of B1 shim parameters (gain and phase), the parameters with the lowest ASYMpair score is the most symmetric, and hence its B1 shim parameters are selected to be used for subsequent image acquisitions. With a TR = 30ms, each B1 shim set can be tested in 120ms. Thus, we can test five B1 shim sets in 600ms total.
ASYMpair =100 · (∑x=0,Nmax-1 (|B12(x) - B11(x)|)) / Nmax
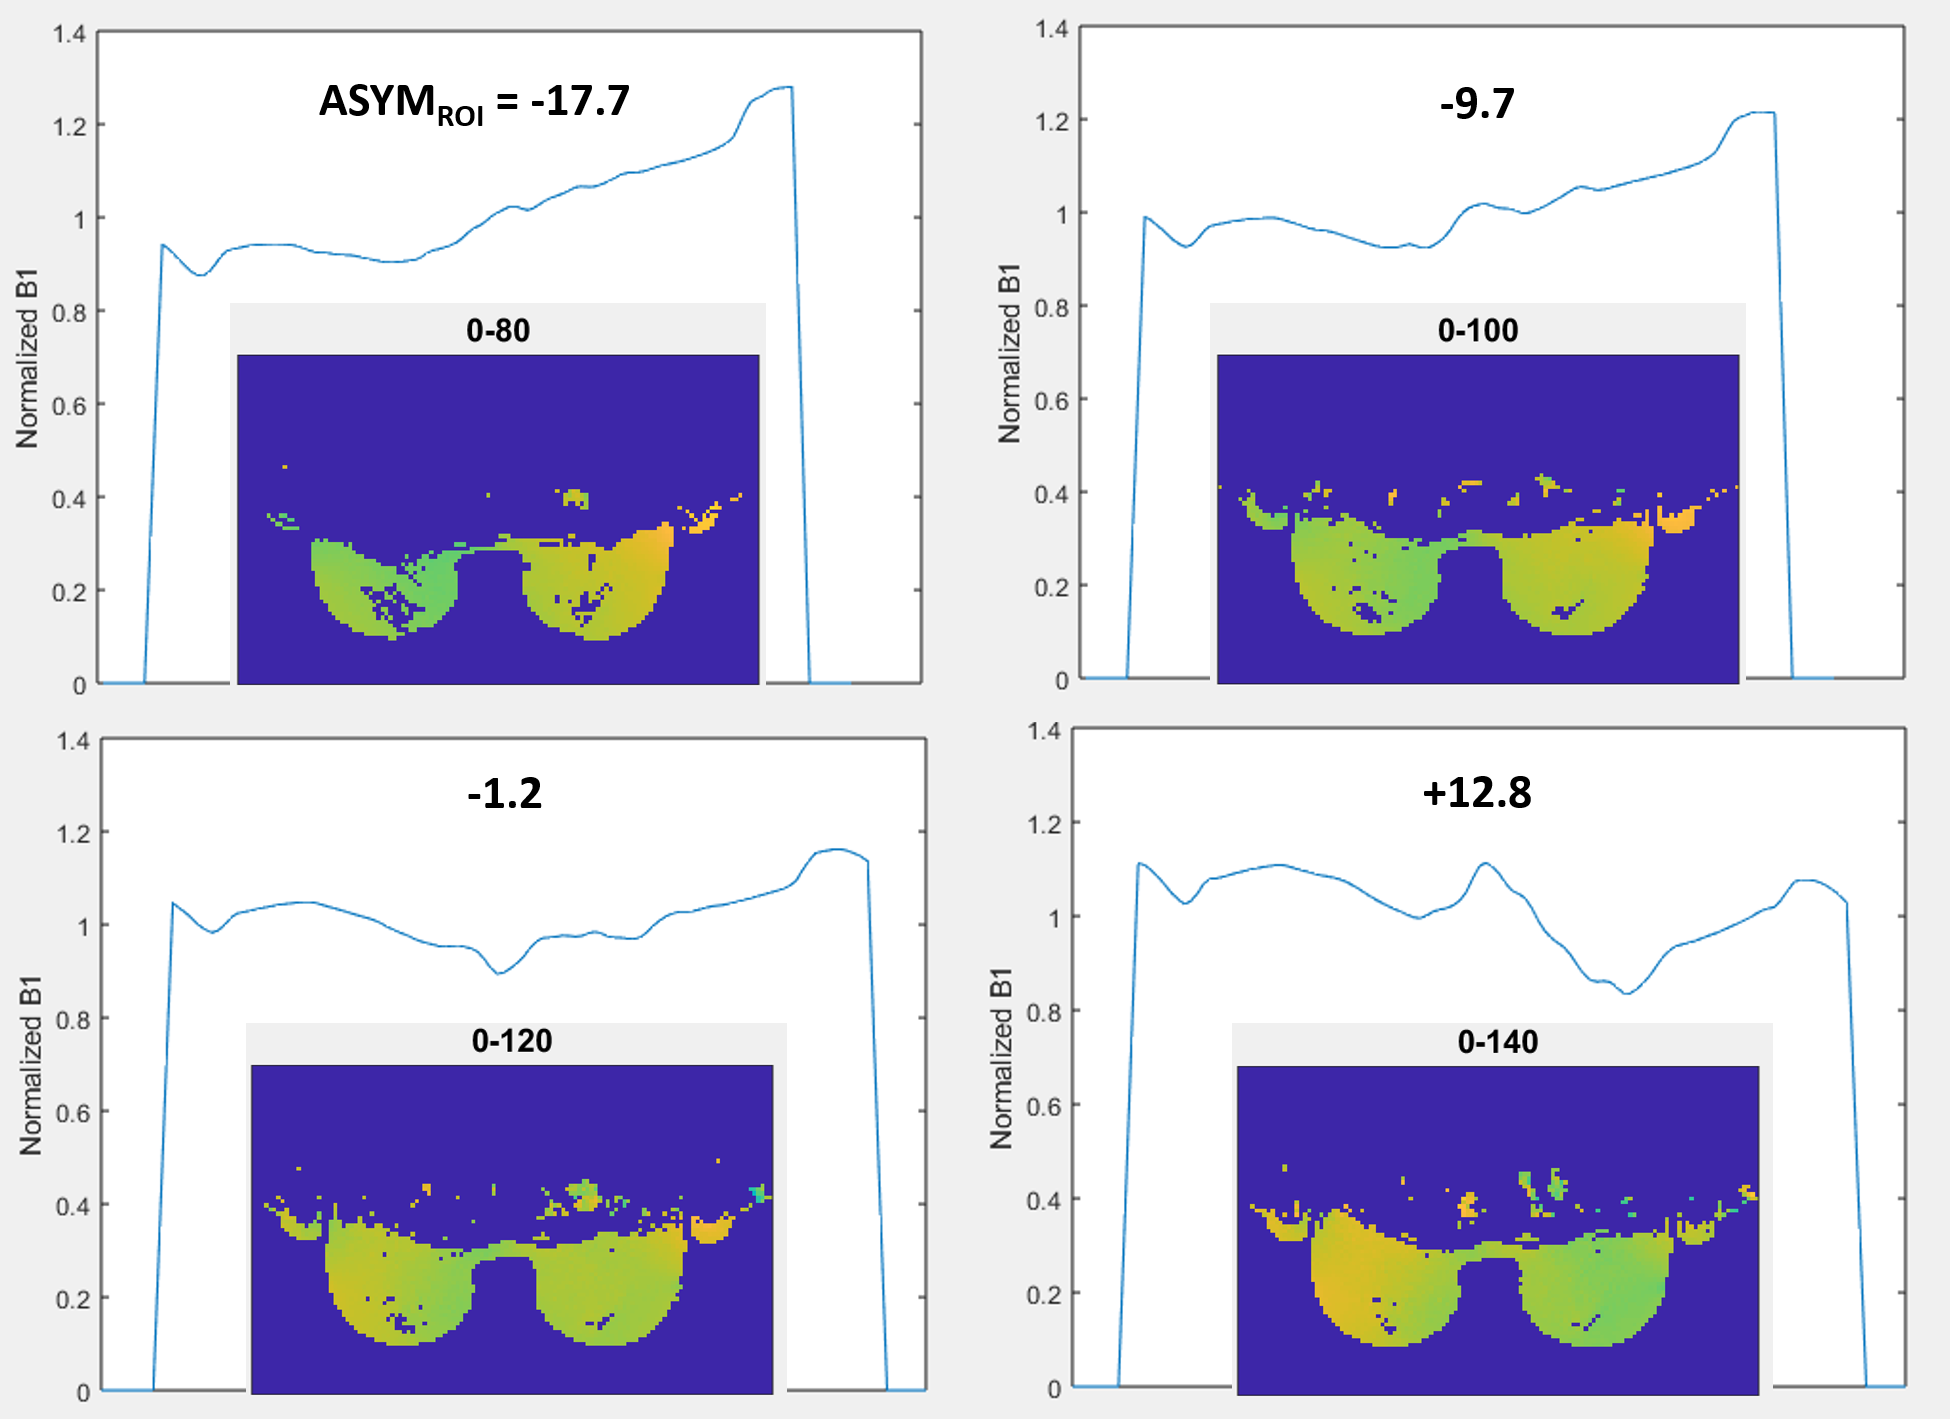
A method suitable for breast uses a single B1 projection acquired with an RL orientation to capture both breasts (Figure 2). For this application, a pencil beam spin echo sequence is preferrable to improve specificity to B1 amplitude in breast tissue. ROIs can be selected to measure B1 in the left and right breast. ROI positions can be safely determined based on the rigid geometry of most breast Rx coils. By comparing the mean B1 of the ROIs, asymmetry (ASYMROI) be calculated (Equation 2).
ASYMROI =100 · (|Left - Right|) / (Left + Right)
To demonstrate the method, B1 projection data were acquired on human volunteers under IRB approval. Brain data were acquired on a Canon Medical Systems Vantage Galan 3T scanner with a 16-channel head-neck coil. Breast data were acquired on a Canon Medical Systems Vantage Orian 1.5T scanner with an 8-channel breast coil. Both scanners are equipped with control of transmit gain and phase on two independent transmit channels.
Each B1 projection consisted of 128 spatially encoded samples. As a reference, 2D B1 maps were acquired using a field echo BSS sequence with 128 x 128 matrix. Both projections and 2D maps were repeated for sets of B1 shim parameters.
Asymmetry measurements for the B1 maps of the brain and breast were generated by manual placement of symmetrically positioned ROI boxes and calculated using Equation 2.
RESULTS
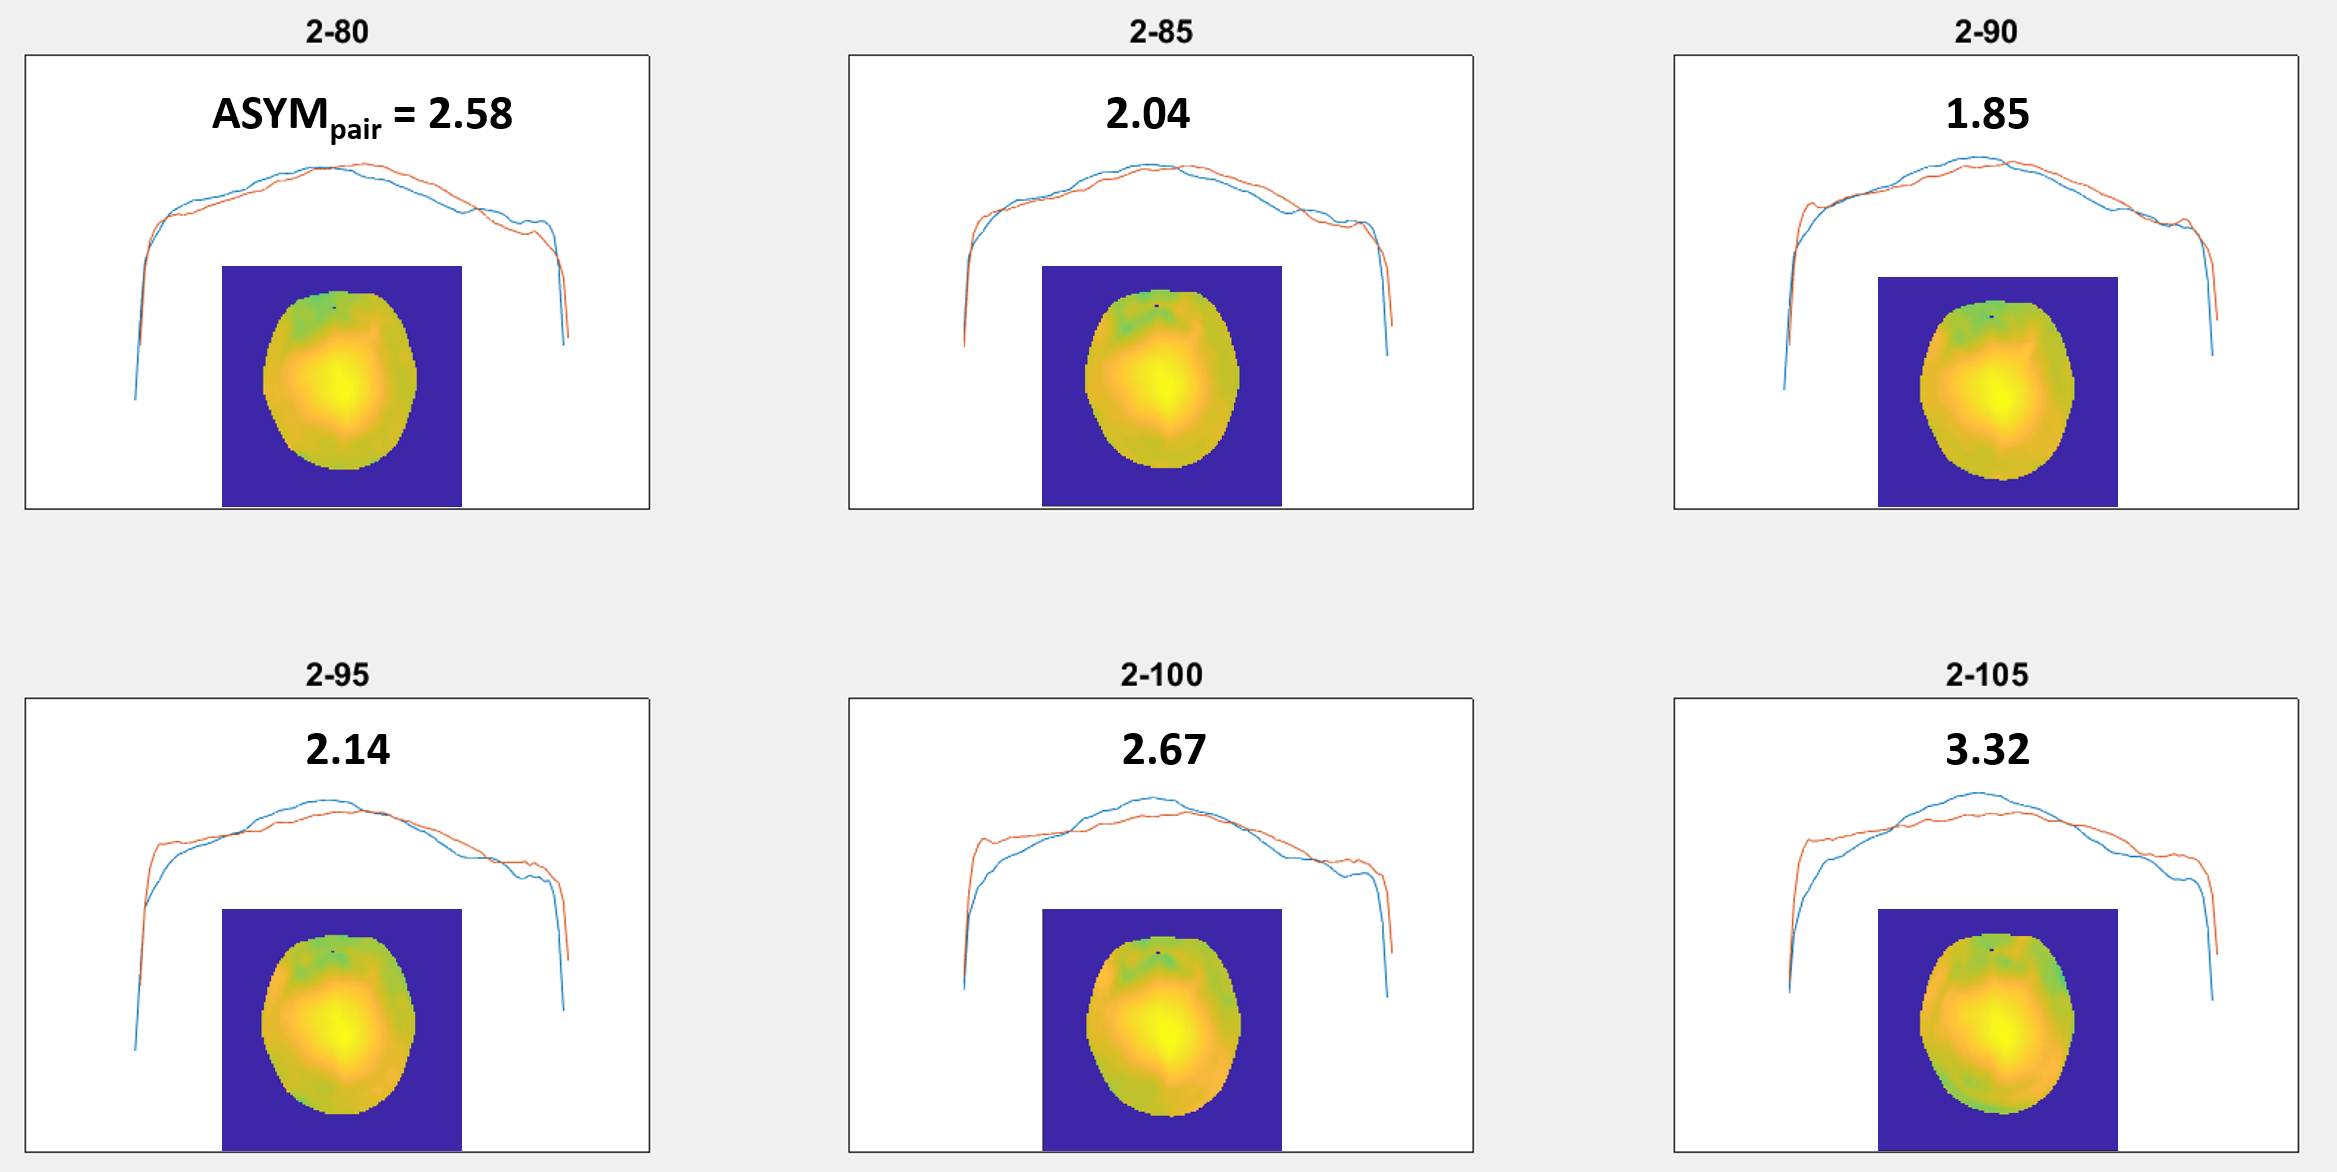
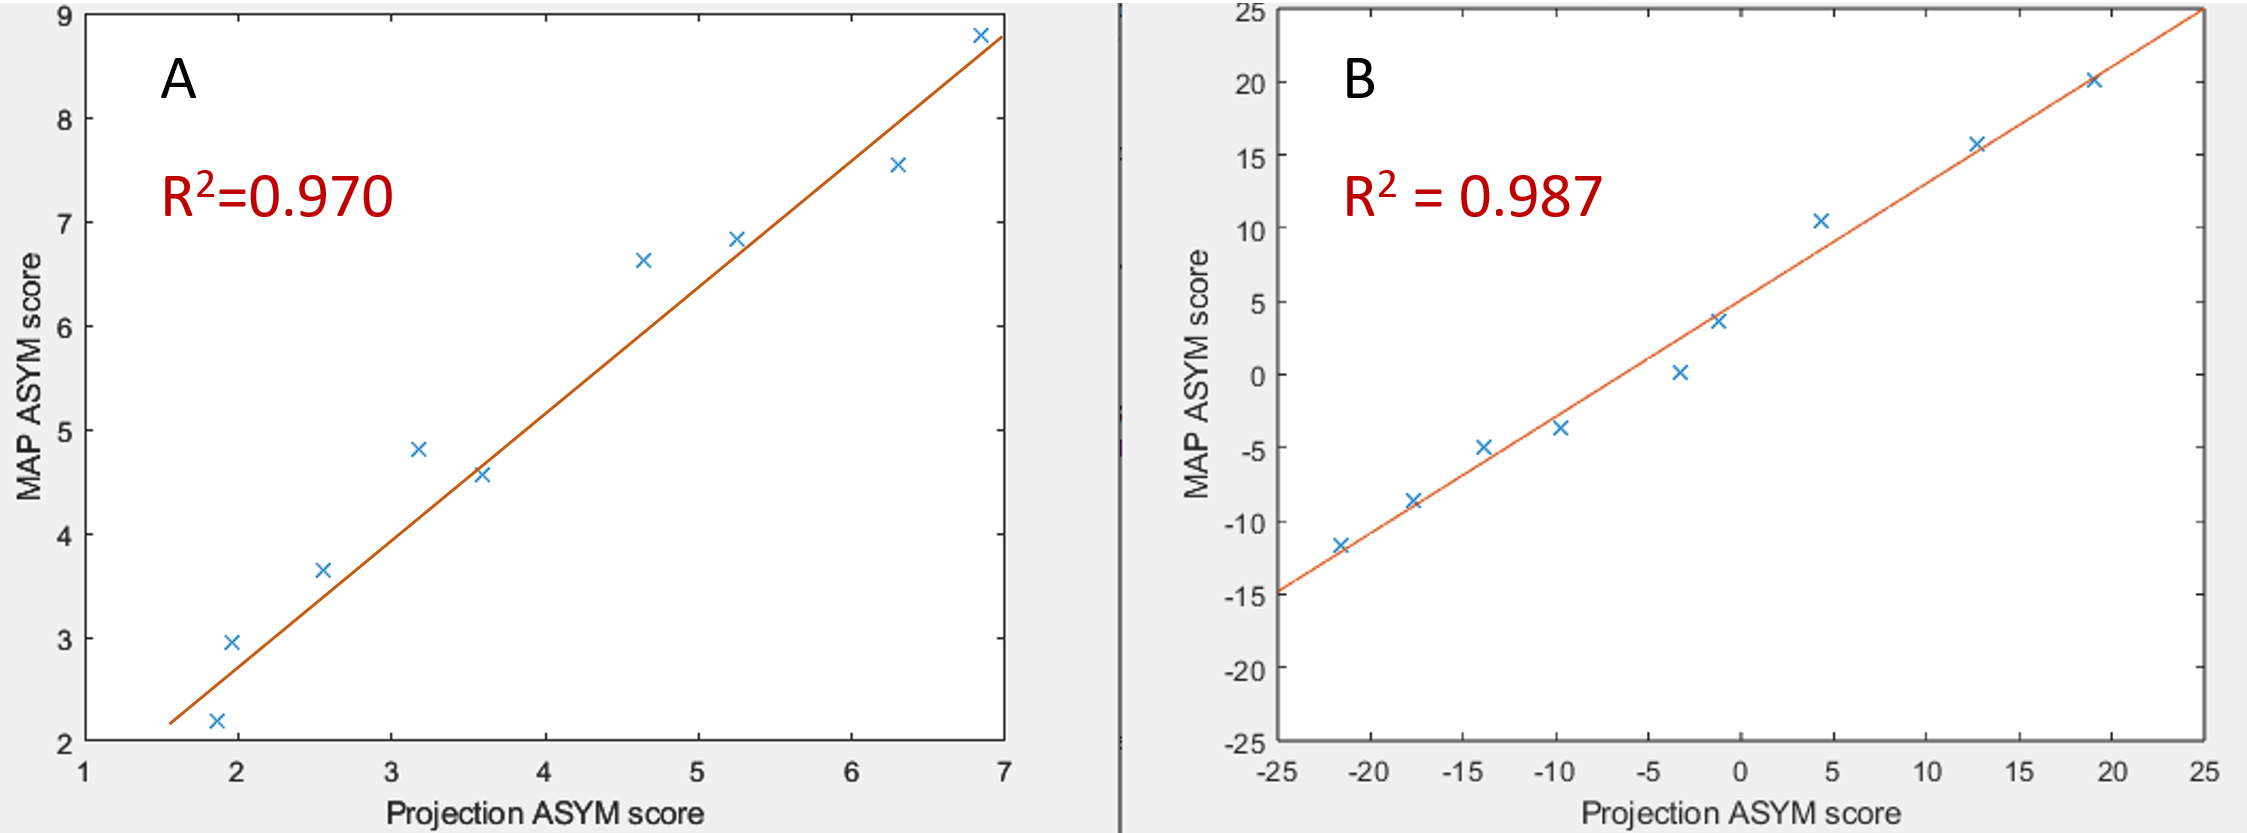
Figure 3 shows the comparison of the pair of B1 projections and 2D B1 map for six B1 shim sets (gain-phase, e.g. +2dB-80°). ASYMpair scores for the projections are overlaid. Measures of asymmetry by the B1 map method and the proposed projection method are highly correlated (R2 = 0.970) (Figure 4A). Similar to the brain, measurements of asymmetry in the breast using B1 maps and B1 projections was highly correlated (R2 = 0.987) (Figure 4B). Visual inspection of the breast B1 maps confirms accuracy of the asymmetry scores (Figure 5).DISCUSSION
This proof-of-concept study demonstrates the ability of 1D projections to discern ∆B1 amplitude distributions. By spatially encoding only one dimension, a substantial speed up in acquisition time is possible thus enabling a fast prescan per patient.For simple B1 distribution patterns, such as those observed in the brain at 3T and breast at 1.5T, the projection-based method is sufficiently accurate to detect the optimal B1 shim set. However, it is unknown if this method will perform equally well at higher B0 fields where B1 distribution patterns are more complex (e.g. 7T).
CONCLUSION
The proposed method for B1 shim adjustment offers a fast and accurate method to improve B1 symmetry which can help to improve IQ.Acknowledgements
No acknowledgement found.References
1. Brink WM, Gulani V, Webb AG. JMRI 2015; 42: 855-868
2. Arani A, Schwarz CG, Wiste HJ, et al. JMRI 2022; 56: 917-927
3. Boernert P, Koken P, Nehrke K, et al. US patent 8,736,265. 2014
4. Sacolick LI, Wiesinger F, Hancu I, Vogel MW. MRM 2010; 63: 1315-1322
Figures