4940
Needle Artifact Prediction by Modeling Dephasing in MR-Guided Interventions1Siemens Healthcare GmbH, Erlangen, Germany, 2Faculty of Physics and Astronomy, Ruprecht-Karls-Universität Heidelberg, Heidelberg, Germany, 3Siemens Medical Solutions USA Inc, Malvern, PA, United States, 4Medical Physics in Radiology, German Cancer Research Center (DKFZ), Heidelberg, Germany, 5Faculty of Medicine, Ruprecht-Karls-Universität Heidelberg, Heidelberg, Germany
Synopsis
Keywords: MR-Guided Interventions, MR-Guided Interventions, needle artifact, device artifact, needle intervention, percutaneous intervention, modelling
Motivation: MR-guided needle interventions benefit from prior knowledge of needle artifact size and shape, as the artifact is important for instrument visualization and localization.
Goal(s): To investigate an analytical model for the dephasing artifact of a 20-gauge aspiration needle in GRE imaging based on material and imaging parameters.
Approach: Model accuracy was evaluated in-vitro for B0 = 0.55T/1.5T/3T, res = (1mm)3/(2mm)3 and TE = 5ms/15ms/25ms using Dice score (DSC) and Hausdorff distance (dH) as metrics.
Results: For isotropic voxel grids, the dephasing needle artifact could be well approximated by the model (DSC ≥ 86%, dH ≤ 2 voxels).
Impact: The approximation of needle artifacts using an analytical model provides an instructive way for artifact size prediction and can potentially facilitate MR-guided intervention planning (e.g., the choice of imaging parameters, needle selection and system selection).
Introduction
MR-guided percutaneous needle interventions typically use the intrinsic needle artifact for instrument visualization and localization.1,2 The needle locally distorts the magnetic field, which introduces a shift in proton resonance frequency and leads to two effects3,4: 1) a spatial shift in reconstruction of signal and 2) intra-voxel dephasing of magnetization that leads to signal drop. In spin-echo imaging, only the first effect plays a role in artifact formation, as dephased magnetization is refocused by the 180° pulse. In contrast, GRE-based imaging techniques, e.g., FLASH, are also affected by the latter effect. Previous work has investigated GRE needle artifacts using simulations and measurements.5-9 In this work, we investigated an analytical model to approximate the dephasing artifact of the needle shaft in GRE imaging.Methods
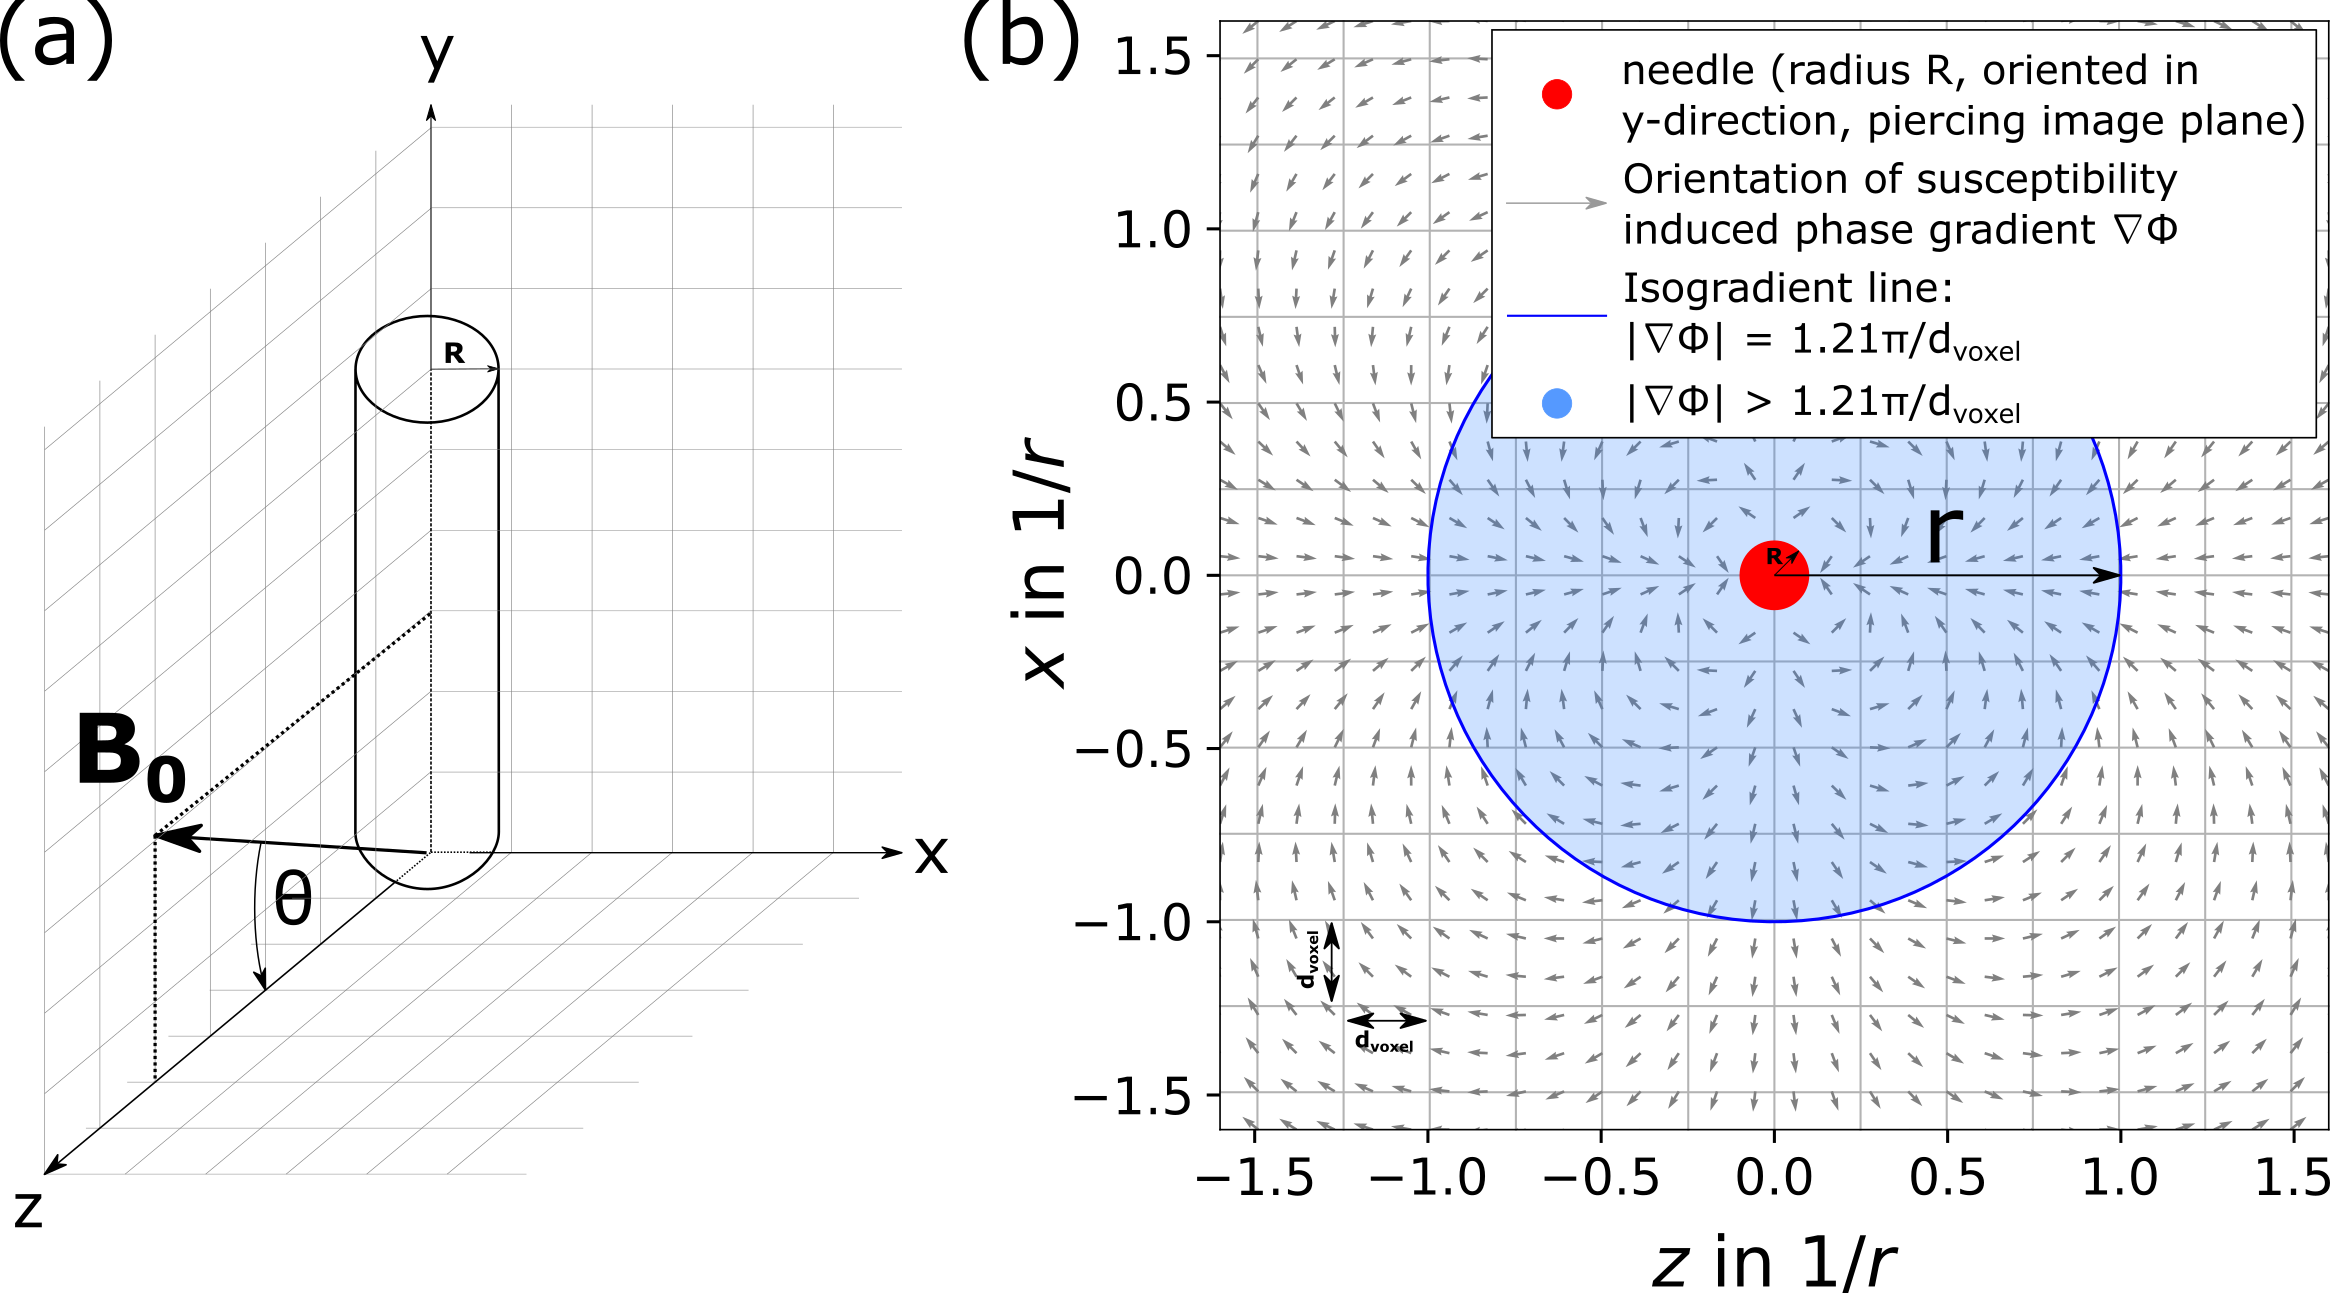
We model the needle as an infinite metallic cylinder, oriented along the y-axis of a right-handed coordinate system (Figure 1a).3 The needle induces a change ΔBsusc in magnetic field:$$\Delta B_{\text{susc}}(x,z) = B_0 R^2 \frac{\left(\chi_e-\chi_i\right)}{2} sin^2(\theta) \times \left(\frac{x^2-z^2}{ (x^2+z^2)^2 }\right)$$
with B0: magnetic field strength; R: needle radius; χi: needle magnetic susceptibility; χe: surrounding tissue magnetic susceptibility; θ: angle between needle and B0 field. The local change in magnetic field induces a spatial phase gradient $$$\vec{\nabla}\phi$$$ in local magnetization (Figure 1b) at echo time TE with magnitude:
$$\left| \vec{\nabla}\phi \right| = \gamma \text{ TE } \left| \vec{\nabla}(\Delta B_{susc}) \right| = \gamma \text{ TE } B_0 R^2 (\chi_e - \chi_i) \sin^2{\theta} \times \sqrt{\frac{1}{(x^2 + z^2)^3}}$$
with γ: gyromagnetic ratio. From Eq. 2, the local gradient magnitude can be seen to decay radially (circular gradient magnitude isolines in xz-plane).10 For the limit of small voxels, we can locally linearize the gradient around the voxel center $$$\vec{x_0}$$$. The signal magnitude across one isotropic voxel (assuming the gradient to be oriented along one of the voxel’s main axes with voxel edge length dvoxel) is then given by11:
$$|S_{\text{voxel}}(\vec{x_0})| = S_{\text{BG}} * \left| \int_{0}^{d_{\text{voxel}}} e^{-i |\vec{\nabla}\phi(\vec{x_0})| x } \text{d}x \right| = S_{\text{BG}} * \text{ sinc}(\frac{|\vec{\nabla}\phi(\vec{x_0})| * d_{\text{voxel}}}{2} ) $$
with SBG: non-dephased background signal. To distinguish dark artifact voxels from the bright background (SBG), we set a threshold of $$$S_{\text{artifact}} < 50\% * S_{\text{BG}}$$$. We numerically solve Eq. 3 for the gradient magnitude $$$|\vec{\nabla}\phi|(S_{\text{voxel}} = 50\% * S_{\text{BG}}) = \frac{1.21\pi}{d_{\text{voxel}}}$$$ and calculate the radius $$$r = \sqrt{x^2 + z^2}$$$ of the corresponding gradient magnitude isoline with Eq. 2 as12:
$$r = \sqrt[3]{\frac{\sin^2{(\theta)} \text{ TE } \gamma B_0 R^2 \left(\chi_e-\chi_i\right)\,d_{\text{voxel}} }{1.21\pi}}$$
The dephasing artifact therefore consists of voxels with a distance of less than r to the needle shaft.
As shown by Eq. 1, the magnetic field distortion only extends orthogonally to the needle shaft. Therefore, by choosing the frequency-encoding gradient direction parallel to the needle shaft, shifts in signal reconstruction due to spatial frequency mismatch can be avoided and the needle shaft artifact is characterized by the dephasing effect only.
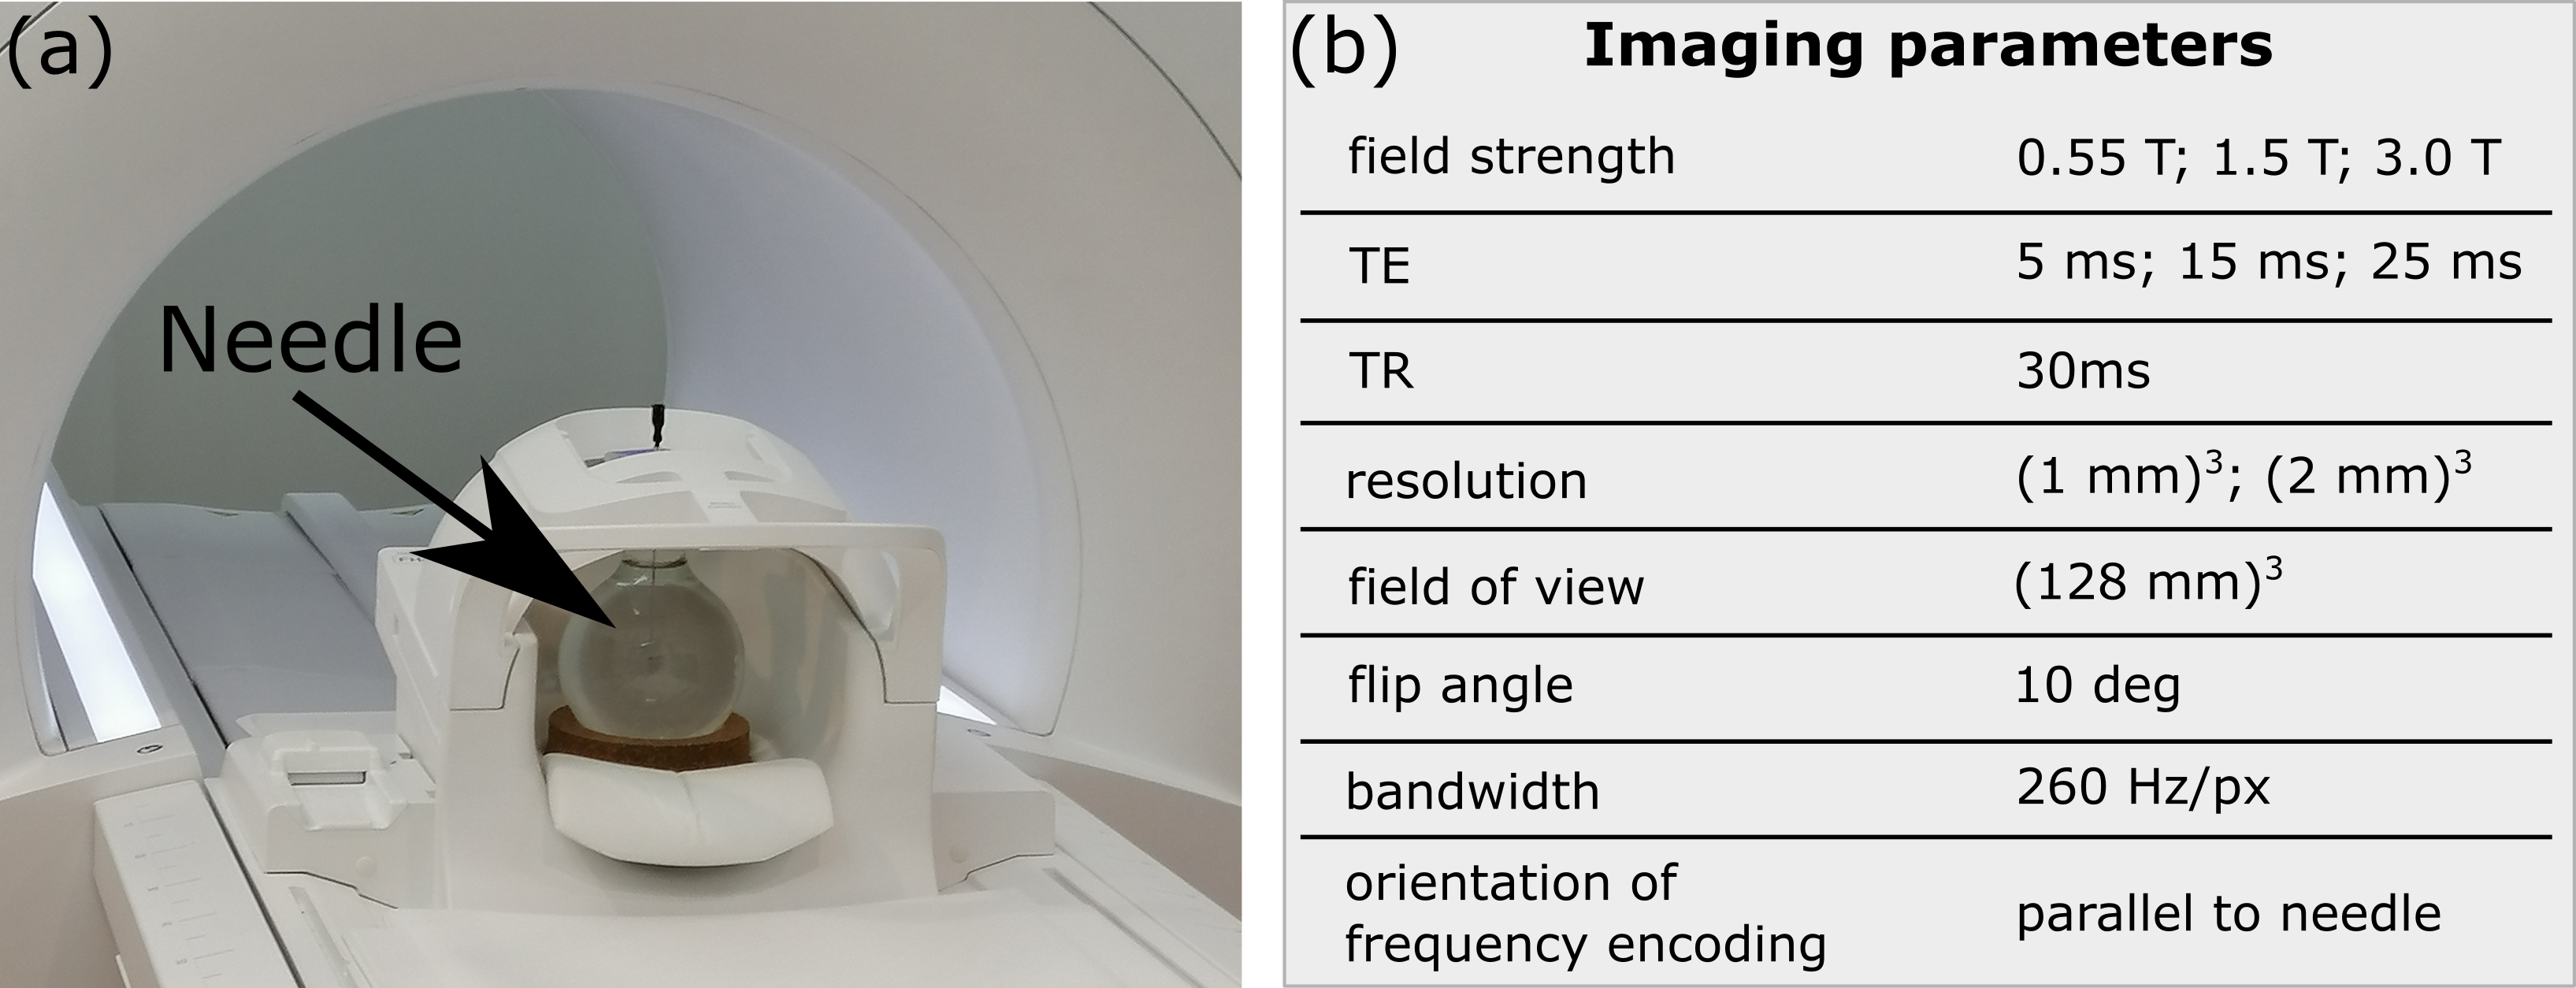
To evaluate how well a disk with radius r, as given in Eq. 4, can approximate the dephasing artifact of a needle, we acquired images of an in-vitro phantom and calculated Dice similarity coefficients (DSC) and Hausdorff distances (dH), i.e., the maximum deviation of the true artifact from the model, for a set of imaging parameters (Fig. 2).
Results
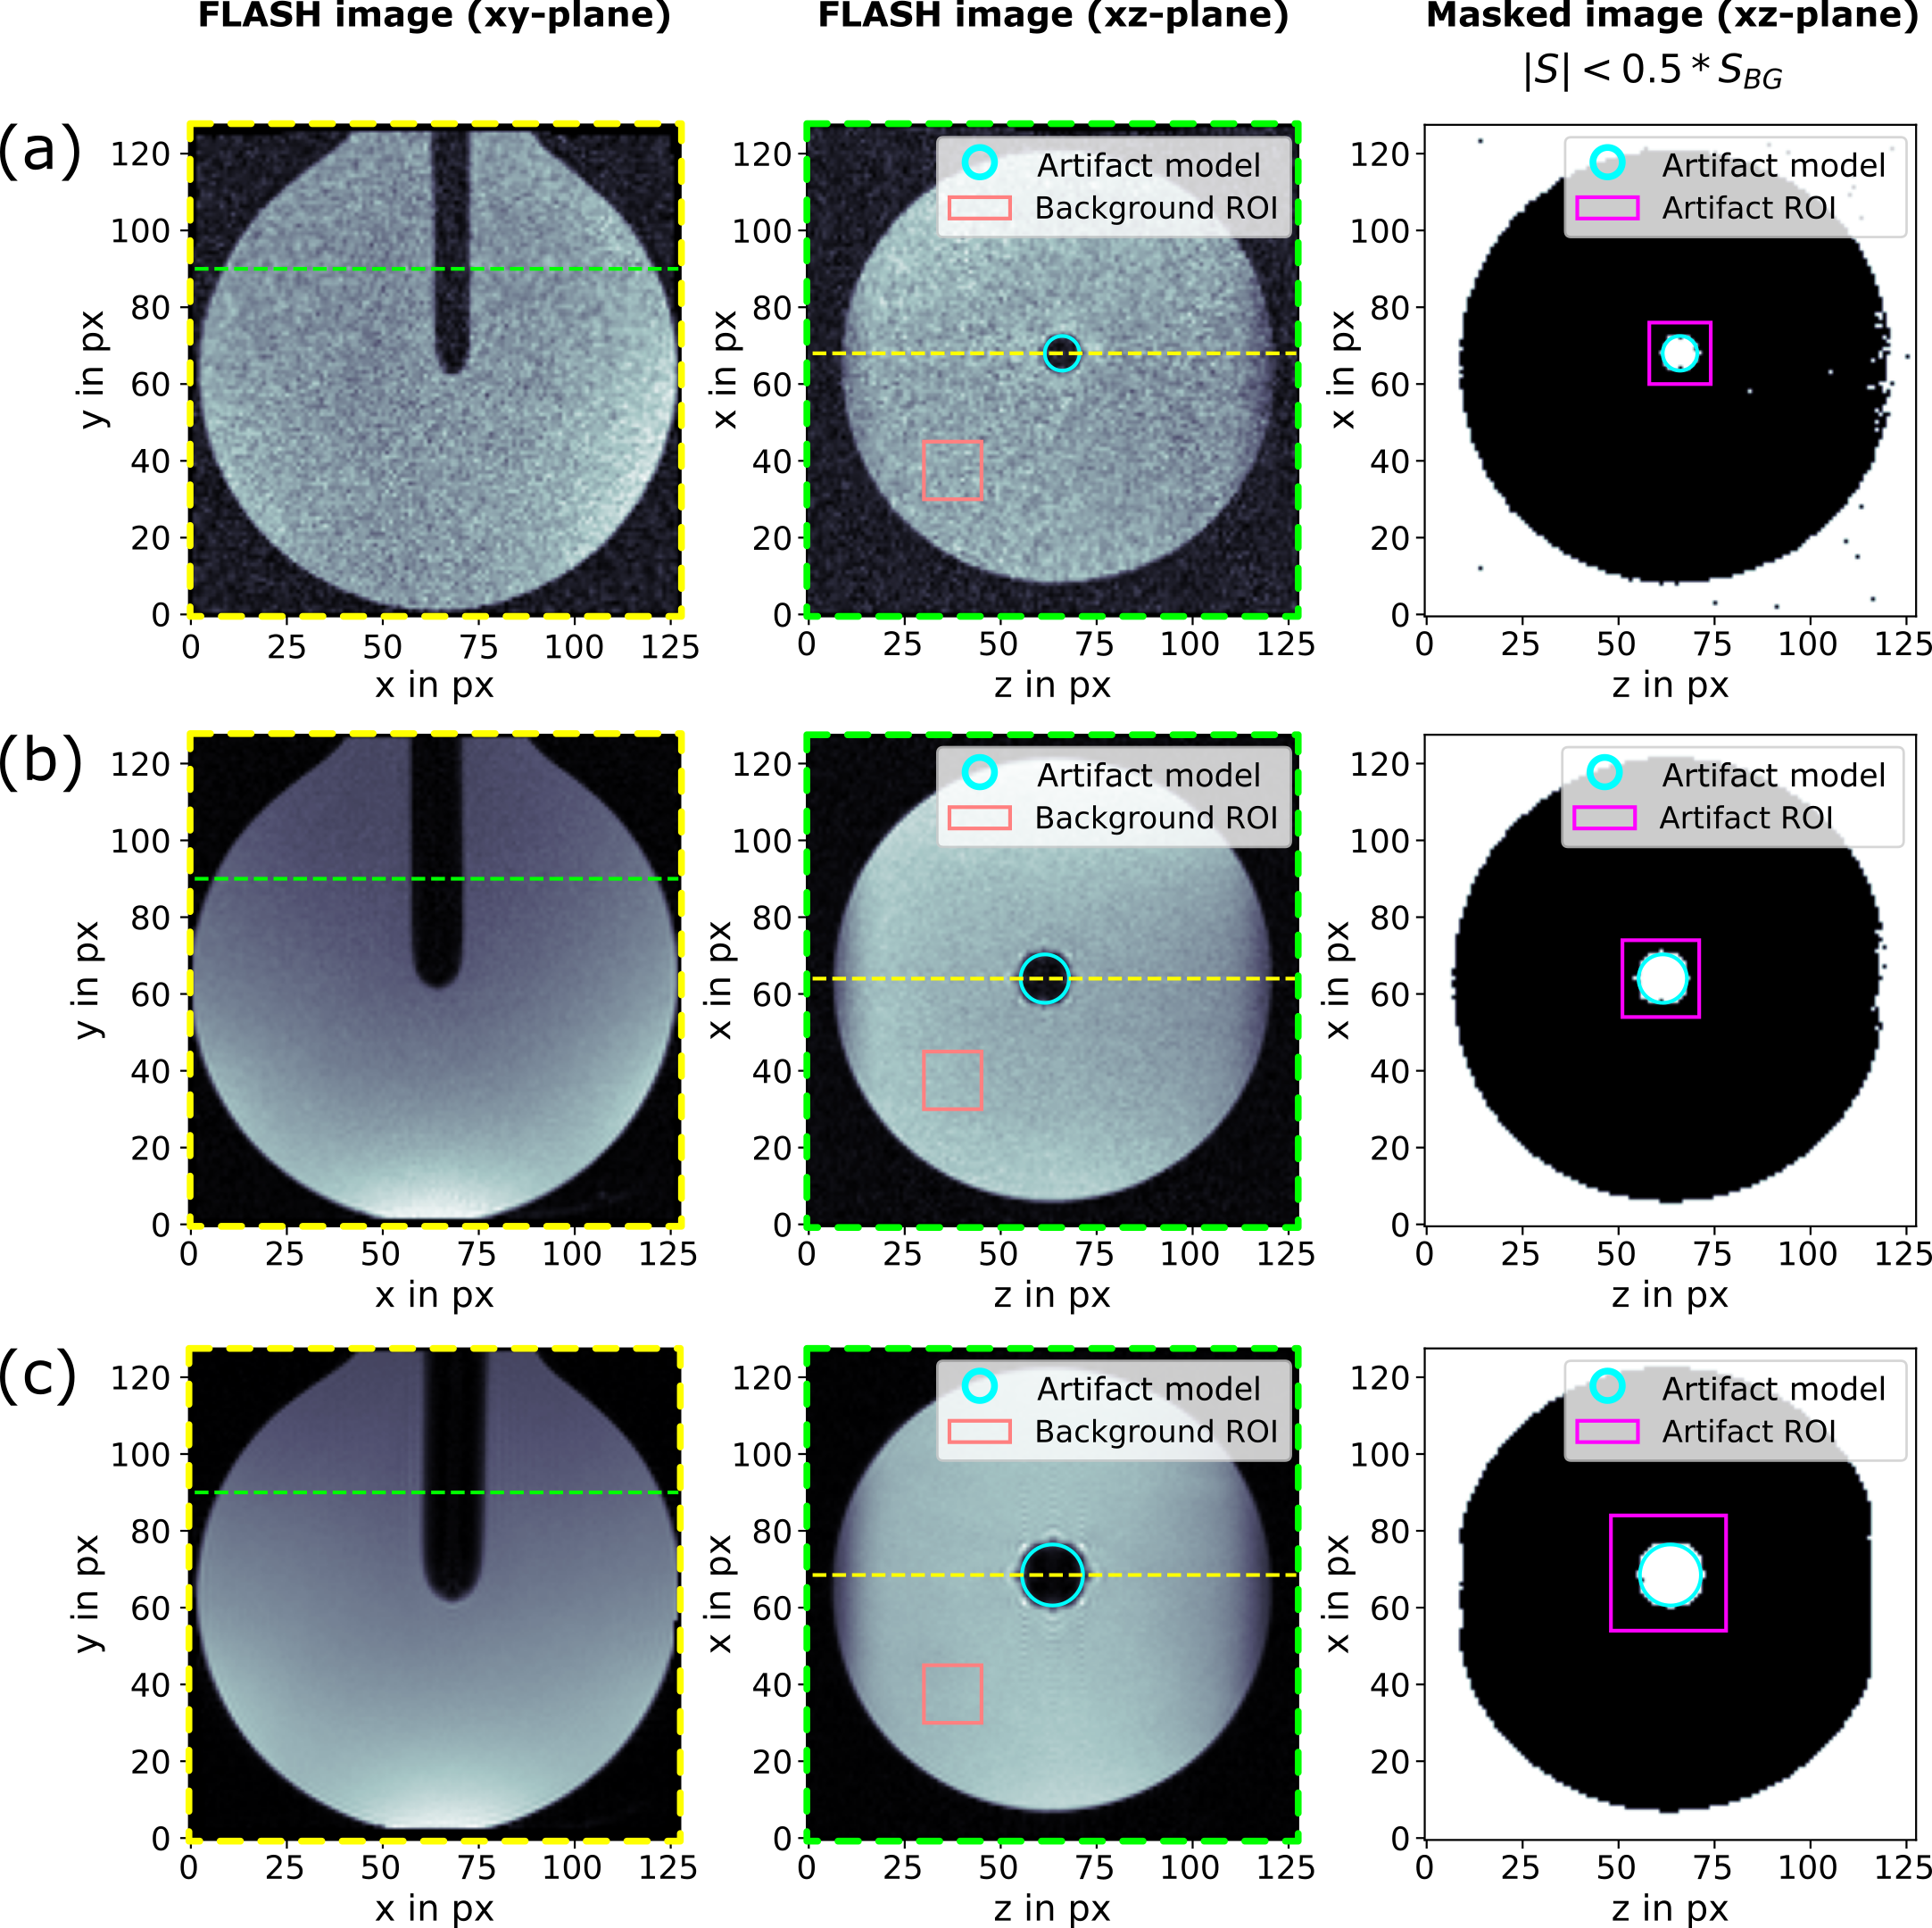
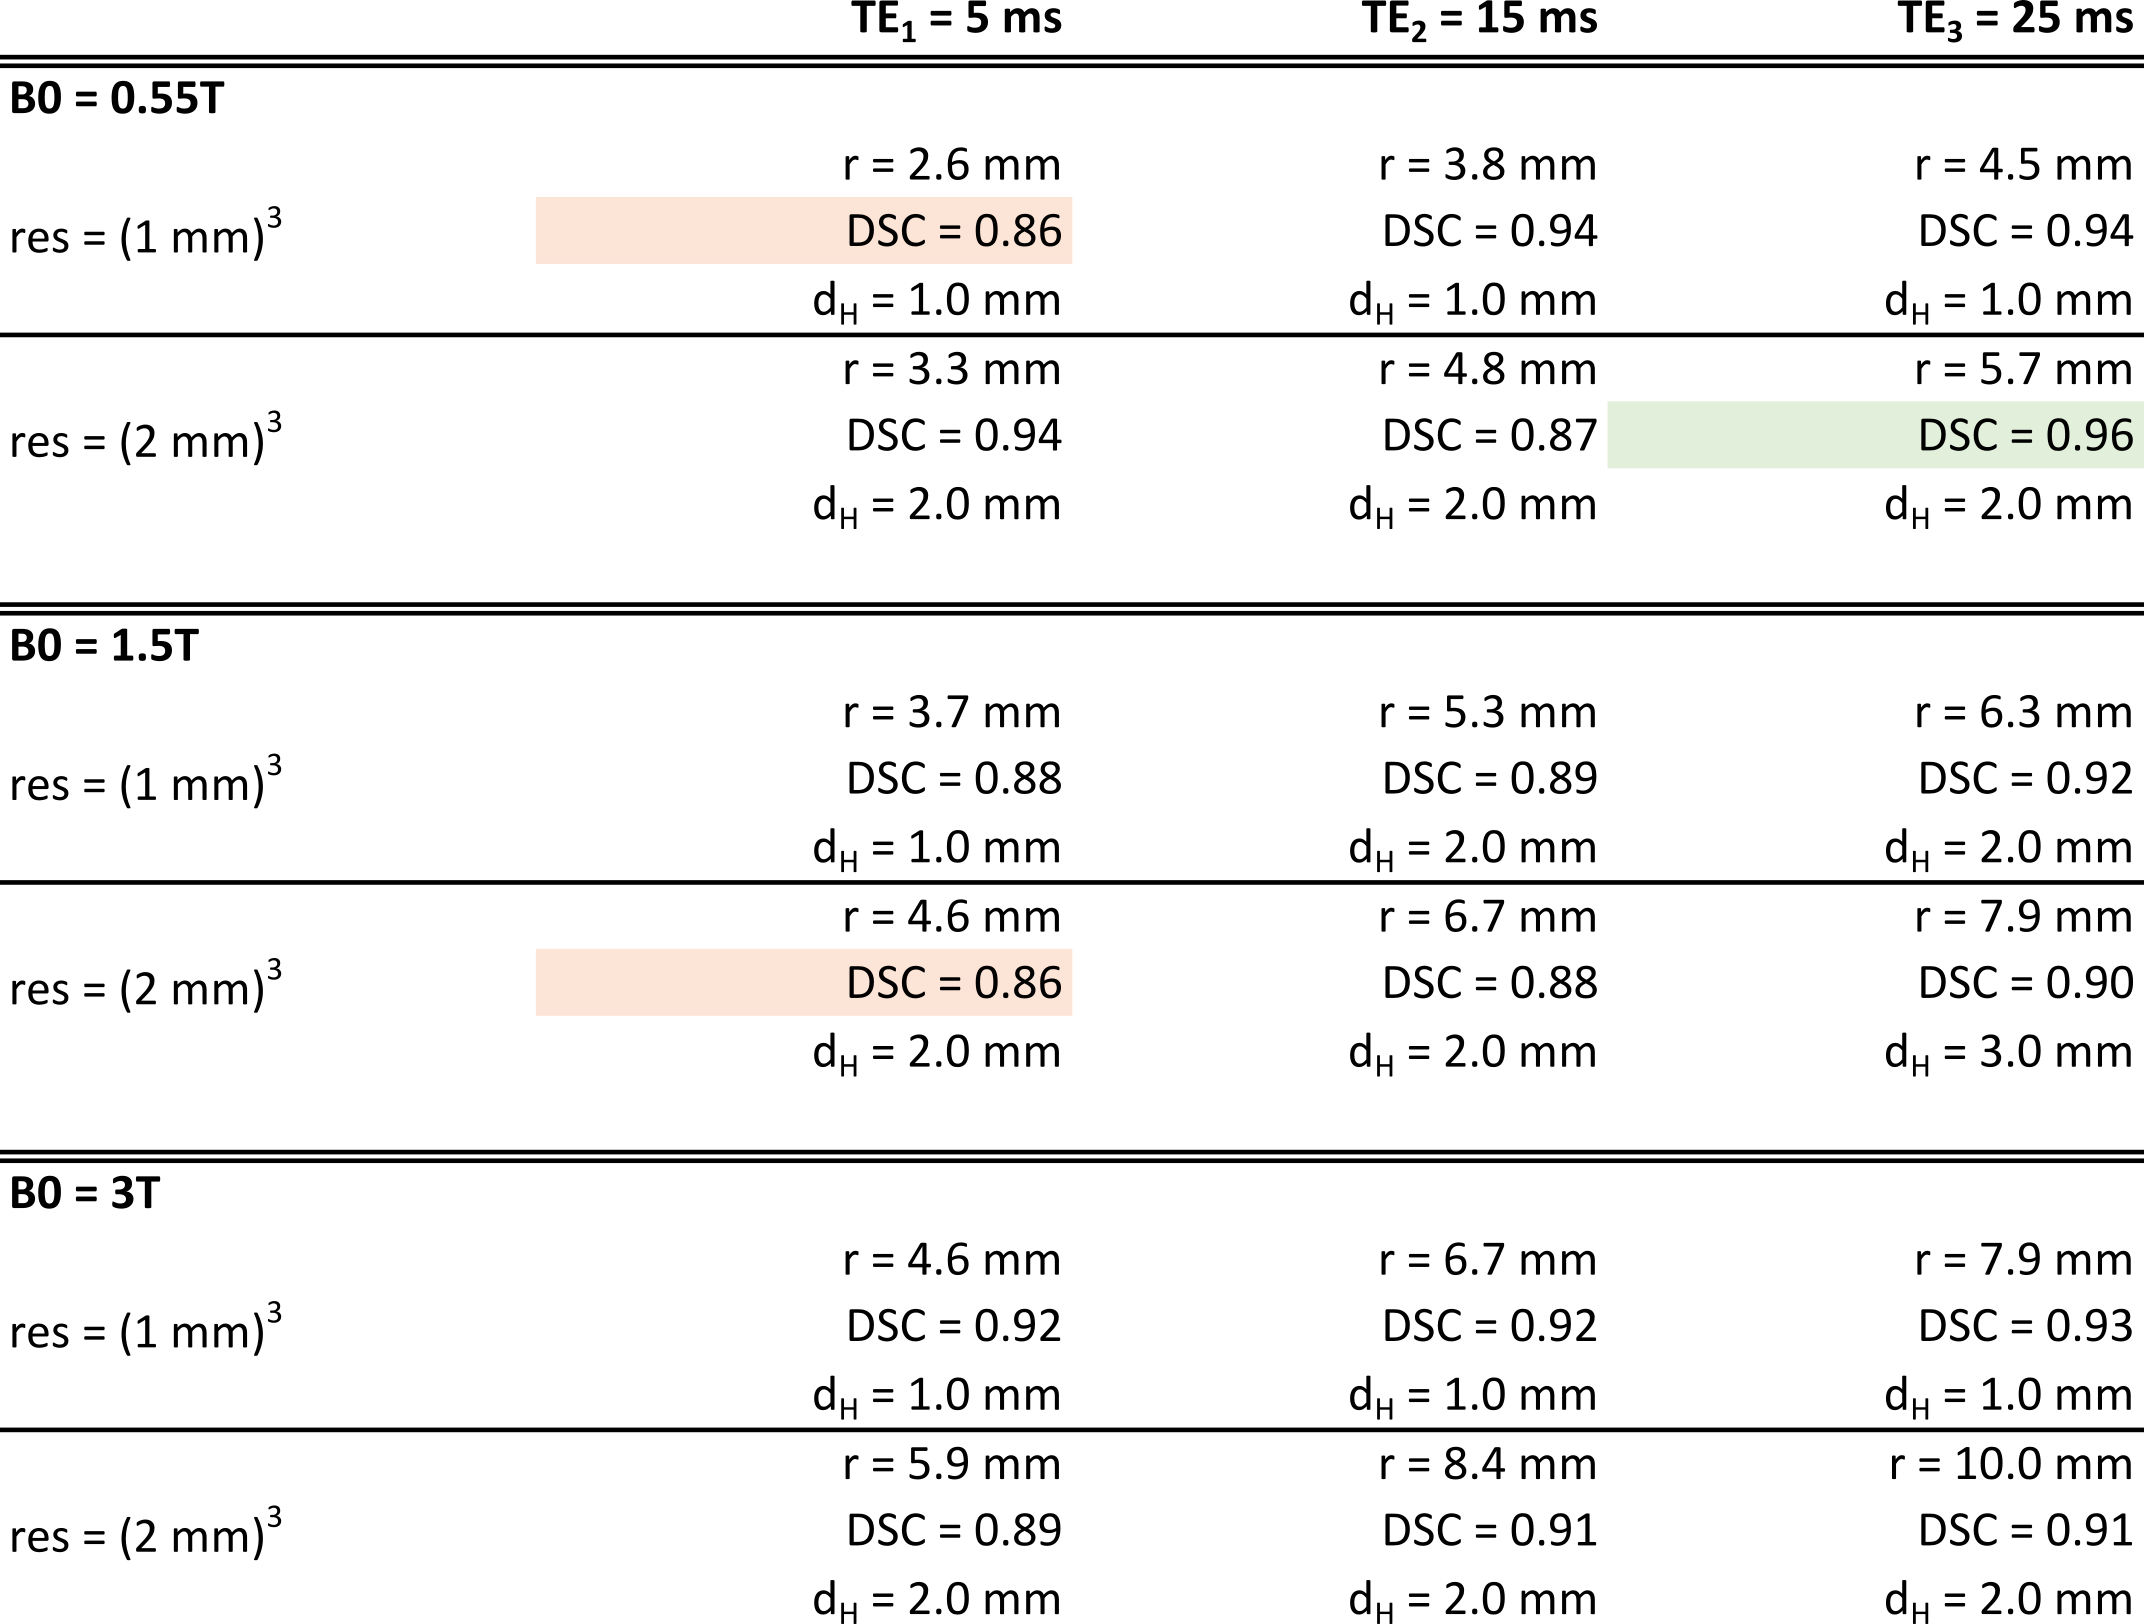
Figure 3 shows three examples from the set of acquired images. The model visually matches well with the needle artifact. Figure 4 shows DSC and dH for all investigated imaging parameters. Dice scores were not below 86% for all investigated cases and we found dH to be mostly on the order of one voxel length.Discussion
In this work, we investigated a simple analytical model for predicting needle artifact appearance in GRE imaging, and observed good correspondence between the theoretical and experimental results. There are several limitations that will be addressed in future work. First, investigations were limited to an isotropic voxel grid. In MR-guided interventions, these conditions might not be met, making a more complex analytical or numerical treatment necessary. Second, if frequency-encoding direction is not aligned with the needle shaft, signal shifts due to spatial frequency mismatch must additionally be considered. A high receiver bandwidth can also reduce potential spatial signal mismatch.Conclusion
The presented investigation allows a straight-forward prediction of a needle dephasing artifact for a given set of imaging parameters. The analysis, therefore, provides an intuitive understanding of the artifact formation and might, e.g., be used to guide needle intervention planning5 (e.g., choice of needle type and imaging parameters at a given field strength).Acknowledgements
The authors thank Dr. Jesse Roll of Cook Advanced Technologies for providing the needle.References
- Veltri et al. CIRSE Guidelines on Percutaneous Needle Biopsy (PNB). Cardiovasc Intervent Radiol. 2017;40(10):1501-1513.
- Weiss et al. MR-guided biopsy: A review of current techniques and applications. J Magn Reson Imaging. 2008;27(2):311-325.
- Ladd et al. Biopsy needle susceptibility artifacts. Magn Reson Med. 1996;36(4):646-651.
- Lüdeke et al. Susceptibilty artefacts in NMR imaging. Magn Reson Imaging. 1985;3(4):329-343.
- Lewin et al. Needle localization in MR-guided biopsy and aspiration: Effects of field strength, sequence design, and magnetic field orientation. AJR Am J Roentgenol. 1996;166(6):1337-1345.
- Frahm et al. Visualization of magnetic resonance-compatible needles at 1.5 and 0.2 Tesla. Cardiovasc Intervent Radiol. 1996;19(5):335-340.
- Penzkofer et al. How MRI compatible is "MRI compatible"? A systematic comparison of artifacts caused by biopsy needles at 3.0 and 1.5 T. Cardiovasc Intervent Radiol. 2013;36(6):1646-1657.
- Schmidt et al. Artifact reduction of coaxial needles in magnetic resonance imaging‑guided abdominal interventions at 1.5 T: a phantom study. Sci Rep. 2021;11(1):22963.
- Müller-Bierl et al. Numerical simulations of intra-voxel dephasing effects and signal voids in gradient echo MR imaging using different sub-grid sizes. MAGMA. 2006;19(2):88:95.
- Posse and Aue. Susceptibility Artifacts in Spin-Echo and Gradient-Echo Imaging. J Magn Reson. 1990;88(3):473-492.
- Glowinski et al. A Perspective on Needle Artifacts in MRI: An Electromagnetic Model For Experimentally Separating Susceptibility Effects. IEEE Trans Med Imaging. 2000;19(12):1248-1252.
- Faust et al. Analytical estimation of artifact radius for an MR-compatible aspiration biopsy needle. In 6th Conference on Image-Guided Interventions (2023), Mannheim, Germany.
- Griebel et al. Magnetic Susceptibility of Common Metals and Alloys Used in Medical Devices. J Test Eval. 2023;51(6).
- Schenk et al. The role of magnetic susceptibility in magnetic resonance imaging: MRI magnetic compatibility of the first and second kinds. Med Phys. 1996;23:815-850.
Figures