4935
Simultaneous Acquisition of Temperature Mapping for Fatty and Nonfatty Biological Tissues based on Look-Locker Technique with dual echoes1Daewon University College, Jecheon, Korea, Republic of, 2Biomedical Engineering, Seoul, Korea, Republic of, 3Philips Korea, Seoul, Korea, Republic of, 4Korea Basic Science Institute, Cheongju, Korea, Republic of
Synopsis
Keywords: Thermometry/Thermotherapy, Thermometry
Motivation: Temperature errors in PRFS occur primarily in tissues containing adipose substances because fat changes its magnetic susceptibility with temperature.
Goal(s): This study aimed to simultaneously monitor the temperatures of fat and non-fat tissues using Look-Locker (LL) technique with dual echoes.
Approach: Two-point Dixon technique can be utilized to estimate the adipose components, which may aid in the separation of adipose tissue in PRFS. In addition, the method allows for a more refined Bo correction.
Results: Compared to the temperature measured by the fiber-optic sensor, the PRFS and T1-based temperatures showed a small difference of about 0.11 ~ 0.22 ℃ and 0.06 ~ 0.15 ℃, respectively.
Impact: his study yields an evidence that Look-Locker technique with dual echoes is suitable for simultaneous acquisition of temperature mapping for adipose and non-adipose tissues, providing an accurate temperature monitoring comparable to a fiber-optic sensor as well as rapid acquisition.
Introduction
Proton resonance frequency shift (PRFS) for temperature monitoring relies on electrical shielding changes of hydrogen molecules with temperature levels in aqueous tissues. However, temperature errors in PRFS occur primarily in tissues containing adipose substances because the fat changes its magnetic susceptibility with temperature changes. Two-point Dixon technique can be utilized to estimate the adipose components, which may aid in the separation of adipose tissue in PRFS1. In addition, the method allows for a more refined Bo correction2. Moreover, by utilizing T1 maps to track temperature fluctuations, thermal changes in adipose tissues can be identified3. This study aimed to simultaneously monitor the temperatures of fat and non-fat tissues using Look-Locker (LL) technique4 with dual echoes.Methods
A human tissue-mimicking phantom was prepared using agar (8 g/L), NaCl (10 g/L), and CuSO4 (1 g/L). The phantoms were heated in a microwave oven for 2 minutes. Echo-planar imaging (EPI)-based LL imaging with 29 inversion recovery pulses was acquired for about 40 minutes with dual echoes (TE1 = 2.3 and TE2 = 6.9 ms) and a scan time of 12 seconds. Using the TE1, magnitude images with 29 inversion recovery pulses were reconstructed into T1 maps through qMRLab software5. A constant value, M, for the T1-based temperature reading was calculated by dividing the initial T1 value by the absolute temperature of the fiber-optics6. To record the temperature value per LL acquisition, the M was divided after the first T1 value was subtracted from the different T1 state. On the one hand, the phase images with the longest inversion pulse in the dual-echoes were used to generate a delta-TE phase image, which corrects constant phase errors by temperature level1. Fat fraction (FF) maps were estimated from dual-echo magnitude images with the same inversion time to exclude areas of adipose tissue in PRFS process. The higher FF regions were removed from a map generated by conjugate processing of the phase images with the delta-TE phase image, and then PRFS steps were performed in sequence. Fiber-optic sensors were inserted into the phantom to confirm absolute temperatures during the acquisition time, which were used to validate the temperature pattern using the LL technique. Root mean square error (RMSE) analysis was employed to verify the temperature fidelity between the fiber-optics and the LL-based temperature monitoring technique. With the exception of the scan time of approximately 20 minutes, all procedure were applied to an ex-vivo bovine liver experiment.Results
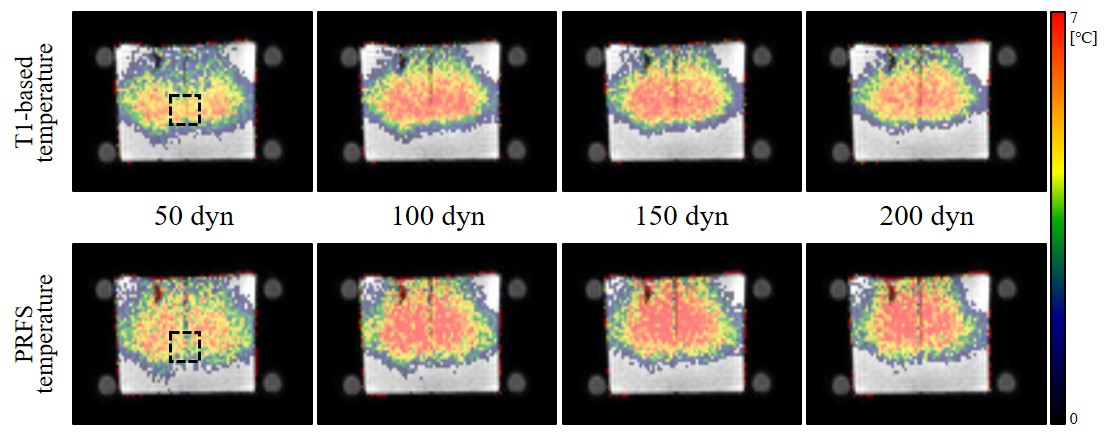
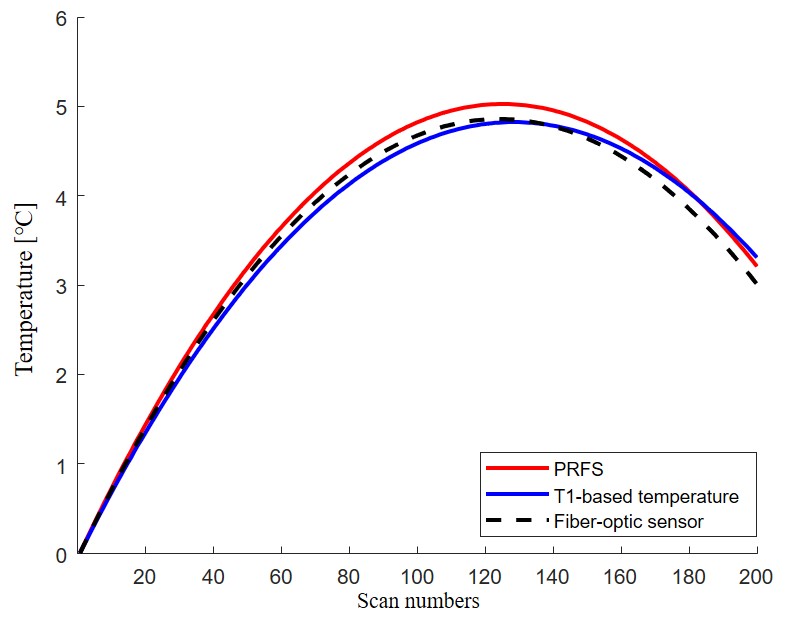
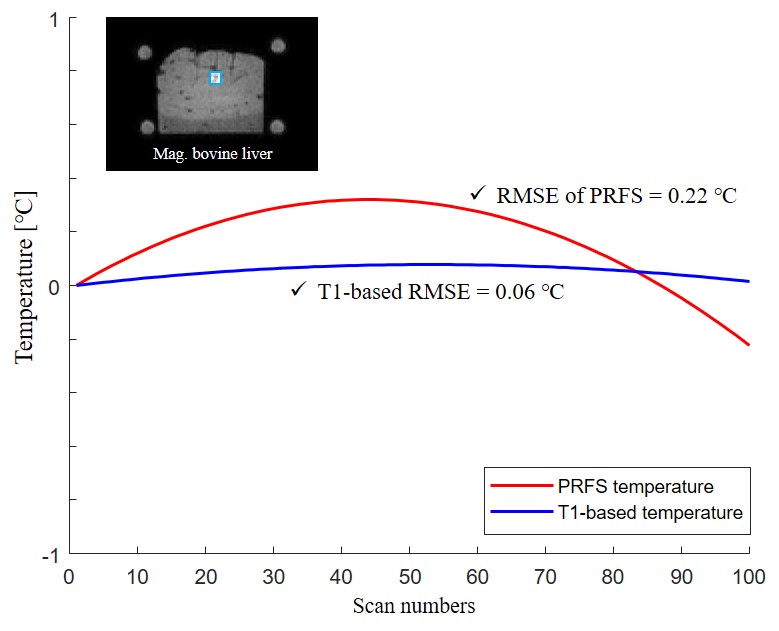
Both LL-based temperatures in the phantom showed a pattern quite similar to that of a fiber-optic sensor during the heating process (Fig. 1). Although the LL-based T1 temperature (about 3.21 ℃) had less temperature perturbation than the PRFS (about 3.31 ℃) compared to the fiber-optic sensor (about 3.01 ℃, Fig. 2), a temperature sensitivity of ± 1°C is sufficiently covered. The RMSE was approximately 0.11 ℃ for the PRFS and approximately 0.15 ℃ for the LL-based T1 temperature. In the bovine liver experiment from the fiber optic (3.59 ℃), the PRFS temperature showed about 3.64 ℃ and the T1-based temperature showed about 3.34 ℃, which had the RMSEs with about 0.22 ℃ at the PRFS and about 0.06 ℃ at the T1-based temperature, respectively (Fig. 3).Discussion
Using the LL technique, this study has demonstrated that PRFS (RMSE = 0.11 ℃ at phantom and 0.22 ℃ at ex-vivo experiment) and T1-based temperatures (RMSE = 0.15 ℃ at phantom and 0.06 ℃ at ex-vivo experiment) appear similar to that of the fiber-optic sensor. The LL-based temperature readings were virtually indistinguishable from the fiber-optic sensor, indicating that accurate temperature observations can be made in both adipose and non-adipose tissues. The two-point Dixon method can straightforwardly determine the FF information, which is characterized as the proportion of fat protons7. In this study, phase regions with higher FF were excluded when processing the PRFS, which ensures that the PRFS temperature matches that of the fiber-optic sensor (Fig. 3). This implies that temperature inaccuracies in PRFS occur in the FF regions where the magnetic susceptibility changes with temperature levels. Therefore, the LL technique with dual echoes in PRFS causes phase shifts solely due to changes in water content as temperature increases. We also demonstrated that temperature measurements derived from T1 maps are a valid and comparable alternative to those obtained with the fiber-optic sensor. This provides evidence that T1 maps can provide accurate temperature measurements in adipose tissue, which is well supported by previous studies3,7. That is, temperature monitoring using the dual-echo LL technique could be suitable for accurate thermal measurement in all tissue types.Acknowledgements
No acknowledgement found.References
1. D Winter L, Oberacker E, Paul K, Ji Y, Oezerdem C, Ghadjar P, et al. Magnetic resonance thermometry: Methodology, pitfalls and practical solutions. International Journal of Hyperthermia. 2016;32(1):63-75.
2. Liu J, Peters DC, Drangova M. Method of B0 mapping with magnitude‐based correction for bipolar two‐point D ixon cardiac MRI. Magnetic resonance in medicine. 2017;78(5):1862-9.
3. Todd N, Diakite M, Payne A, Parker DL. In vivo evaluation of multi‐echo hybrid PRF/T1 approach for temperature monitoring during breast MR‐guided focused ultrasound surgery treatments. Magnetic Resonance in Medicine. 2014;72(3):793-9.
4. Taylor AJ, Salerno M, Dharmakumar R, Jerosch-Herold M. T1 mapping: basic techniques and clinical applications. JACC: Cardiovascular Imaging. 2016;9(1):67-81.
5. Karakuzu A, Boudreau M, Duval T, Boshkovski T, Leppert I, Cabana J-F, et al. qMRLab: Quantitative MRI analysis, under one umbrella. Journal of Open Source Software. 2020;5(53).
6. Rieke V, Butts Pauly K. MR thermometry. Journal of Magnetic Resonance Imaging: An Official Journal of the International Society for Magnetic Resonance in Medicine. 2008;27(2):376-90.
7. Hayashi T, Saitoh S, Takahashi J, Tsuji Y, Ikeda K, Kobayashi M, et al. Hepatic fat quantification using the two‐point Dixon method and fat color maps based on non‐alcoholic fatty liver disease activity score. Hepatology Research. 2017;47(5):455-64.
Figures