4934
In Vivo 3D Hybrid fat-water MR Thermometry via Simultaneous Proton Resonance Frequency Shift and T1 Measurement1University of Utah, Salt Lake City, UT, United States
Synopsis
Keywords: Thermometry/Thermotherapy, Thermometry
Motivation: In current clinical magnetic resonance-guided focused ultrasound (MRgFUS) ablation applications, only aqueous tissues are monitored with MR thermometry. Accurate thermometry of heterogeneous aqueous and fat tissue volumes would increase treatment safety and efficacy.
Goal(s): Evaluate a single reference variable flip angle (SR-VFA) sequence for hybrid proton resonance frequency shift and ΔT1 MR thermometry in heterogeneous tissue volumes.
Approach: MRgFUS ablation in an in vivo rabbit model was monitored with SR-VFA thermometry. Cumulative thermal dose (CTD) maps calculated from SR-VFA images were compared with non-perfused volumes and histological samples.
Results: SR-VFA derived CTD maps accurately predicted volumes of thermal damage in muscle and fat.
Impact: Hybrid proton resonance frequency shift and T1 thermometry allows for accurate temperature monitoring of heterogeneous tissue volumes. This increases the safety and efficacy of MR-guided focused ultrasound treatments in mixed-tissue treatment areas by ensuring target temperatures reach appropriate thresholds.
Introduction
A significant advantage of MR-guided focused ultrasound (MRgFUS) is the ability to monitor temperature change during treatment using magnetic resonance thermometry (MRT). For aqueous tissues, the proton resonance frequency (PRF) shift method provides clinically relevant temporal and spatial resolution1,2 but is not sensitive to temperature changes in fat.3 While it is known that measuring T1 changes can measure temperature change in fat,4,5 this has not been used clinically.A hybrid MRT sequence has been developed to simultaneously measure temperature using both the PRF and T1 thermometry methods.6-8 PRF shift is calculated at each time point while ΔT1 is calculated using a single reference image with the variable flip angle method in a stack-of-stars sampling method (SR-VFA-SoS). The SR-VFA-SoS sequence has been evaluated under phantom and non-heating conditions, demonstrating the ability to simultaneously measure 3D PRF and T1 changes.9 This work evaluates the SR-VFA-SoS approach for predicting thermal ablation in MRgFUS in an in vivo rabbit model through comparing thermal biomarkers to post-treatment images and histology data.
Methods
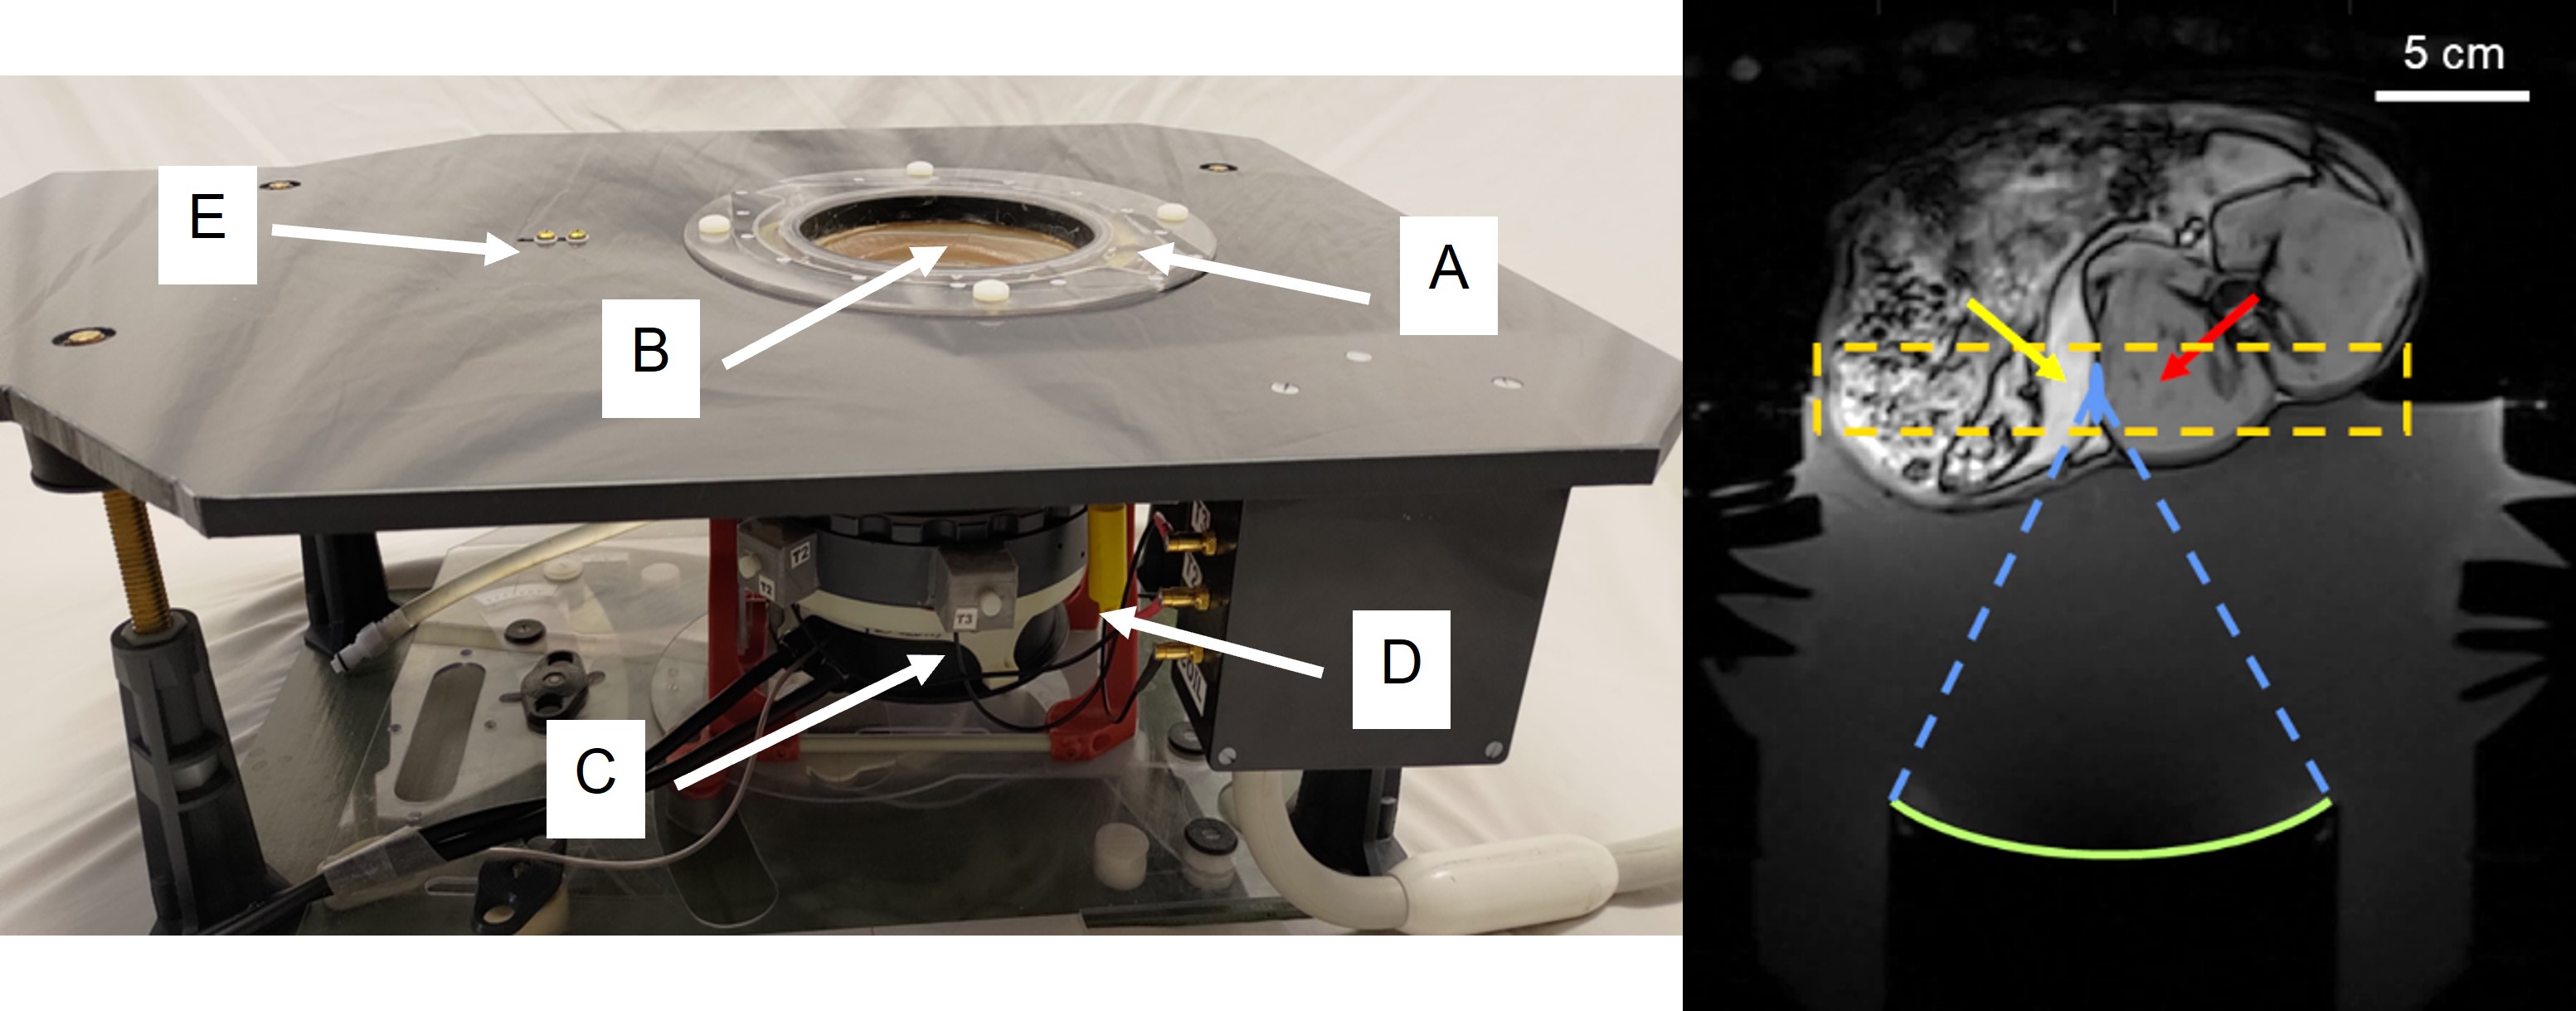
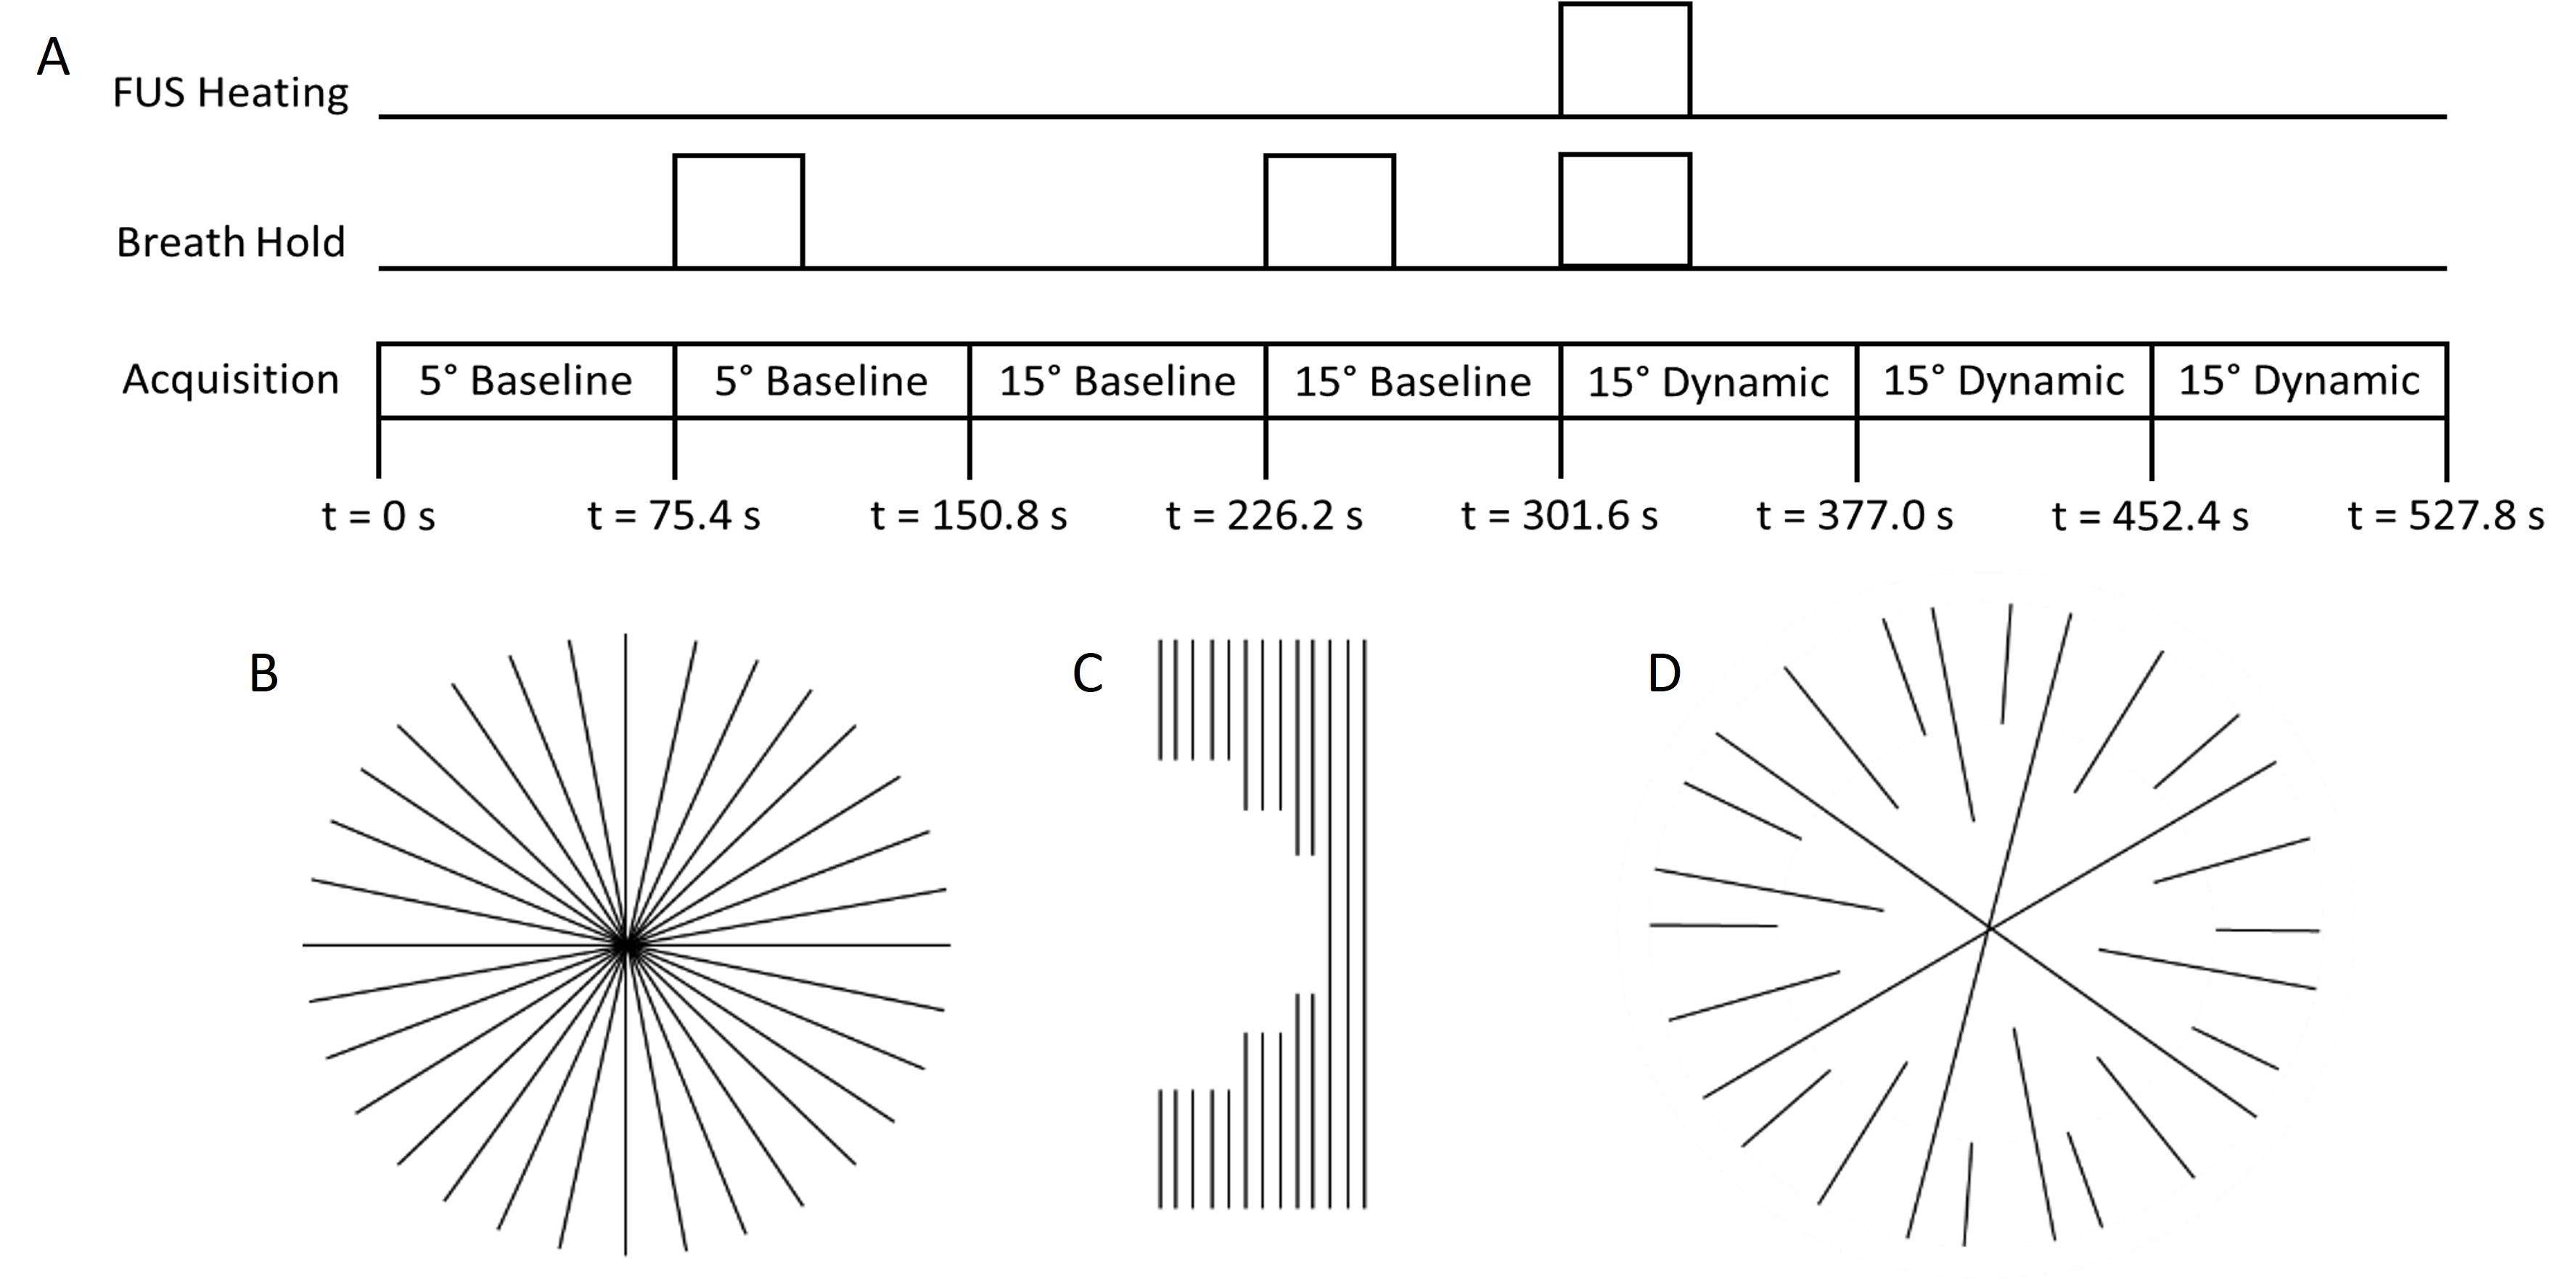
In vivo experiments (New Zealand white rabbits, N=4) were performed in a 3T MRI scanner (Prisma, Siemens) using an MRgFUS system (Figure 1a). Animals were positioned supine with the treatment area acoustically coupled to the transducer (Figure 1b). Sequential volumetric sonications (40s, 27-31W acoustic power, N=9) were performed in a grid pattern centered at the perirenal fat-paraspinal muscle interface. Hybrid thermometry data was acquired during sonications using the SR-VFA-SoS sequence with pseudo-Golden Angle (pGA) view angle increment of 360x233/377 and 377 total projections. Prior to each sonication, two baseline acquisitions at a lower flip angle were acquired, and five total dynamic acquisitions at a higher flip angle were acquired before, during, and after each sonication (Figure 2a). The sonication was applied starting at the beginning of the third dynamic acquisition. T1-weighted and T2-weighted MR images were captured before and after MRgFUS ablation, with additional contrast-enhanced T1-weighted imaging post-ablation. Animals were euthanized immediately following post-ablation imaging. Reconstruction of the SR-VFA-SoS images were performed using a k-space weighted image contrast (KWIC) method as described in Song, et al.,11 with 13 central projections and 377 total projections using a sliding asymmetric window to leverage oversampling at the center of radial projections (Figure 2b-d). Temporal resolution for the T1 and PRF shift temperature data was 1.71 s. Temperature and ΔT1 data was acquired at 1.5 × 1.5 × 2 mm (zero-fill interpolated to 0.75 × 0.75 × 2 mm). 2-point Dixon images were used to calculate water- and fat-fraction images, which were in turn used to segment images into muscle and fat voxels. Hybrid thermometry maps were formed by using PRF thermometry data for muscle voxels and ΔT1 for fat voxels. The ΔT1 data was converted to temperature using a previously experimentally derived conversion factor of 7.3 ms/°C.12 Cumulative thermal dose (CTD) maps were calculated.13 The volume of hyperintense regions of contrast-enhanced post-treatment images was calculated and compared with the volume of the associated PRF shift only and hybrid SR-VFA-SoS thermometry CTD maps. Muscle and fat tissue from the treated area were excised for histology. Tissue samples were fixed, processed, embedded, sectioned, and stained with H&E. A compound light microscope was used to assess tissue damage in sonicated regions.Results
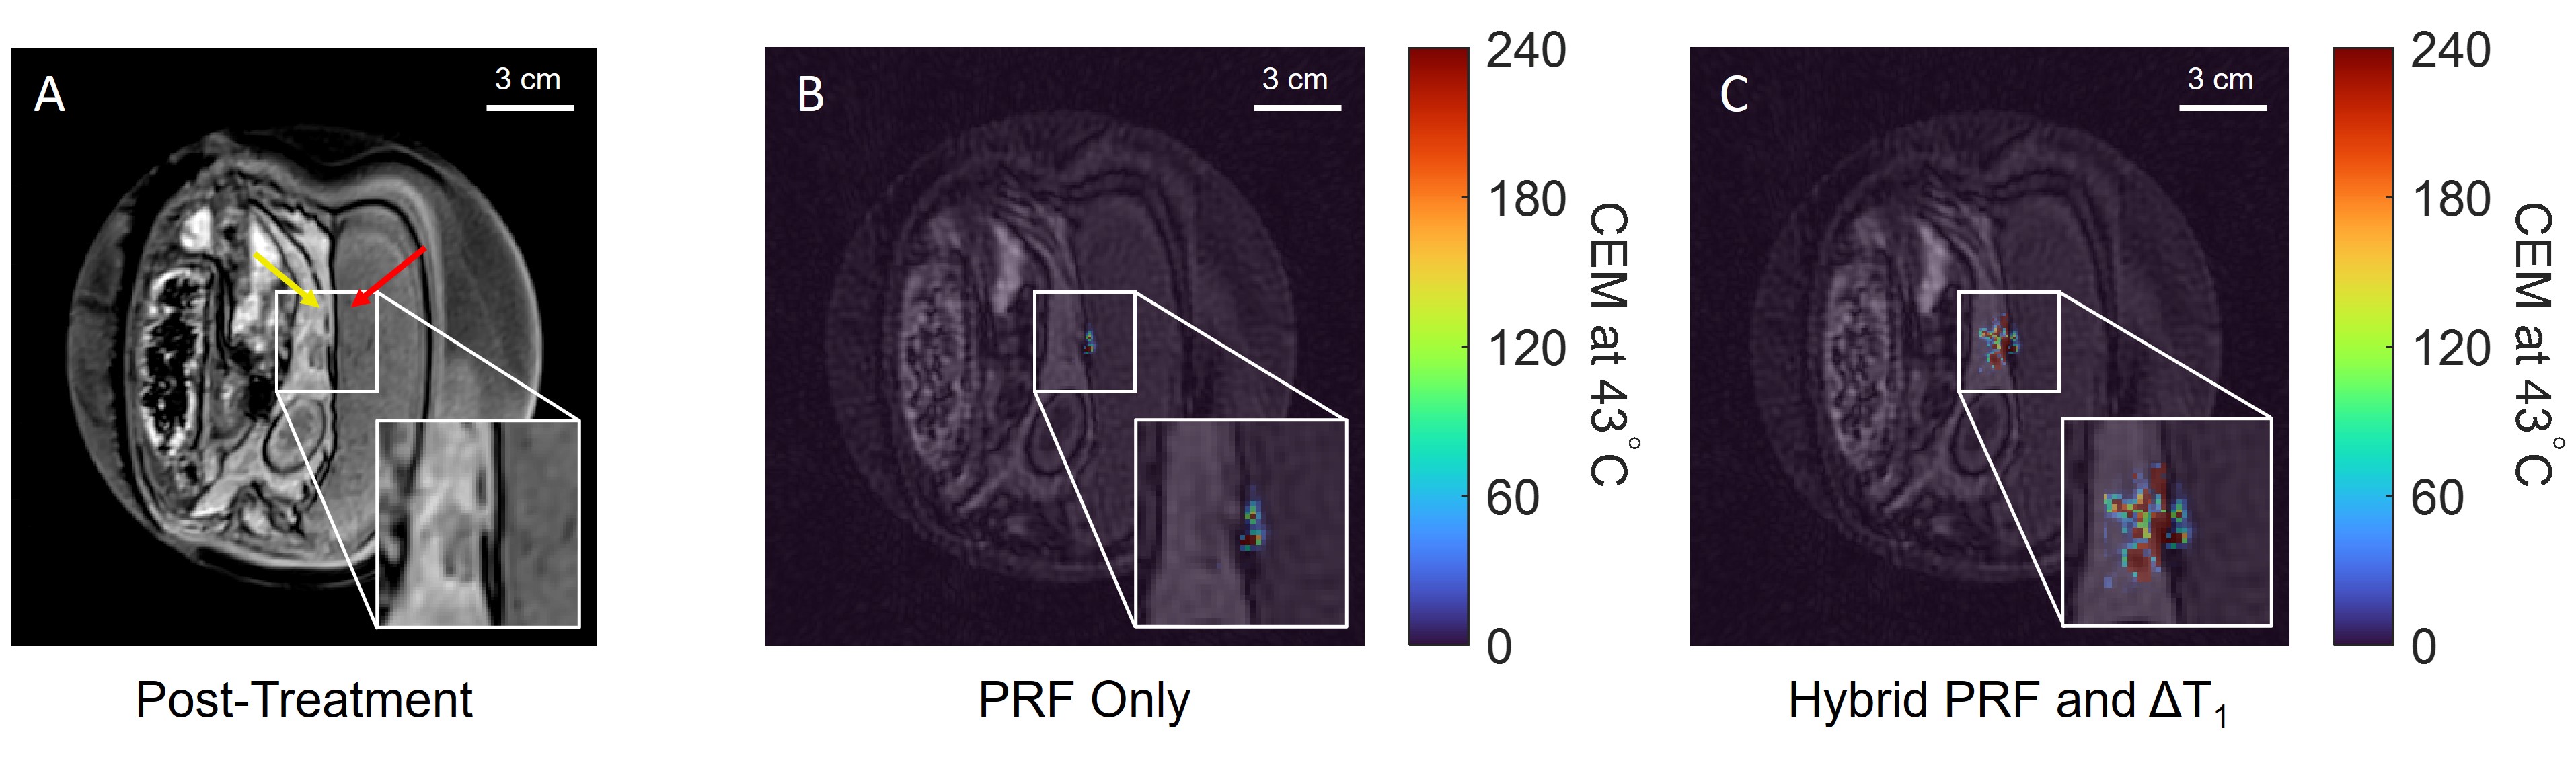
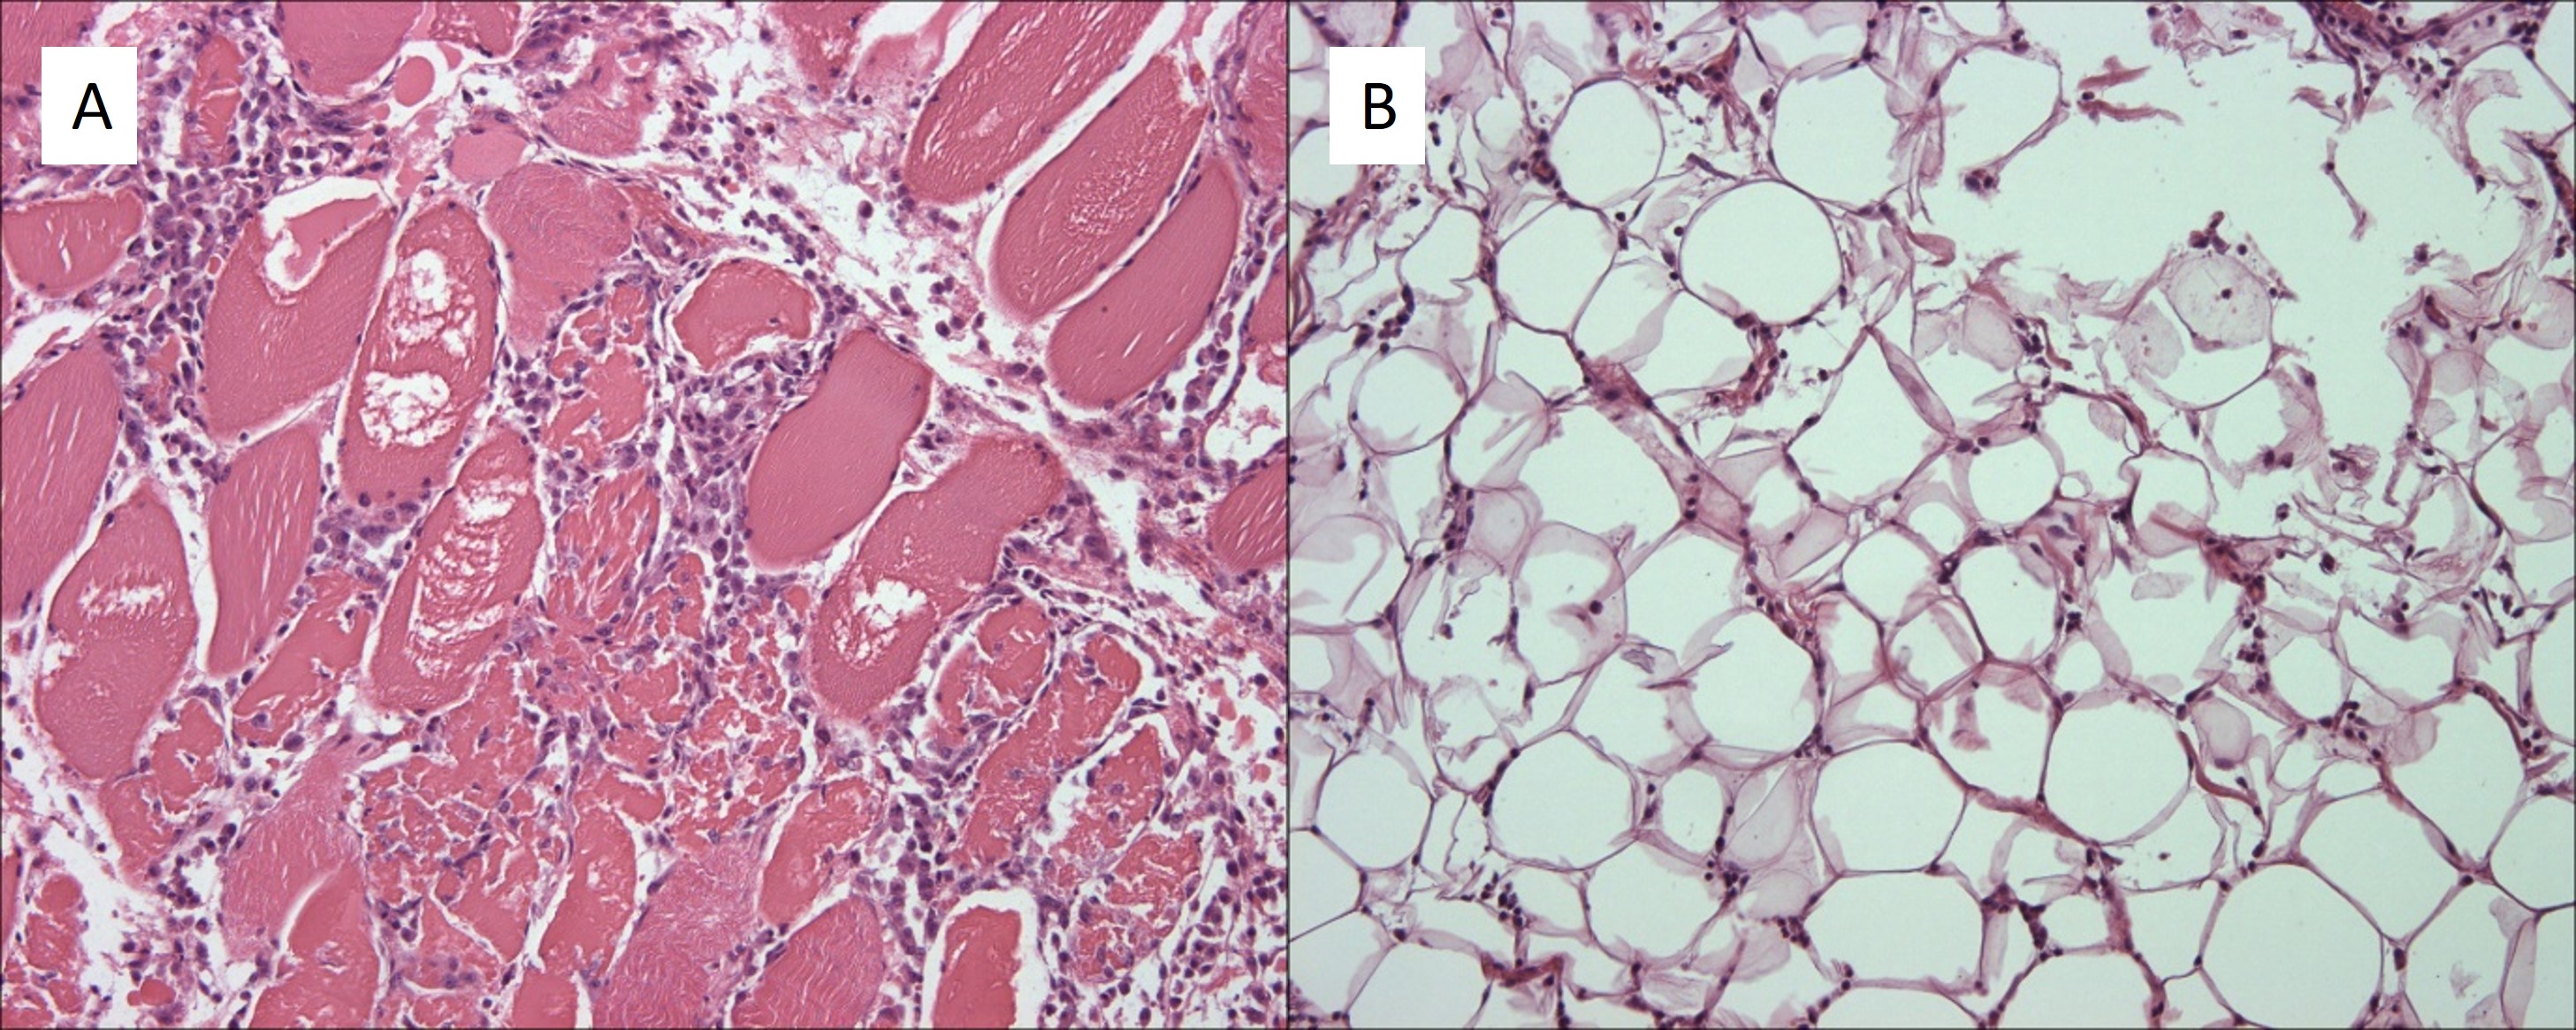
PRF-only and hybrid PRF and ΔT1-based temperature changes were successfully calculated for all sonications (Figure 3). Peak temperature rises from 23.6 to 32.0 °C were observed for individual sonications. CTD maps based on PRF-only thermometry accurately monitored thermal damage in muscle but, as expected, did not measure any thermal damage in fat. CTD maps calculated from hybrid PRF and ΔT1-based temperature changes measured thermal damage in both muscle and fat, qualitatively aligning with hypointense regions in opposed-phase Dixon images (Figure 4). Histology confirmed thermal damage in sonicated regions of both muscle and fat (Figure 5).Discussion
This work demonstrates the capability of the SR-VFA-SoS method for predicting thermal ablation using simultaneous PRF shift and ΔT1 measurement in vivo. CTD maps calculated from the SR-VFA-SoS thermometry more accurately predicted thermal damage than CTD maps calculated from PRF shift-only thermometry. Predicted thermal damage was confirmed via histological samples taken from the treatment site. Future work will improve the SR-VFA-SoS sequence by reducing the reconstruction time to real time for clinical use.Conclusion
This work provides an in vivo evaluation of the SR-VFA-SoS method of 3D hybrid PRF shift and ΔT1 thermometry for predicting thermal ablation in heterogeneous tissue volumes. The SR-VFA sequence ultimately allows for accurate temperature monitoring across entire volumes of mixed tissue types with high temporal and spatial resolution.Acknowledgements
This work is supported by NIH R37CA224141, S10OD018482, and 5R01EB028316.References
1. Hokland SL, Pedersen M, Salomir R, Quesson B, Stodkilde-Jorgensen H, Moonen CTW. MRI-guided focused ultrasound: methodology and applications. IEEE Trans Med Imaging. 2006;25:723–731.
2. , , , et al. AAPM Task Group 241: A medical physicist’s guide to MRI-guided focused ultrasound body systems. Med Phys. 2021; 48: e772– e806.
3. Rieke V, Butts Pauly K. MR thermometry. J Magn Reson Imaging. 2008;27(2):376-390. doi:10.1002/jmri.21265
4. Kuroda K, Iwabuchi T, Obara M, Honda M, Saito K, Imai Y. Temperature dependence of relaxation times in proton components of fatty acids. Magn Reson Med. 2011;10:177–183.
5. Odéen, H., & Parker, D.L. Magnetic resonance thermometry and its biological applications - Physical principles and practical considerations. Progress in nuclear magnetic resonance spectroscopy. 2019; 110:34-61.
6. Todd N, Diakite M, Payne A, Parker DL. Hybrid proton resonance frequency/T1 technique for simultaneous temperature monitoring in adipose and aqueous tissues. Magn Reson Med. 2013;69:62–70.
7. Diakite M, Odeen H, Todd N, Payne A, Parker DL. Toward realtime temperature monitoring in fat and aqueous tissue during magnetic resonance‐guided high‐intensity focused ultrasound using a three‐dimensional proton resonance frequency T1 method. Magn Reson Med. 2014;72:178–187
8. Todd N, Diakite M, Payne A, Parker DL. In vivo evaluation of multi‐echo hybrid PRF/T1 approach for temperature monitoring during breast MR‐guided focused ultrasound surgery treatments. Magn Reson Med. 2014;72:793–799.
9. Svedin BT, Payne A, Parker DL. Simultaneous proton resonance frequency shift thermometry and T1 measurements using a single reference variable flip angle T1 method. Magn Reson Med. 2019;81(5):3138-3152.
10. Cline HE, Hynynen K, Hardy CJ, Watkins RD, Schenck JF, Jolesz FA. MR temperature mapping of focused ultrasound surgery. Magn Reson Med. 1994;31:628–636.
11. Song HK and Dougherty L. k-Space weighted image contrast (KWIC) for contrast manipulation in projection reconstruction MRI. Magn Reson Med. 2000;44: 825-832.
12. Richards N, Odeen H, Johnson S, Parker D, Payne A. In vivo simultaneous proton resonance frequency shift thermometry and single reference variable flip angle T1 measurement [abstract]. In: 2022 Joint Annual Meeting ISMRM-ESMRMB & ISMRT 31st Annual Meeting. 7-12 May 2022. London, England.
13. Sapareto SA, Dewey WC. Thermal dose determination in cancer therapy. Int J Radiat Oncol Biol Phys. 1984 Jun;10(6):787-800.
Figures
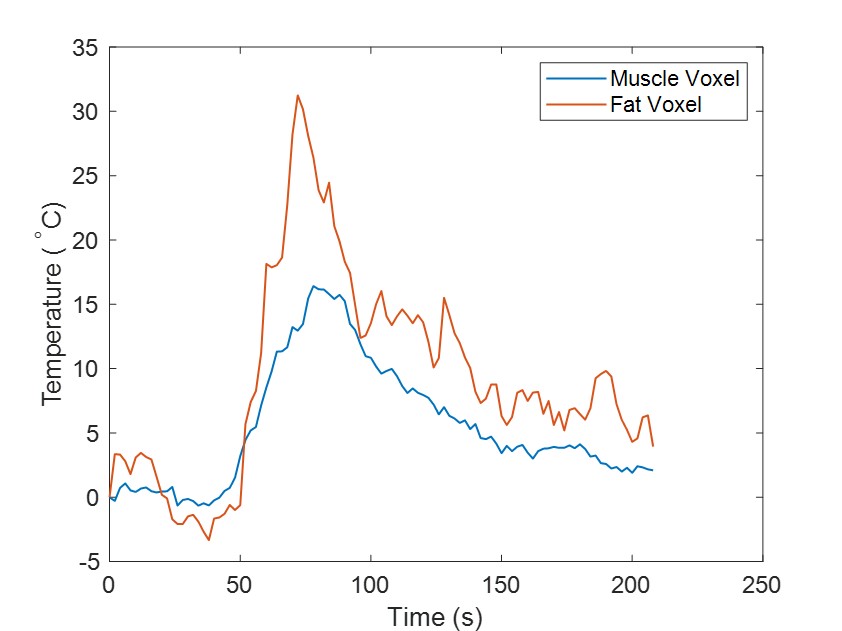
1. Single sonication peak muscle and fat temperatures. Peak temperatures for a single volumetric sonication centered in fat. All temperatures are calculated from SR-VFA images, with muscle temperatures (blue) derived via the PRF shift method and fat temperatures (orange) derived from ΔT1 measurements.