4932
3D MR Thermometry Sequences for Abdominal Microwave Ablation Monitoring on Phantom Simulating Breathing Motion1Diagnostic and Interventional Radiology, Hannover Medical School, Hannover, Germany, 2Research Campus STIMULATE, Magdeburg, Germany, 3Faculty of Electrical Engineering and Information Technology, Otto-von-Guericke University, Magdeburg, Germany
Synopsis
Keywords: MR-Guided Interventions, Thermometry
Motivation: 3D MR-thermometry enhances microwave ablation success by providing real-time temperature and ablation insights. However, clinical availability is limited due to challenges such as breathing motion and electromagnetic interferences.
Goal(s): Our study conducts 3D MR-thermometry comparing stack-of-stars and a stack-of-spirals sequences using a clinically approved generator and phantoms simulating breathing motion.
Approach: Temperature precision and precision of ablation zones of both sequences were compared.
Results: Stack-of-spirals sequence seems to be the superior MR-thermometry sequence. Dice scores of around 90 % and temperature precisions around 1°C were reached with very little image degradation due to motion or electromagnetic interferences.
Impact: Our study shows the possibility of motion robust 3D MR-thermometry using a clinically approved microwave generator. Future developments might provide real-time 3D MR thermometry during clinical abdominal thermal therapies, enhancing their success and increasing the total number of MR interventions.
Introduction
3D MR thermometry enables monitoring and guidance of thermal tumor therapies and thus enhances their efficacy. Especially for moving organs, such as the liver, fast and motion-robust MR sequences are crucial. However, these challenges are one reason for the limited success of clinically available MR thermometry. In our work, we conducted a comparative analysis of a stack-of-stars1 (stars) and a stack-of-spirals2 (spirals) sequence by performing 3D thermometry during microwave ablation with a clinical approved setting in a phantom simulating breathing motion.Methods
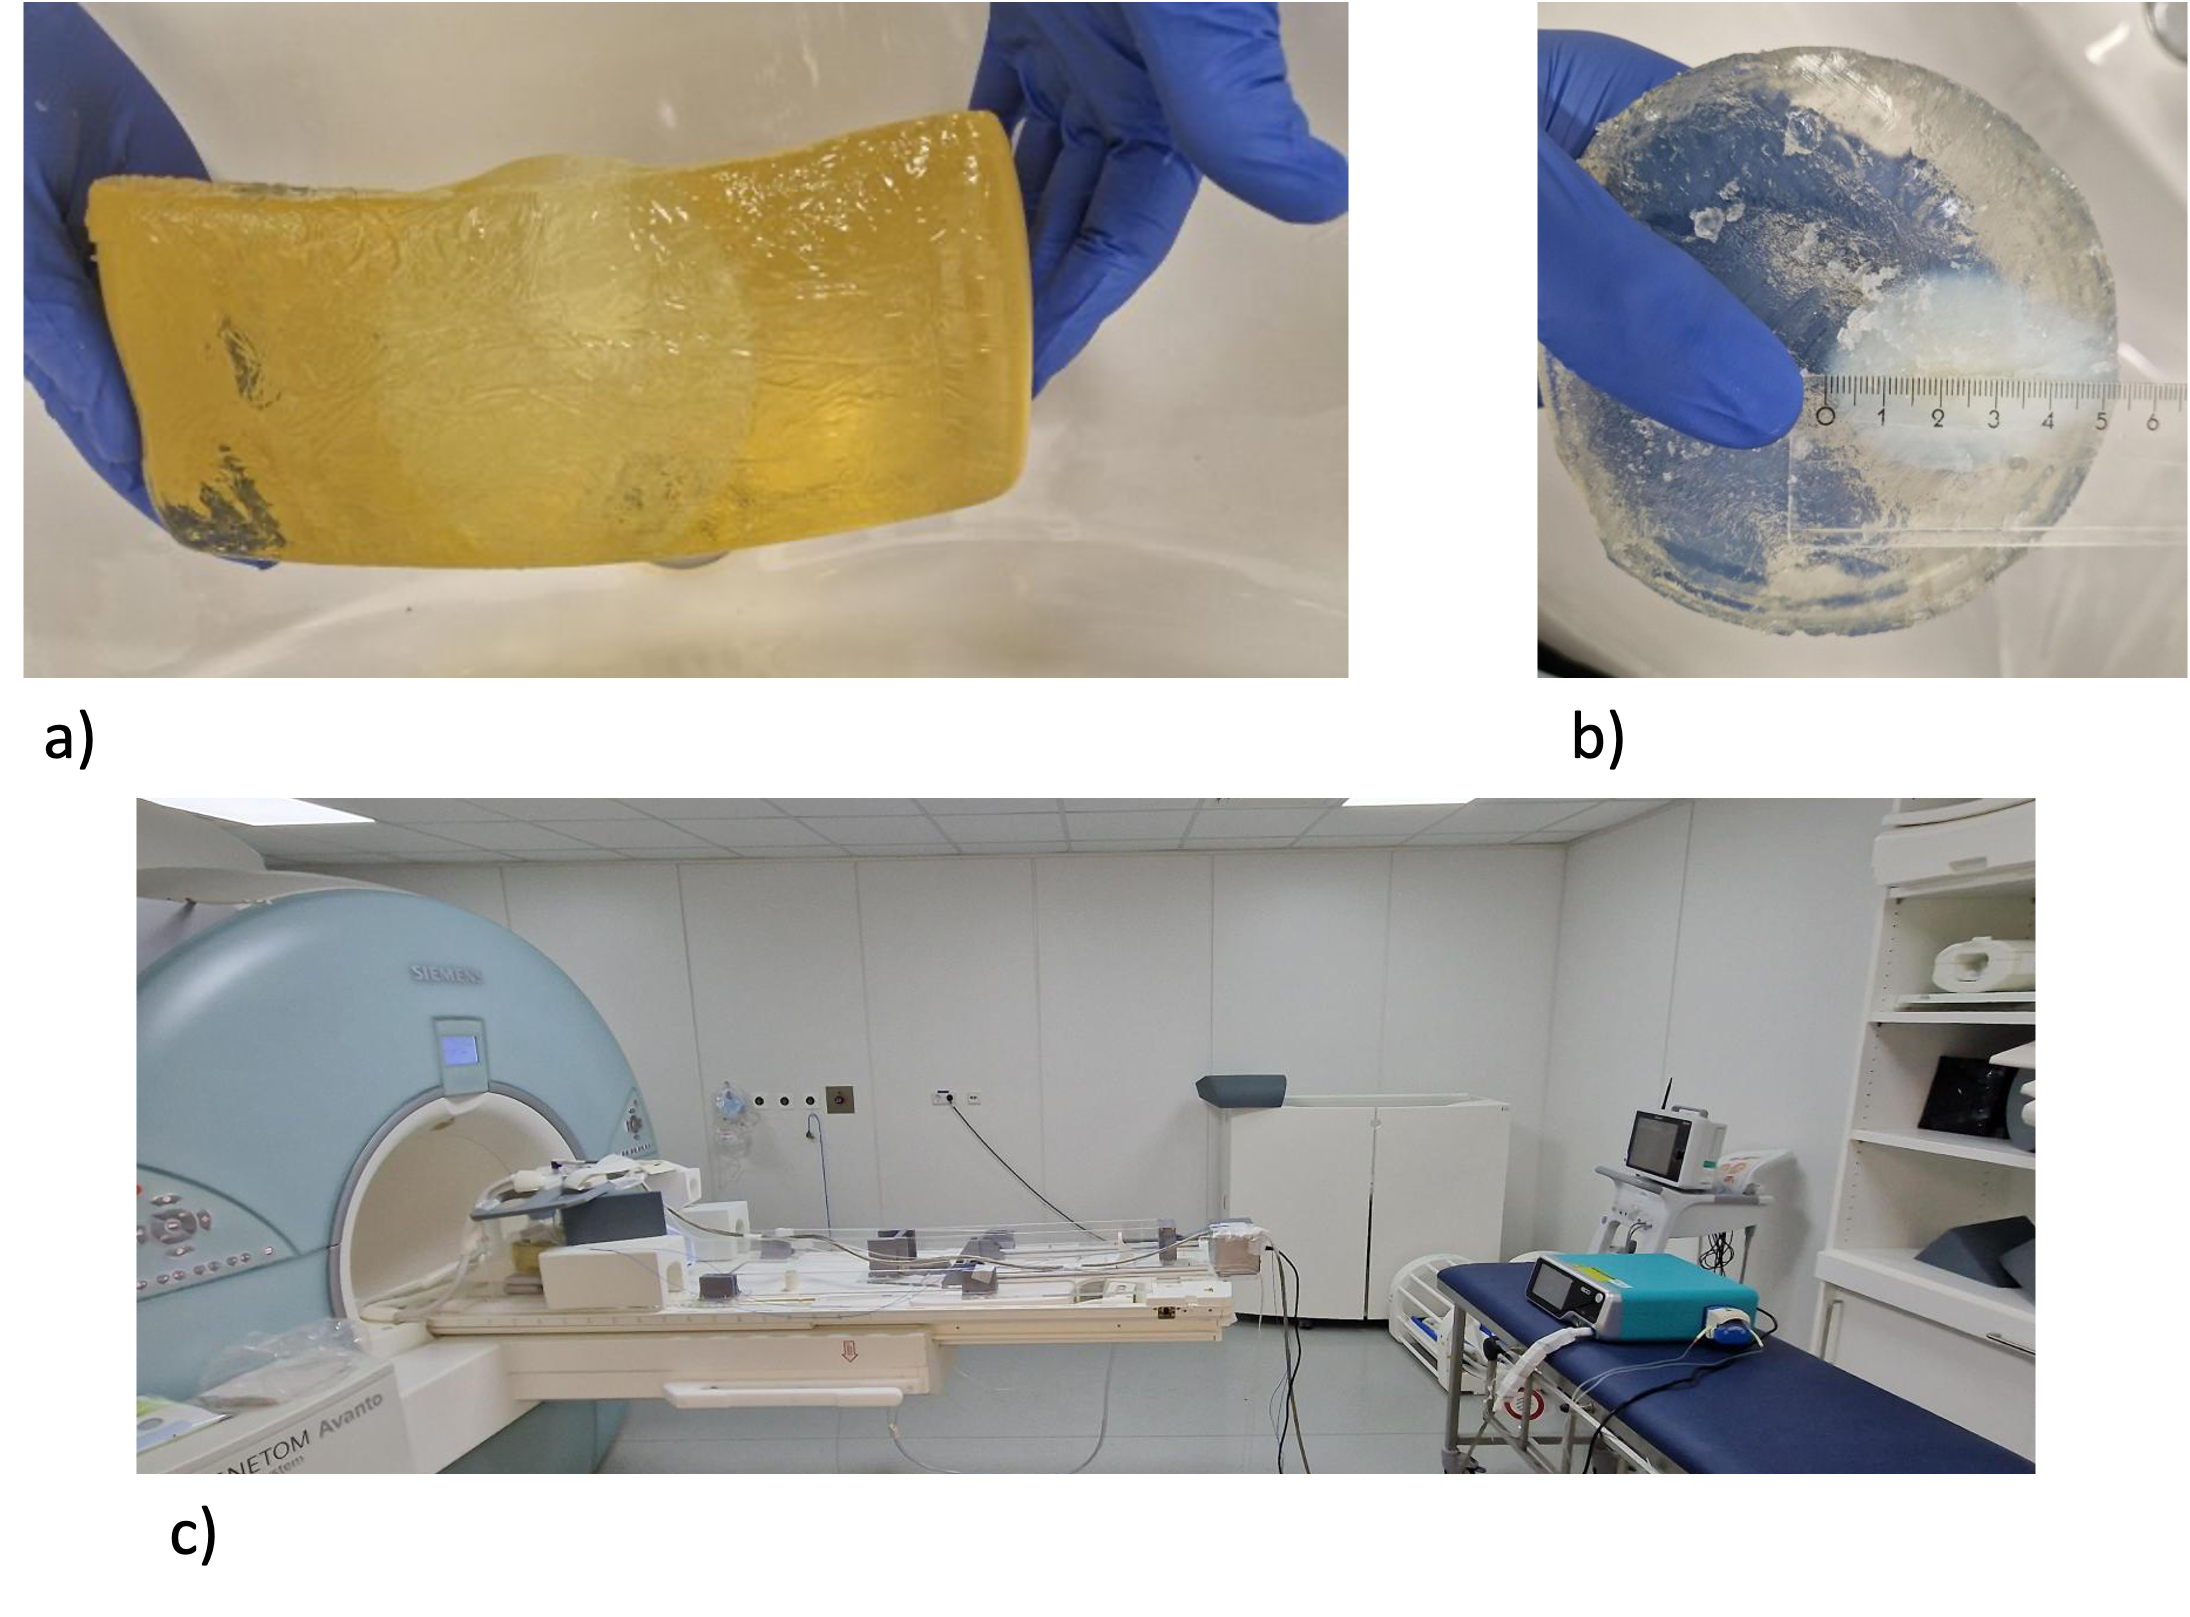
In our work, we compared a multigradient echo stack-of-stars1 sequence (7 echoes with TEs: 1.7 ms to 14.9 ms, TR: 17.3 ms, bandwidth: 100 kHz, FoV: 480 x 480 x 60 mm3, resolution: 2.5 mm isotropic) and a dual-gradient echo stack-of-spirals2 sequence (TE: 7.5 ms and 14.5 ms, TR: 22.6 ms, bandwidth: 200 kHz, 480 x 480 x 60 mm3 , resolution: 2.5 mm isotropic). As shown in figure 1 c), the clinically approved microwave generator (MWG, ECO-100E2, ECO Medical Technologies) was placed in the MR cabin and the 4 m microwave cable was shielded3 to reduce electromagnetic interferences. In total, the scan time of MR thermometry was 16 min consisting of 3 min baseline (MWG in standby), 10 min ablation at 80 W and 3 min cooling after ablation (MWG in standby). The experiments were performed on a 1.5 T scanner (MAGNETOM Avanto, Siemens Healthcare) in two bioprotein phantoms4 cast in gelatin (see figure 1 b) and c)) that were periodically compressed with a motorized plunger to simulate breathing motion5 (11.28 cycles per min). Data reconstruction via compressed sensing and parallel imaging using the toolbox BART6 was performed for time resolutions of about 5 s, 10 s and 15 s corresponding to one, two and three breathing cycles per volume. Via DC gating1 the data was sorted for motion states. Only data in exhalation associated to approximately 30 % of the breathing cycle were used in reconstruction. Additionally, the data was corrected for gradient delay7 and phasedrift8. All echoes were combined to temperature maps9 and the ablation zones were calculated by the CEM4310 model. To evaluate the two sequences for accuracy in monitoring the microwave ablation, two fiber optical temperature sensors were used as temperature reference and a ground truth for the predicted ablation zones was generated by manual segmentation of a post-ablative T2-weighted Turbo-Spin-Echo sequence (1 x 1 x 1 mm3, TE = 156 ms, TR = 10960 ms).Results
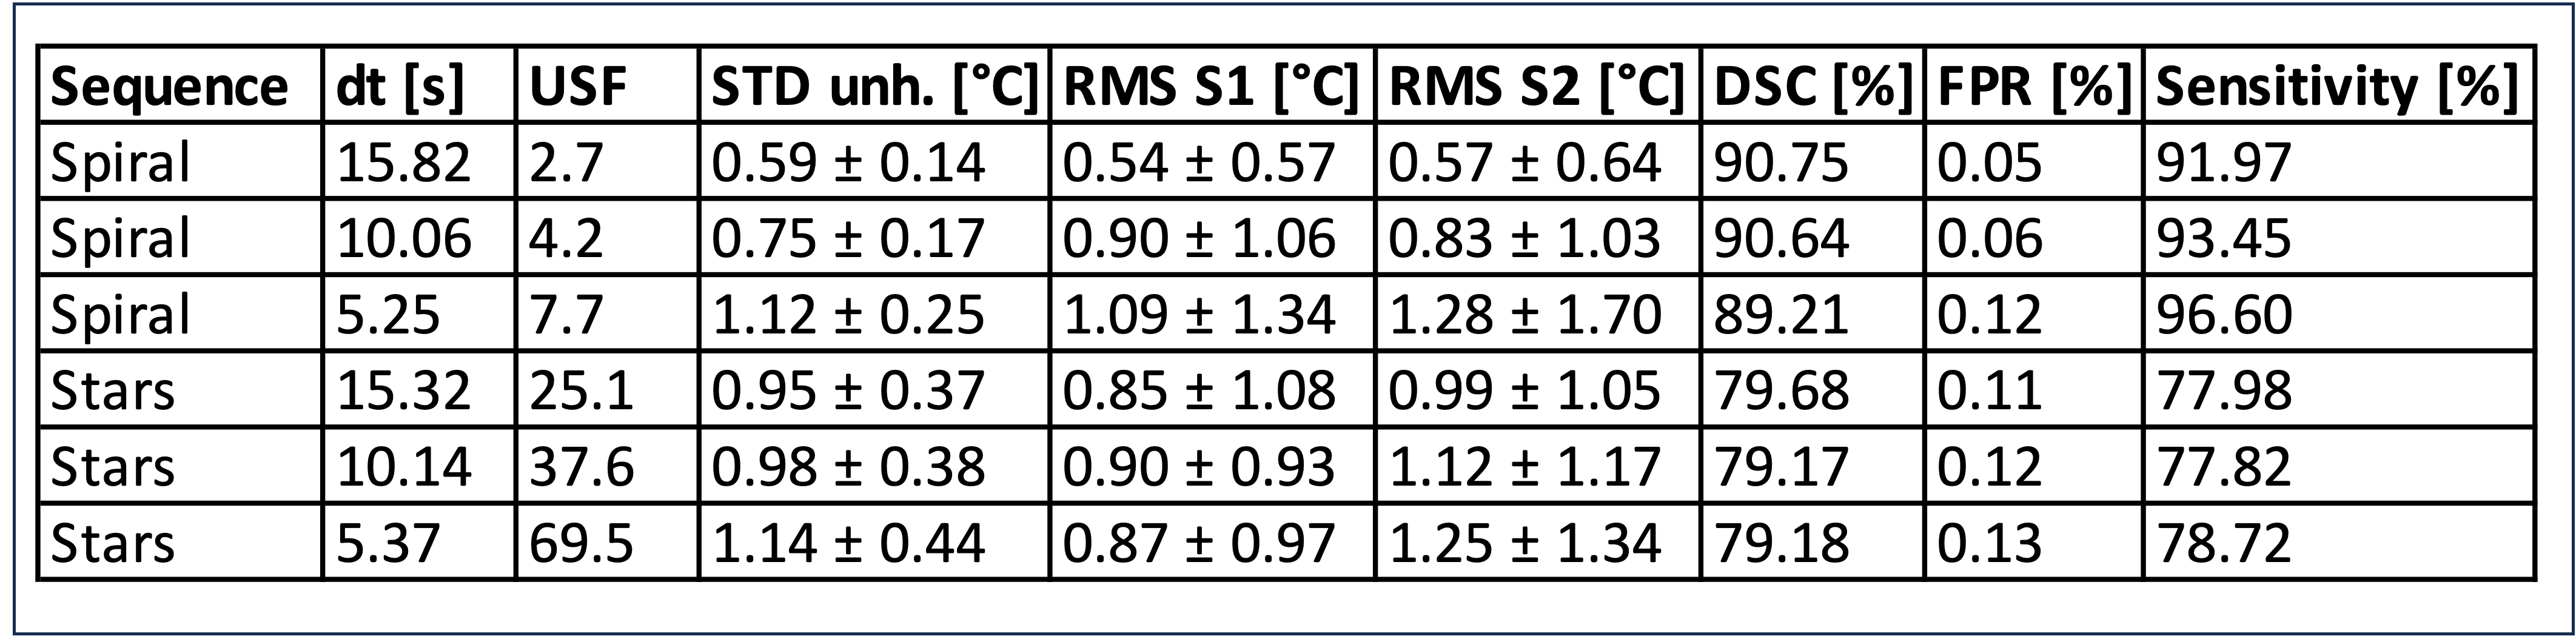
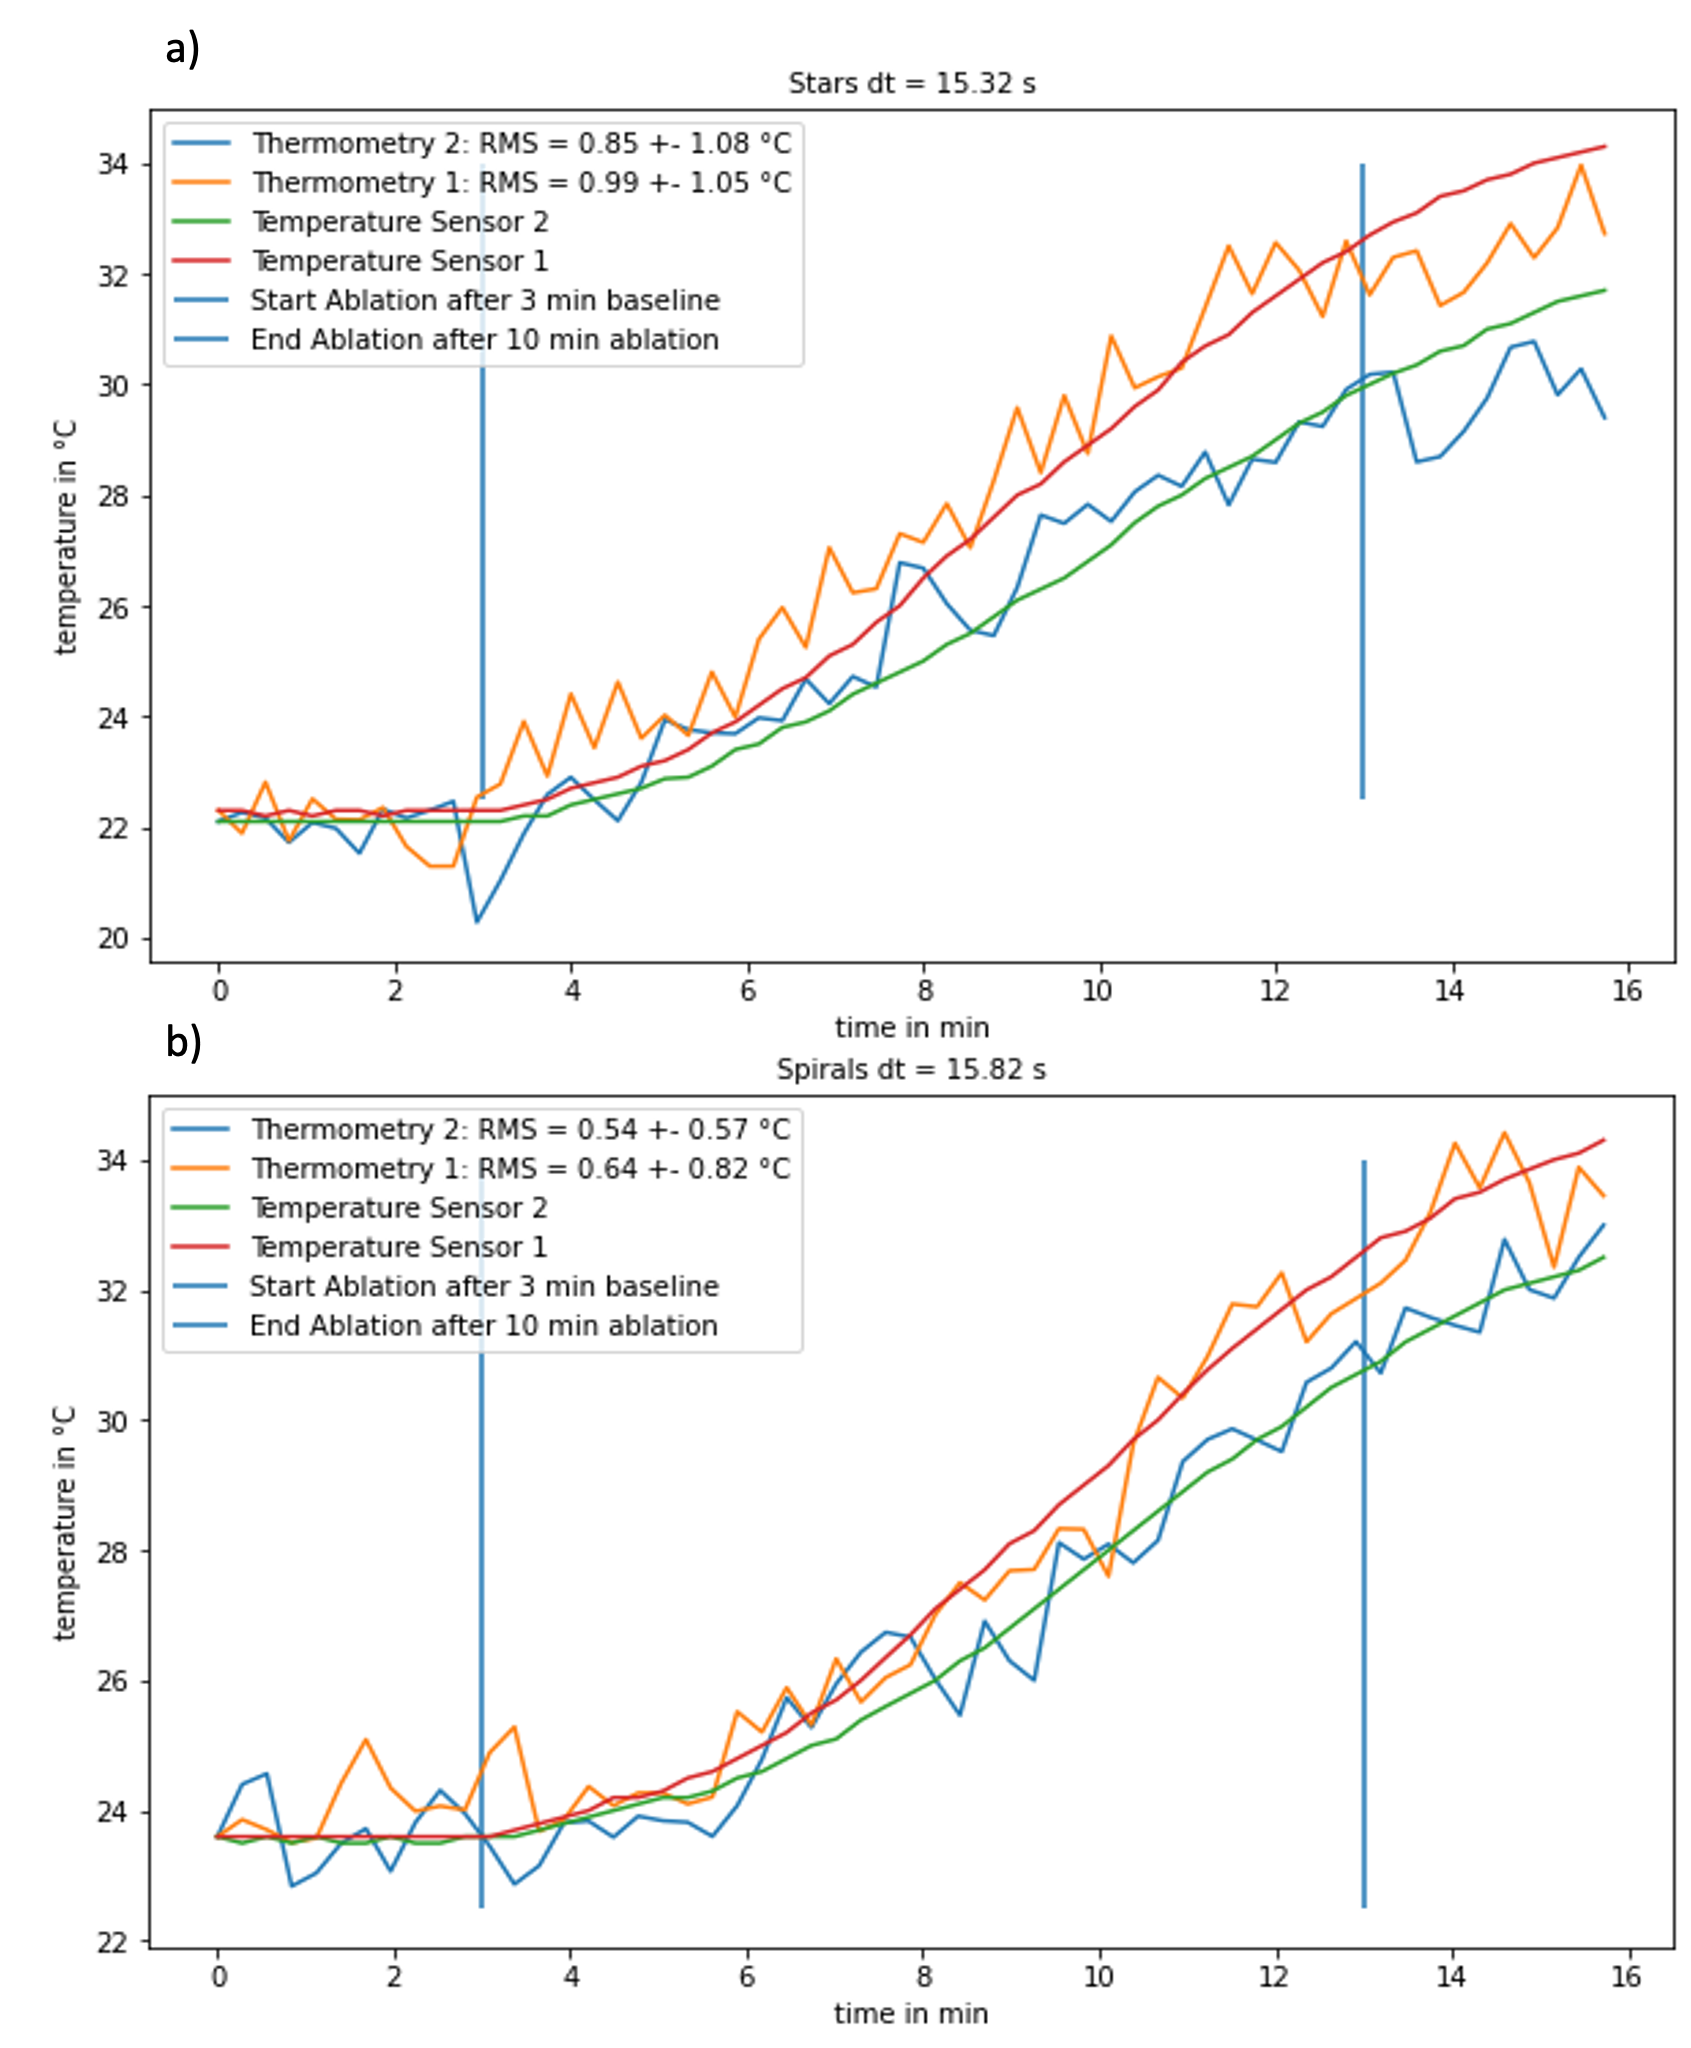
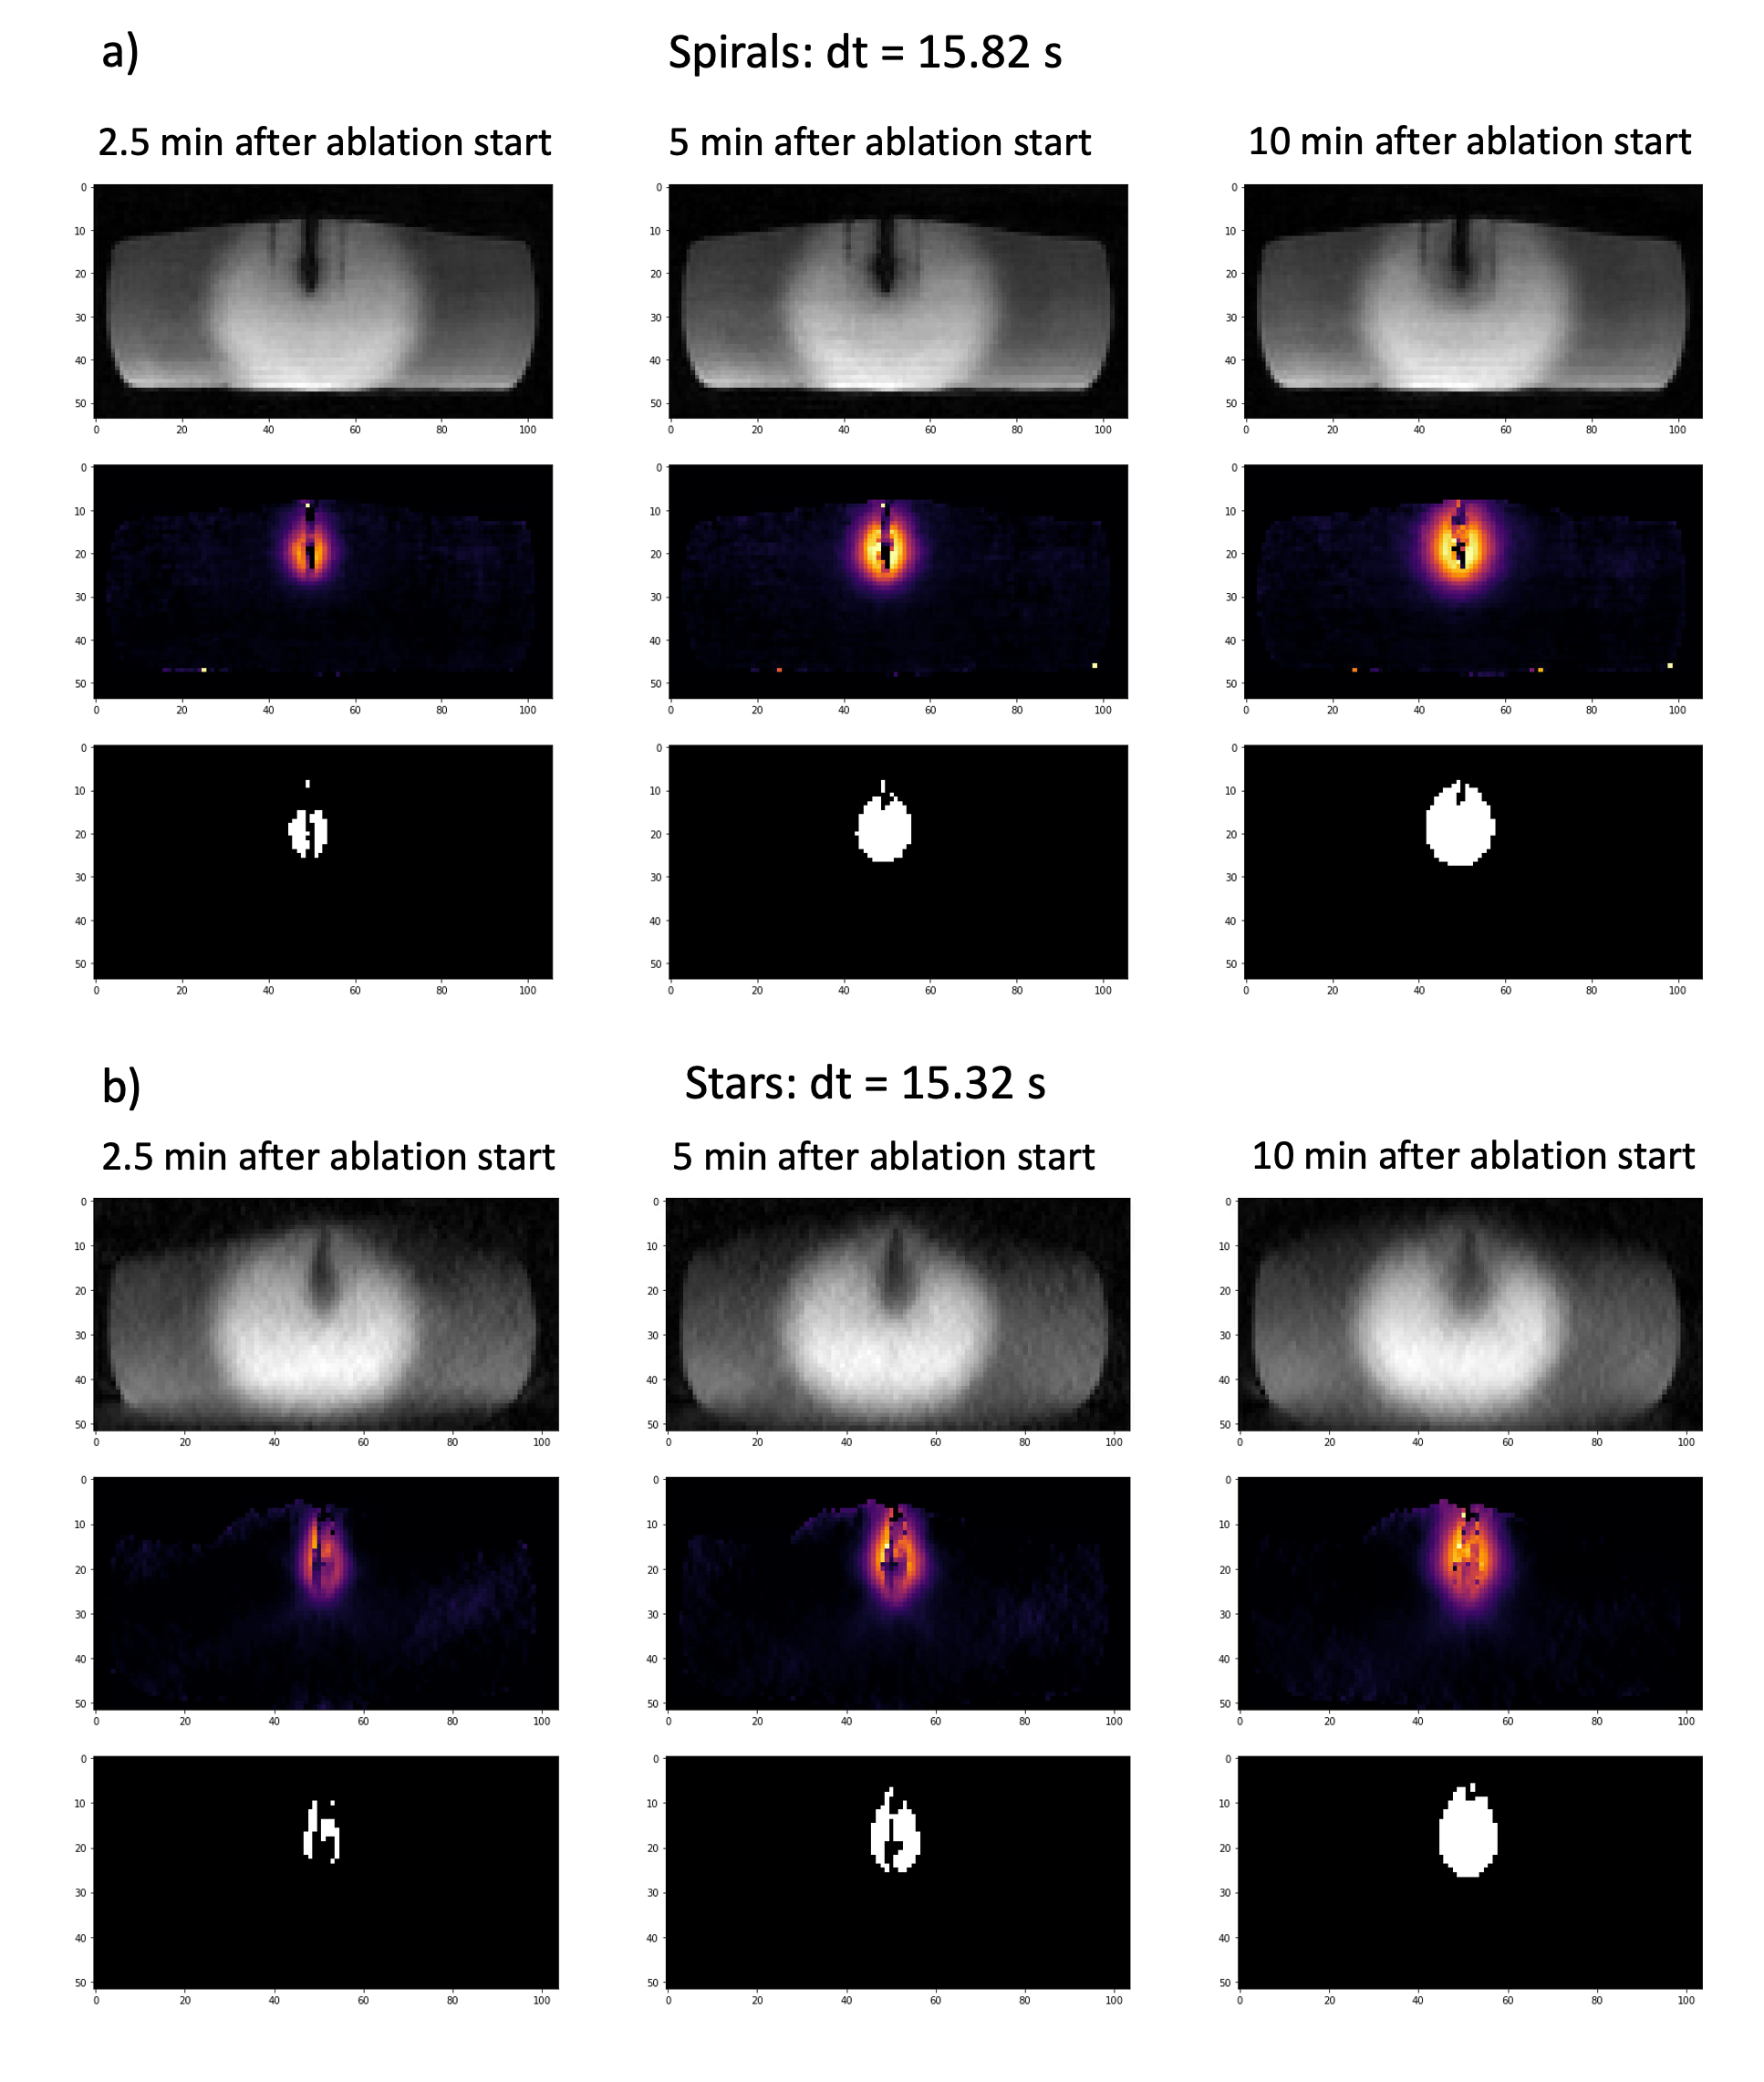
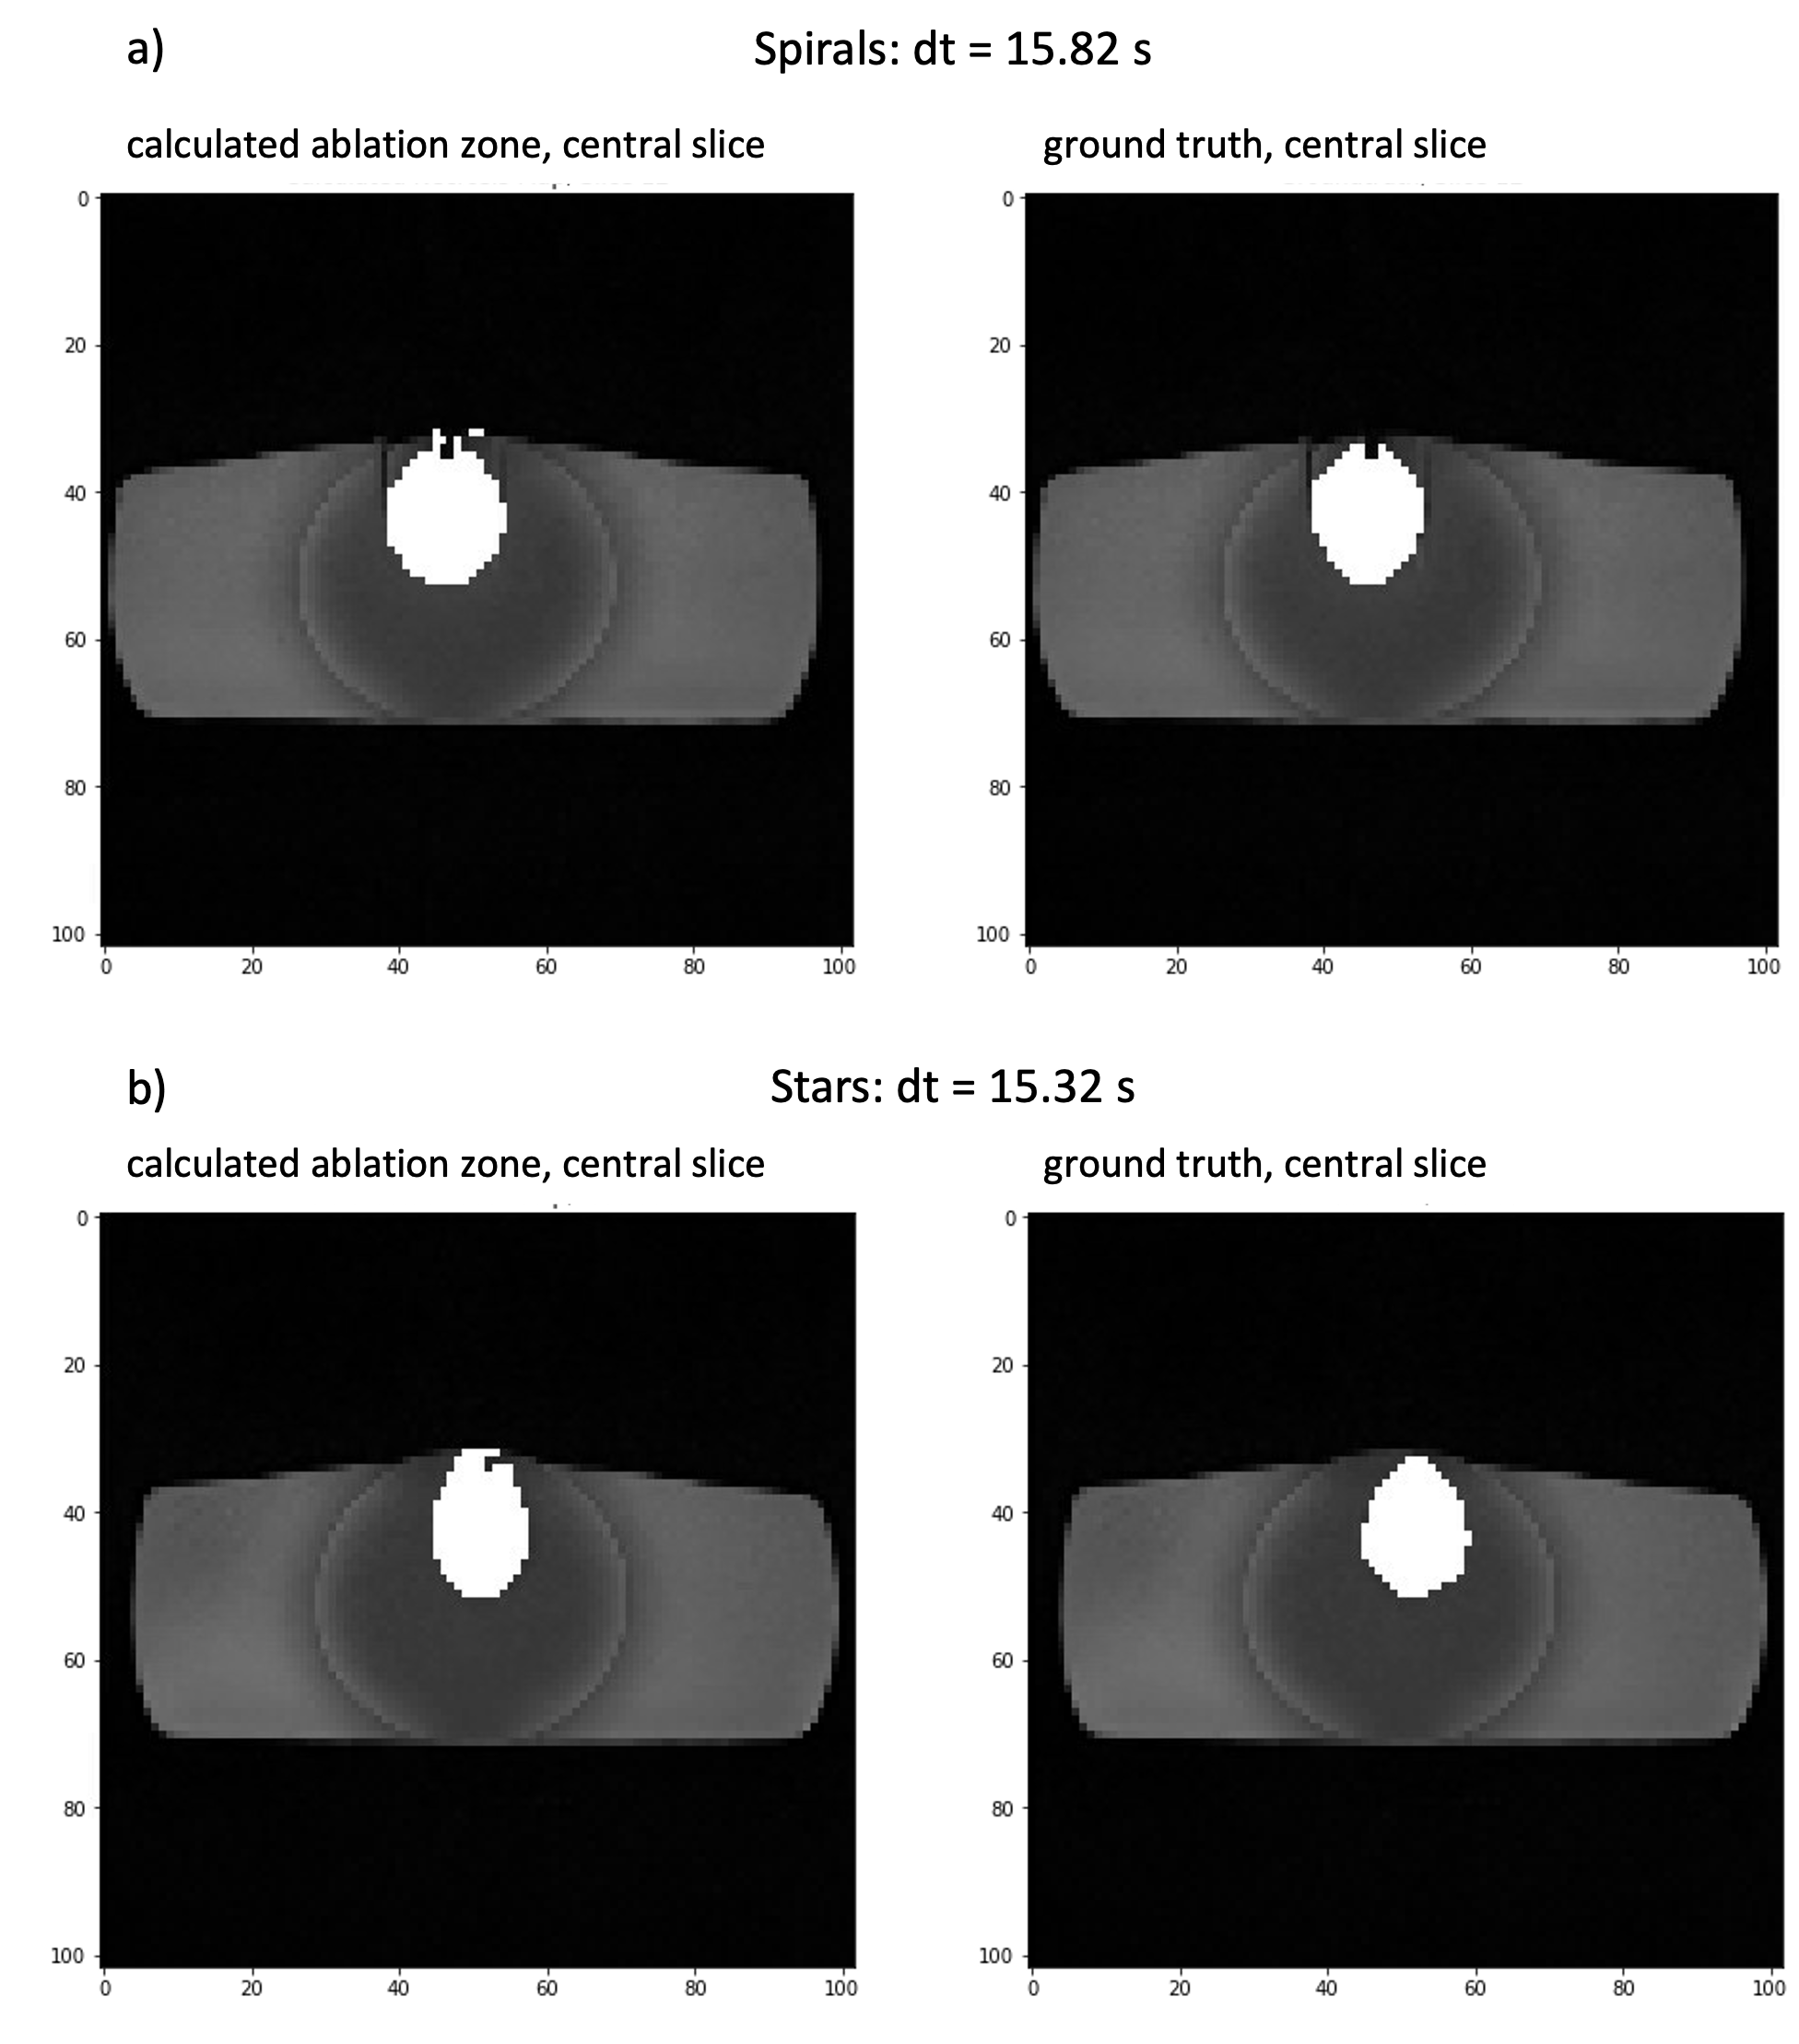
As table 1 shows, especially for lower temporal resolution, the mean temperature standard deviation in unheated areas (STD unh.) as well as the root mean square difference (RMS) of MR thermometry related to the temperature sensors (RMS S1, RMS S2) were lower for spiral than for stars. Figure 2 illustrates the temperature evolution of thermometry and corresponding sensors while Figure 3 gives an overview of magnitude images, temperature maps and ablation zones at different time points during ablation for the lowest temporal resolution. Figure 4 depicts the calculated ablation zone at the center slice of the ablation zone next to the corresponding segmented ground truth. Regarding the prediction of the ablation zone, spirals imaging provided a higher Dice-Score (DSC), lower false-positive-rate (FPR) and higher sensitivity in comparison to stars (see Table 1). The precision of all parameters decreases with increased temporal resolution. Apart from that, electromagnetic interferences of the MWG with the scanner do not hamper the results of MR thermometry.Discussion
The results suggest that spirals might be the superior choice for 3D thermometry for monitoring of abdominal microwave ablation. This is supported by the lower image quality of stars acquisition due to higher undersampling factors compared to spiral sampling. Low electromagnetic interferences indicate that the same setting can be used for clinical microwave ablations while performing MR thermometry.Conclusion
Our work indicates that a stack-of-spirals sequence has great potential for realizing a motion robust real-time 3D thermometry sequence during microwave ablation in a clinical setting. Further evaluation in a study of phantoms and in clinical application is needed to show the clinical benefit of 3D MR thermometry for monitoring of abdominal microwave ablation.Acknowledgements
The work of this paper is funded by the Federal Ministry of Education and Research within the Research Campus STIMULATE under the number 13GW0473A and 13GW0473BReferences
- SVEDIN, BT et al; Magn Reson Med 2018:79(3) 1407–1419
- J.H. Lee et al. Magnetic Resonance in Medicine 50(6): 1276-1285 (December 2003)
- K.R. Gorny, et al. Physica Medica 67, 2019: 91-99, 1120-1797
- BU-LIN, Z et al; International Journal of Hyperthermia 2008 24(7) 568–576
- Belker, O.A., et al. MR-Thermometry on Moving Organs by a Reproducible Respiratory Simulation, 6th IGIC, Mannheim 2023
- UECKER, M et al; Proc. Intl. Soc. Mag. Reson. Med. 23 (2015), S. 2486
- BLOCK, KT et al; In: Proceedings of the 19th Annual Meeting of ISMRM, Montreal, Canada (2011), S. 2816
- RIEKE, V et al; JMRI 2008 27(2) 376–390
- MADORE, B et al; Magn Reson Med 2011:66(3) 658–668
- PEARCE, JA et al; International Journal of Hyperthermia 29 (2013), Nr. 4, S. 262–280
Figures