4931
Diffusion-weighted imaging-based fluidography for assessing cerebrospinal fluid dynamics in the brains1Iwate Medical University, Yahaba, Japan
Synopsis
Keywords: Neurofluids, Brain
Motivation: Few study has developed the 3-D image like DTI-tractography to show tendency of CSF dynamic through the whole brain.
Goal(s): To develop DWI-fluidography for demonstrating tendency of CSF dynamic through the whole brain.
Approach: DWI with multiple b values and MPGs was scanned, and calculated a statistical variation of DWI signals obtained by different MPGs at each b value. The normalized value of the summation of all variations was defined as a value in a voxel for DWI-fluidography.
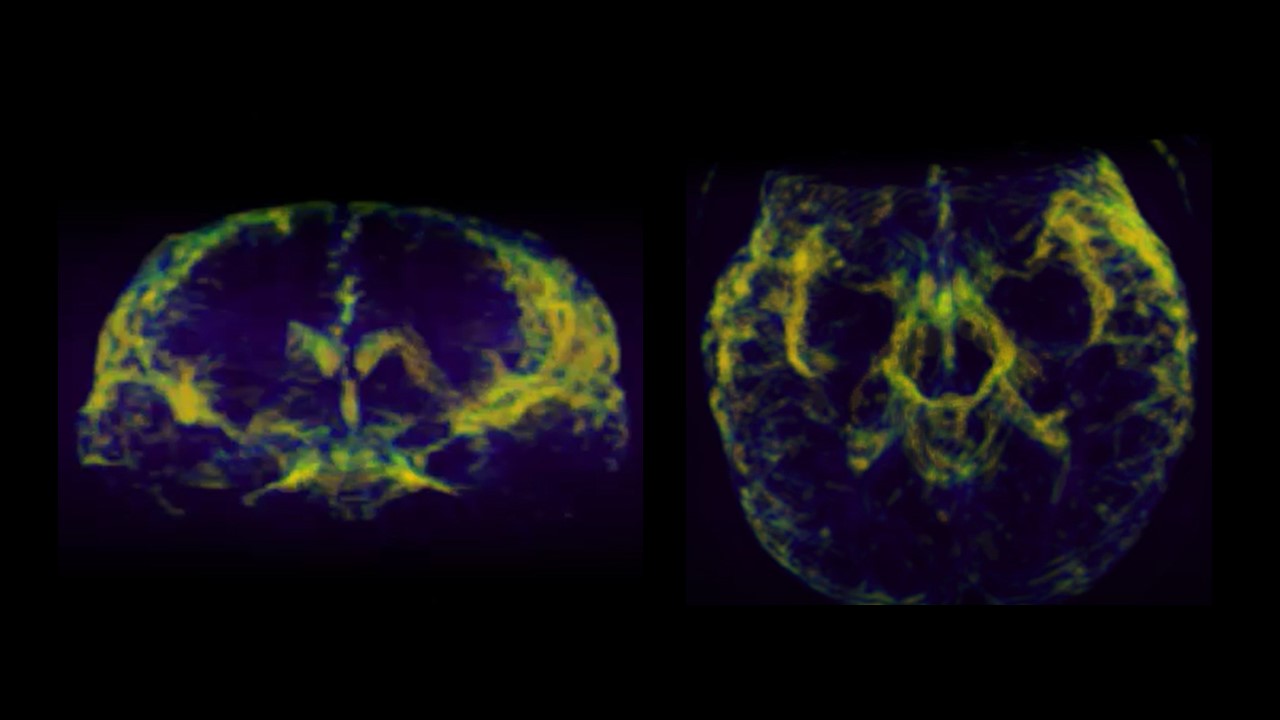
Results: The 3-D DWI-fluidography clearly showed differences of CSF dynamics at anatomical spaces filled with CSF, and the fluidography could reflect quantitative results with ADCs.
Impact: The DWI-fluidgraphy has the potential to help us to diagnose/find/investigate CSF-related diseases in the brain. Then, it may open the door to new research area.
Introduction
Diffusion-weighted imaging (DWI) was well-known as a tool for simultaneously estimating the microcirculation of blood in the capillary network and molecular water diffusion in brain tissues. In a recent report, CSF influx and reflux to the brain have been quantified using apparent diffusion coefficient (ADC) change obtained from DWI between pre- and post-ischemic stroke in mice.1 On the other hand, a study in humans demonstrated that diffusion tensor imaging (DTI), which is based on one of DWI features as multi-directional motion probing gradients (MPG), was used for analytically assessing the interstitial fluid,2 which is a type of CSF through the intra-brain.1, 3-5; however, few study has developed the three-dimensional (3-D) image like DTI-tractography to show tendency of CSF dynamics through the whole brain, with validating whether the 3-D image can reflect each ADC estimated in each anatomical cavity like the ventricle, cistern and subarachnoid space. The present study aimed to develop “DWI-fluidography”, which is based on DWI with multiple b values for demonstrating tendency of CSF dynamic through the whole brain.Methods
Thirteen healthy subjects participated in this study from April 2015 to July 2017. All MRI procedures were performed using a 7T-MRI system (Discovery MR950; GE Healthcare, Milwaukee, WI, USA) with a 32-channel head coil. For each subject, a single-shot spin-echo echo-planar imaging sequence was performed as DWI in the axial direction from the section showing the fastigium of the fourth ventricle to that showing both the primary motor area and the central sulcus using the following parameters: repetition time (TR)/echo time (TE): 5000/76.9 [ms]; matrix: 110 × 110; field of view: 220 × 220 [mm2]; slice thickness: 2.0 [mm] with no gap; 40 slices; nine b-values: 10, 20, 40, 80, 160, 320, 640, 1000, and 2000 [s/mm2] and non-diffusion-weighted image (b = 0 [s/mm2]); MPG: three orthogonal directions (1, 0, 0), (0, 1, 0), (0, 0, 1); number of excitations: 1. Zero-filling interpolation was applied to each slice, and the final in-plane resolution was 0.86 × 0.86 [mm2]. To clearly represent CSF dynamics on DWI-fluidography, we first calculated a statistical variation of DWI signals obtained by different MPGs at each b value. Then, all variations obtained at all b values were summed voxel-by-voxel. The summation value was normalized, and finally, the normalized value was defined as a value in a voxel for DWI-fluidography. For quantitative analysis, ADCC and ADCK were estimated using mono-exponential and kurtosis signal models for quantifying the CSF dynamics at the following twelve anatomical space: the subarachnoid space at a section showing the centrum semiovale over the roof of the lateral ventricle (SAS); anterior horns and trigones of the lateral ventricle (aLV and tLV, respectively) on the left and right sides; left and right foramina of Monro (FM); cistern of the velum interpositum (CVI); left and right Sylvian cisterns (SC); the quadrigeminal cistern (QC); and the fourth ventricle at the section showing the interpeduncular sulcus (FV). Mann-Whitney U test was performed with the significant level p<0.05. This prospective, observational study was approved by the Ethics Committee of our institute and all protocols was carried out in accordance with the approved guidelines and regulations.Results
Each dataset of 10 subjects (10 men; mean age, 31.8 ± 3.2 years; range, 28–39 years) was analyzed because three subjects were excluded due to the susceptibility artifacts. The 3-D DWI-fluidography clearly showed differences of CSF dynamics at anatomical spaces (Figure 1). In quantitative analysis, ADCC at SAS and aLV (median, interquartile range: SAS, 2.64, 2.44 – 2.80; aLV, 2.53, 2.41 – 2.83) was significantly lower than that at FM, CVI, QC, SC and FV (FM, 3.39, 3.26 – 3.56; CVI, 3.20, 3.02 – 3.38; QC, 3.32, 2.97 – 3.43; SC, 3.17, 3.11 – 3.22; FV, 3.23, 3.00 – 3.78), and that at tLV (2.91, 2.63 – 3.08) was significantly lower than that at FM (3.39, 3.26 – 3.56). Then, ADCK at SAS and aLV (SAS, 3.11, 2.90 – 3.64; aLV, 3.01, 2.96 – 3.16) was significantly lower than that at tLV, FM, CVI, QC and SC (tLV, 3.73, 3.28 – 4.54; FM, 5.98, 5.07 – 7.02; CVI, 3.82, 3.52 – 4.72; QC, 4.29, 3.04 – 4.79; SC, 5.80, 4.62 – 6.15), and that at FV (8.51, 6.93 – 9.96) was significantly higher than at the other spaces. In addition, ADCK at FM and SC was significantly higher than that at tLV, CVI and QC. Consequently, the DWI-fluidography could reflect quantitative results with ADCs.Conclusion
The 3-D DWI-fluidography could demonstrate tendency of CSF dynamic through the whole brain.Acknowledgements
No acknowledgement found.References
- Mestre H, Du T, Sweeney AM, et al. Cerebrospinal fluid influx drives acute ischemic tissue swelling. Science. 2020; 367.
- Taoka T, Masutani Y, Kawai H, et al. Evaluation of glymphatic system activity with the diffusion MR technique: diffusion tensor image analysis along the perivascular space (DTI-ALPS) in Alzheimer's disease cases. Jpn J Radiol. 2017; 35:172-178.
- Rasmussen MK, Mestre H, Nedergaard M. The glymphatic pathway in neurological disorders. Lancet Neurol. 2018; 17:1016-1024.
- Tarasoff-Conway JM, Carare RO, Osorio RS, et al. Clearance systems in the brain-implications for Alzheimer disease. Nat Rev Neurol. 2015; 11:457-470.
- Iliff JJ, Wang M, Liao Y, et al. A paravascular pathway facilitates CSF flow through the brain parenchyma and the clearance of interstitial solutes, including amyloid beta. Sci Transl Med. 2012; 4:147ra111.
Figures