4922
Improvement of Glymphatic System Using Low-Intensity Focused Ultrasound (LIFU) for Lymphatic Enhancement1Interdisciplinary Program in Cancer, Seoul National University, Seoul, Korea, Republic of, 2Department of Radiology, Seoul National University Hospital, Seoul, Korea, Republic of, 3Center for Nanoparticle Research, Institute for Basic Science (IBS), Seoul, Korea, Republic of, 4Department of Biomedical Engineering, Sungkyunkwan University, Suwon, Gyeonggi-do, Korea, Republic of
Synopsis
Keywords: Neurofluids, Brain, Glymphatic system, Low-Intensity Focused Ultrasound, Lymphatic Enhancement, Contrast-enhanced MRI
Motivation: Enhanced lymphatic flow may improve the glymphatic system for metabolic waste clearance from the brain.
Goal(s): Our goal was to demonstrate that stimulating the lymphatics can enhance the glymphatic system.
Approach: We introduced low-intensity focused ultrasound (LIFU) to enhance the lymphatics and assessed the glymphatic system in rats by visualizing signal changes in contrast-enhanced MRI.
Results: The LIFU group exhibited a more rapid increase and decrease in signal intensity compared to the control group.
Impact: Lymphatic enhancement using LIFU could influence the improvement of the glymphatic system. This enhancement could positively affect cognitive function, with potential implications for preventing and treating neurodegenerative diseases.
Introduction
The glymphatic system plays a crucial role in the brain, serving as a pathway for the clearance of metabolic waste1. Lymphatics, an essential component of the glymphatic system, function as conduits for draining cerebrospinal fluid (CSF), effectively filtering out and removing toxic molecules2. Hotspots in the meningeal lymphatic vessels located in the basal region of the brain have been identified to accumulate CSF and facilitate its drainage3. We propose a novel approach that employs mechanical stimulation using a low-intensity focused ultrasound (LIFU) enhancer to stimulate lymphatics aiming to enhance the glymphatic system4. The impact of this research lies in its potential to improve waste clearance and cognitive functions, which could hold significant implications for both the prevention and treatment of neurodegenerative diseases5.Methods
Experiment protocolsOur animal study received approval from the Institutional Animal Care and Use Committee. MR imaging was conducted using a 3.0T MRI scanner (MR Solutions, Guildford, UK) on six normal Sprague-Dawley rats. A solution comprising a 1:1 mixture of artificial CSF and Gd-DOTA was intracisternally injected at a volume of 30µl with an infusion rate of 2µl/min. LIFU stimulated the lymphatics for 15 minutes at hourly intervals across four sessions. To visualize the distribution changes of the contrast agents, T1-weighted images were acquired hourly for 24 hours post-contrast agent injection. The T1-weighted images utilized a 3D FLASH sequence (TR = 20 ms and TE = 4.9 ms), a flip angle of 15 degrees, and a spatial resolution of 0.23×0.18×0.39 mm3.
Data processing and analysis
Time-series T1-weighted images were normalized against the surrounding muscle tissue of the brain using ImageJ software. Within these images, average signal values were calculated from two selected ROIs in the cerebral cortex. Signal intensity changes were quantified as a ratio relative to the cerebral cortex's average baseline signal intensity. This quantification was carried out by subtracting time-series signals from the baseline and dividing by the peak-to-baseline signal intensity difference. For statistical comparison, a control group not subjected to stimulation under identical conditions was contrasted with the LIFU group.
Results
Representative time-series T1-weighted images for the control and LIFU groups are presented in Figure 1. In both groups, an initial signal enhancement in the hypothalamus region is observed at 0.5 hours, which spreads to the brain parenchyma by 4 hours. A trend towards a return to baseline levels is observed thereafter. Quantitative analysis of the signal changes in the cerebral cortex confirms the trend observed in the images of Figure 1, with the LIFU group showing a more rapid increase and decrease in signal intensity compared to the control group (Fig.2). The peak of the graph for the LIFU group occurs at 5 hours, which precedes the peak of the control group at 8 hours in Figure 2. A statistical comparison between the two groups within the time ranges of 3-7 hours and 7-11 hours reveals significant differences, with the LIFU group’s peak occurring within the former range and the control group’s peak within the latter (Fig.3). Additionally, both groups exhibit statistical significance after 8 hours.Discussion
Previous research using focused ultrasound to stimulate specific brain regions has shown promise in treating psychiatric illness, highlighting the role of mechanical stimuli in neuromodulation6,7. These studies indicate that LIFU can modulate brain activity. Our study examines the effects of LIFU-induced lymphatic stimulation on the glymphatic system. The glymphatic system is characterized by the convective inflow of CSF within periarterial spaces and the outflow towards perivenous spaces, facilitated by the egress of CSF from the brain parenchyma, which can be visualized using injected contrast agents in the central nervous system8. Time-series contrast-enhanced T1-weighted images provide a visual representation of this system in Figure 1. Figure 2 demonstrates a notable increase followed by a decrease in signal intensity within the brain, offering the evaluation of the glymphatic system9,10. The earlier rapid peak and decline in signal intensity in the LIFU group imply an enhanced function of glymphatic system in response to stimulation for lymphatics enhancement (Fig.2). Figure 3 additionally shows statistically significant differences in glymphatic system activity over numerous time ranges when comparing the two groups, with the LIFU group exhibiting improved activity. However, our study is limited by a small sample size of three subjects per group, indicating the need for a larger cohort to increase statistical confidence.Conclusion
In conclusion, our findings suggest that LIFU can effectively enhance the lymphatic system, thereby improving glymphatic system. This enhancement has the potential to positively impact cognitive functions, which may have significant implication for the prevention and treatment of neurodegenerative diseases.Acknowledgements
This study was supported by Samsung Research Funding & Incubation Center of Samsung Electronics under Project Number SRFC-IT2201-04 and by the Institute for Basic Science (IBS-R006-A1)
We would like to thank Gi Eun Hong for their invaluable assistance with data collection and analysis.
References
1. Jessen NA, Munk ASF, Lundgaard I, Nedergaard M. The Glymphatic System: A Beginner’s Guide. Neurochem Res. 2015;40(12):2583-2599. doi:10.1007/s11064-015-1581-6
2. Benveniste H, Lee H, Volkow ND. The Glymphatic Pathway: Waste Removal from the CNS via Cerebrospinal Fluid Transport. Neuroscientist. 2017;23(5):454-465. doi:10.1177/1073858417691030
3. Ahn JH, Cho H, Kim JH, et al. Meningeal lymphatic vessels at the skull base drain cerebrospinal fluid. Nature. 2019;572(7767):62-66. doi:10.1038/s41586-019-1419-5
4. Bystritsky A, Korb A, Douglas P, et al. A review of low-intensity focused ultrasound. Brain stimulation. 2011;4:125-136. doi:10.1016/j.brs.2011.03.007
5. Rasmussen MK, Mestre H, Nedergaard M. The glymphatic pathway in neurological disorders. The Lancet Neurology. 2018;17(11):1016-1024. doi:10.1016/S1474-4422(18)30318-1
6. Lee Y, Choi Y, Park EJ, et al. Improvement of glymphatic-lymphatic drainage of beta-amyloid by focused ultrasound in Alzheimer’s disease model. Sci Rep. 2020;10(1):16144. doi:10.1038/s41598-020-73151-8
7. Baek H, Pahk KJ, Kim H. A review of low-intensity focused ultrasound for neuromodulation. Biomed Eng Lett. 2017;7(2):135-142. doi:10.1007/s13534-016-0007-y
8. Iliff JJ, Wang M, Liao Y, et al. A Paravascular Pathway Facilitates CSF Flow Through the Brain Parenchyma and the Clearance of Interstitial Solutes, Including Amyloid β. Sci Transl Med. 2012;4(147). doi:10.1126/scitranslmed.3003748
9. Taoka T, Naganawa S. Glymphatic imaging using MRI. J Magn Reson Imaging. 2020;51(1):11-24. doi:10.1002/jmri.26892
10. Iliff JJ, Lee H, Yu M, et al. Brain-wide pathway for waste clearance captured by contrast-enhanced MRI. J Clin Invest. 2013;123(3):1299-1309. doi:10.1172/JCI67677
Figures
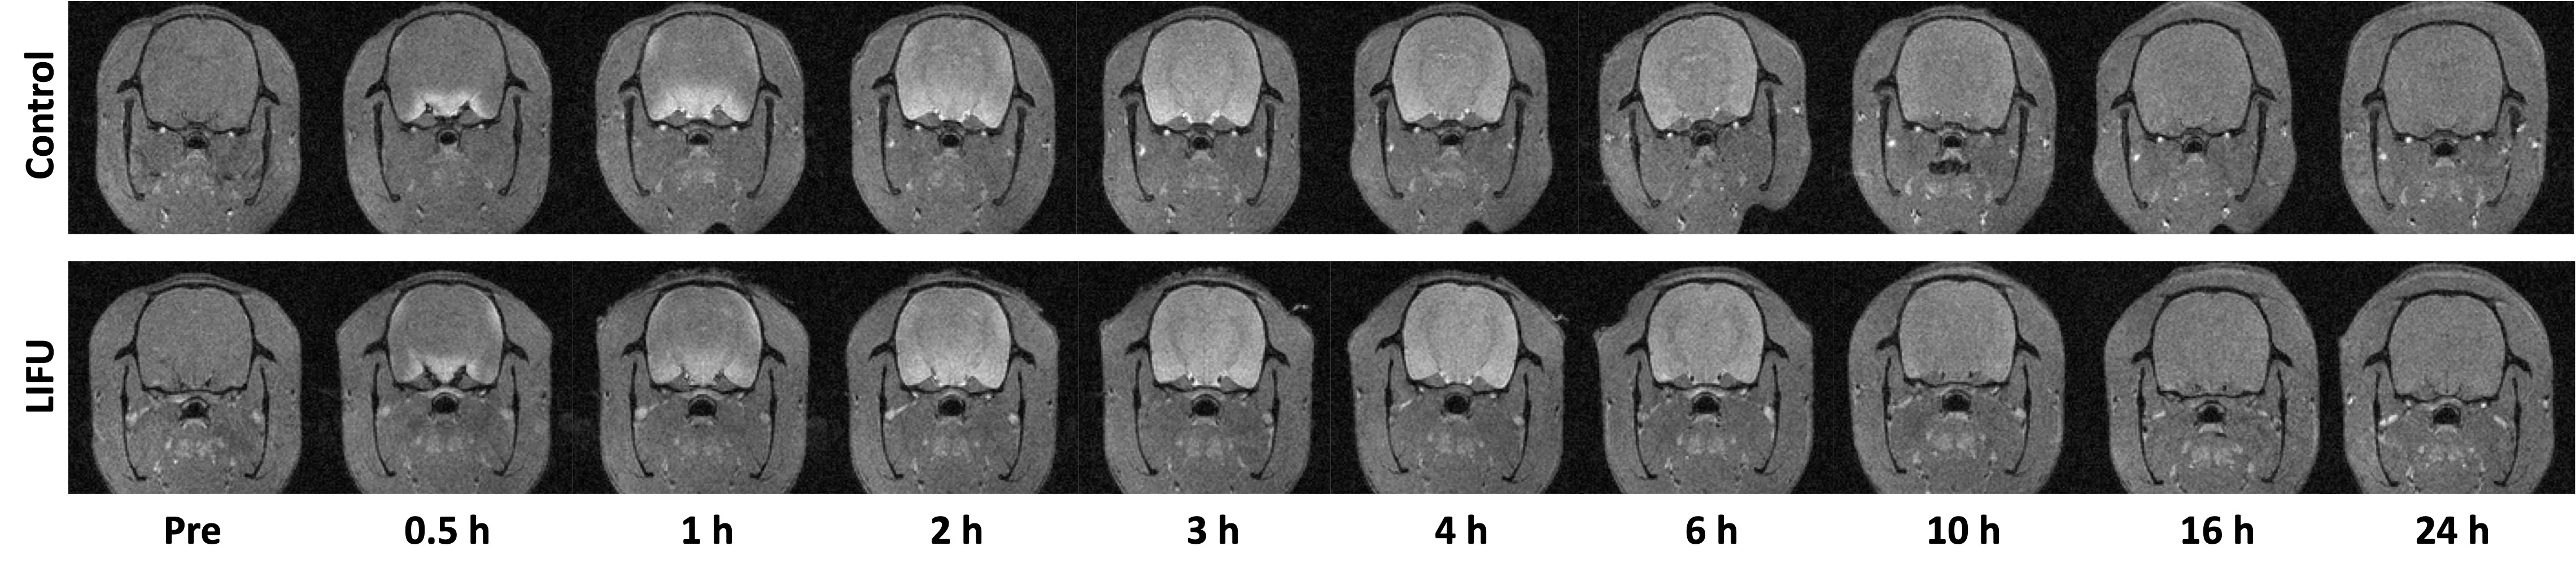
Figure 1. Time-Series T1-Weighted MRI Comparisons Between Control and LIFU Groups. Sequential T1-weighted magnetic resonance images demonstrating the temporal progression of signal intensity in the control (top row) and LIFU (bottom row) groups. Images captured pre-treatment and at various post-treatment intervals (0.5h, 1h, 2h, 3h, 4h, 6h, 10h, 16h, and 24h) display the changes within the brain.
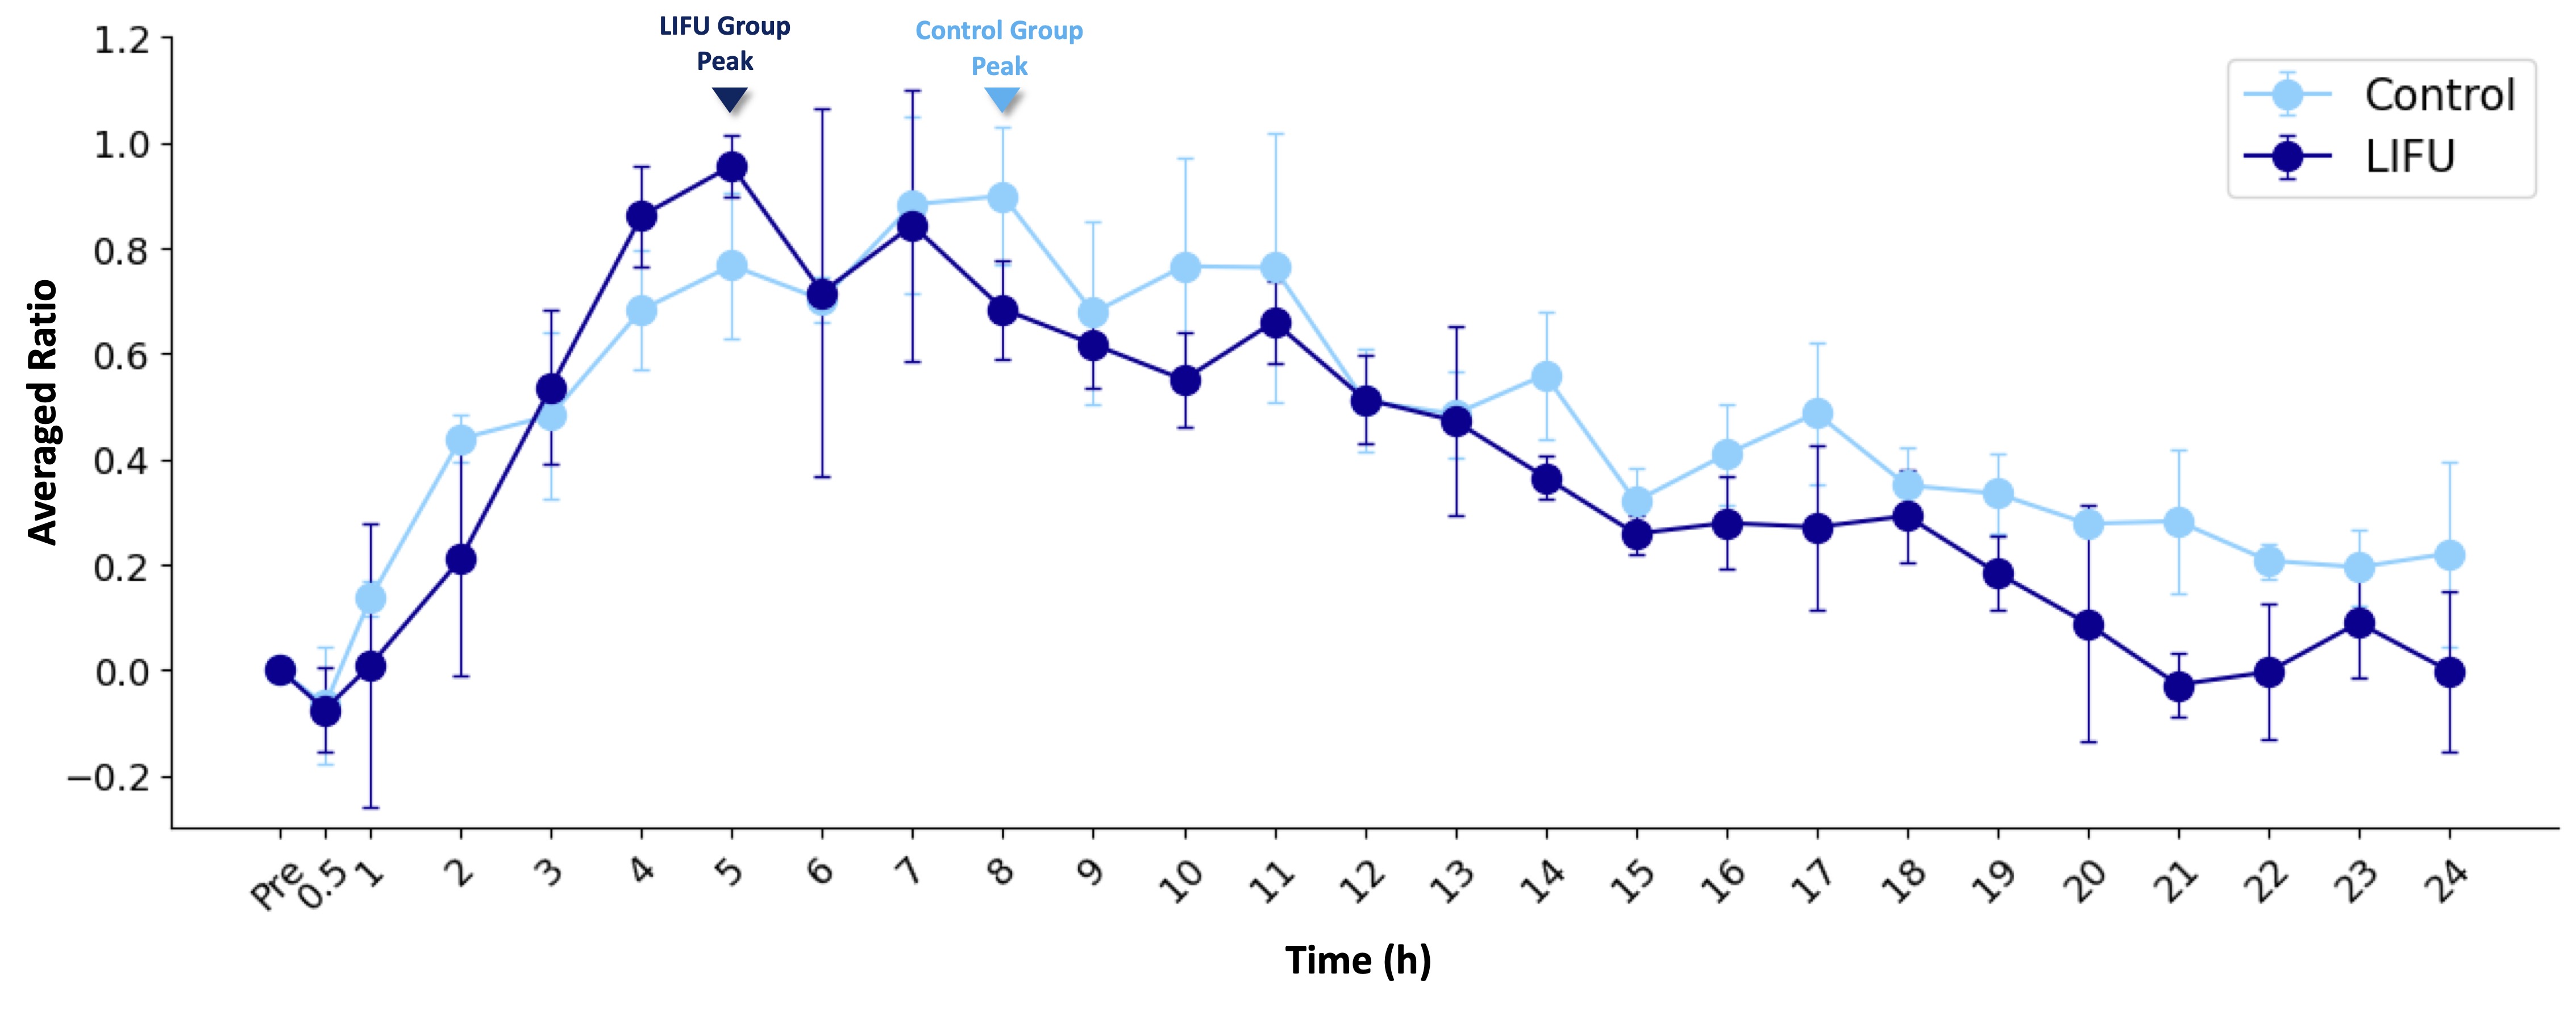
Figure 2. Quantitative Signal Intensity Analysis over Time for Control and LIFU Groups. Graphical representation of the averaged ratio from signal intensities over time in the cerebral cortex, comparing control (light blue) and LIFU (dark blue) groups. Data points are shown with error bars indicating standard deviation, highlighting the peaks for LIFU and control groups at 5 and 8 hours, respectively. The graph illustrates a more rapid increase to peak and subsequent decrease in the LIFU group.
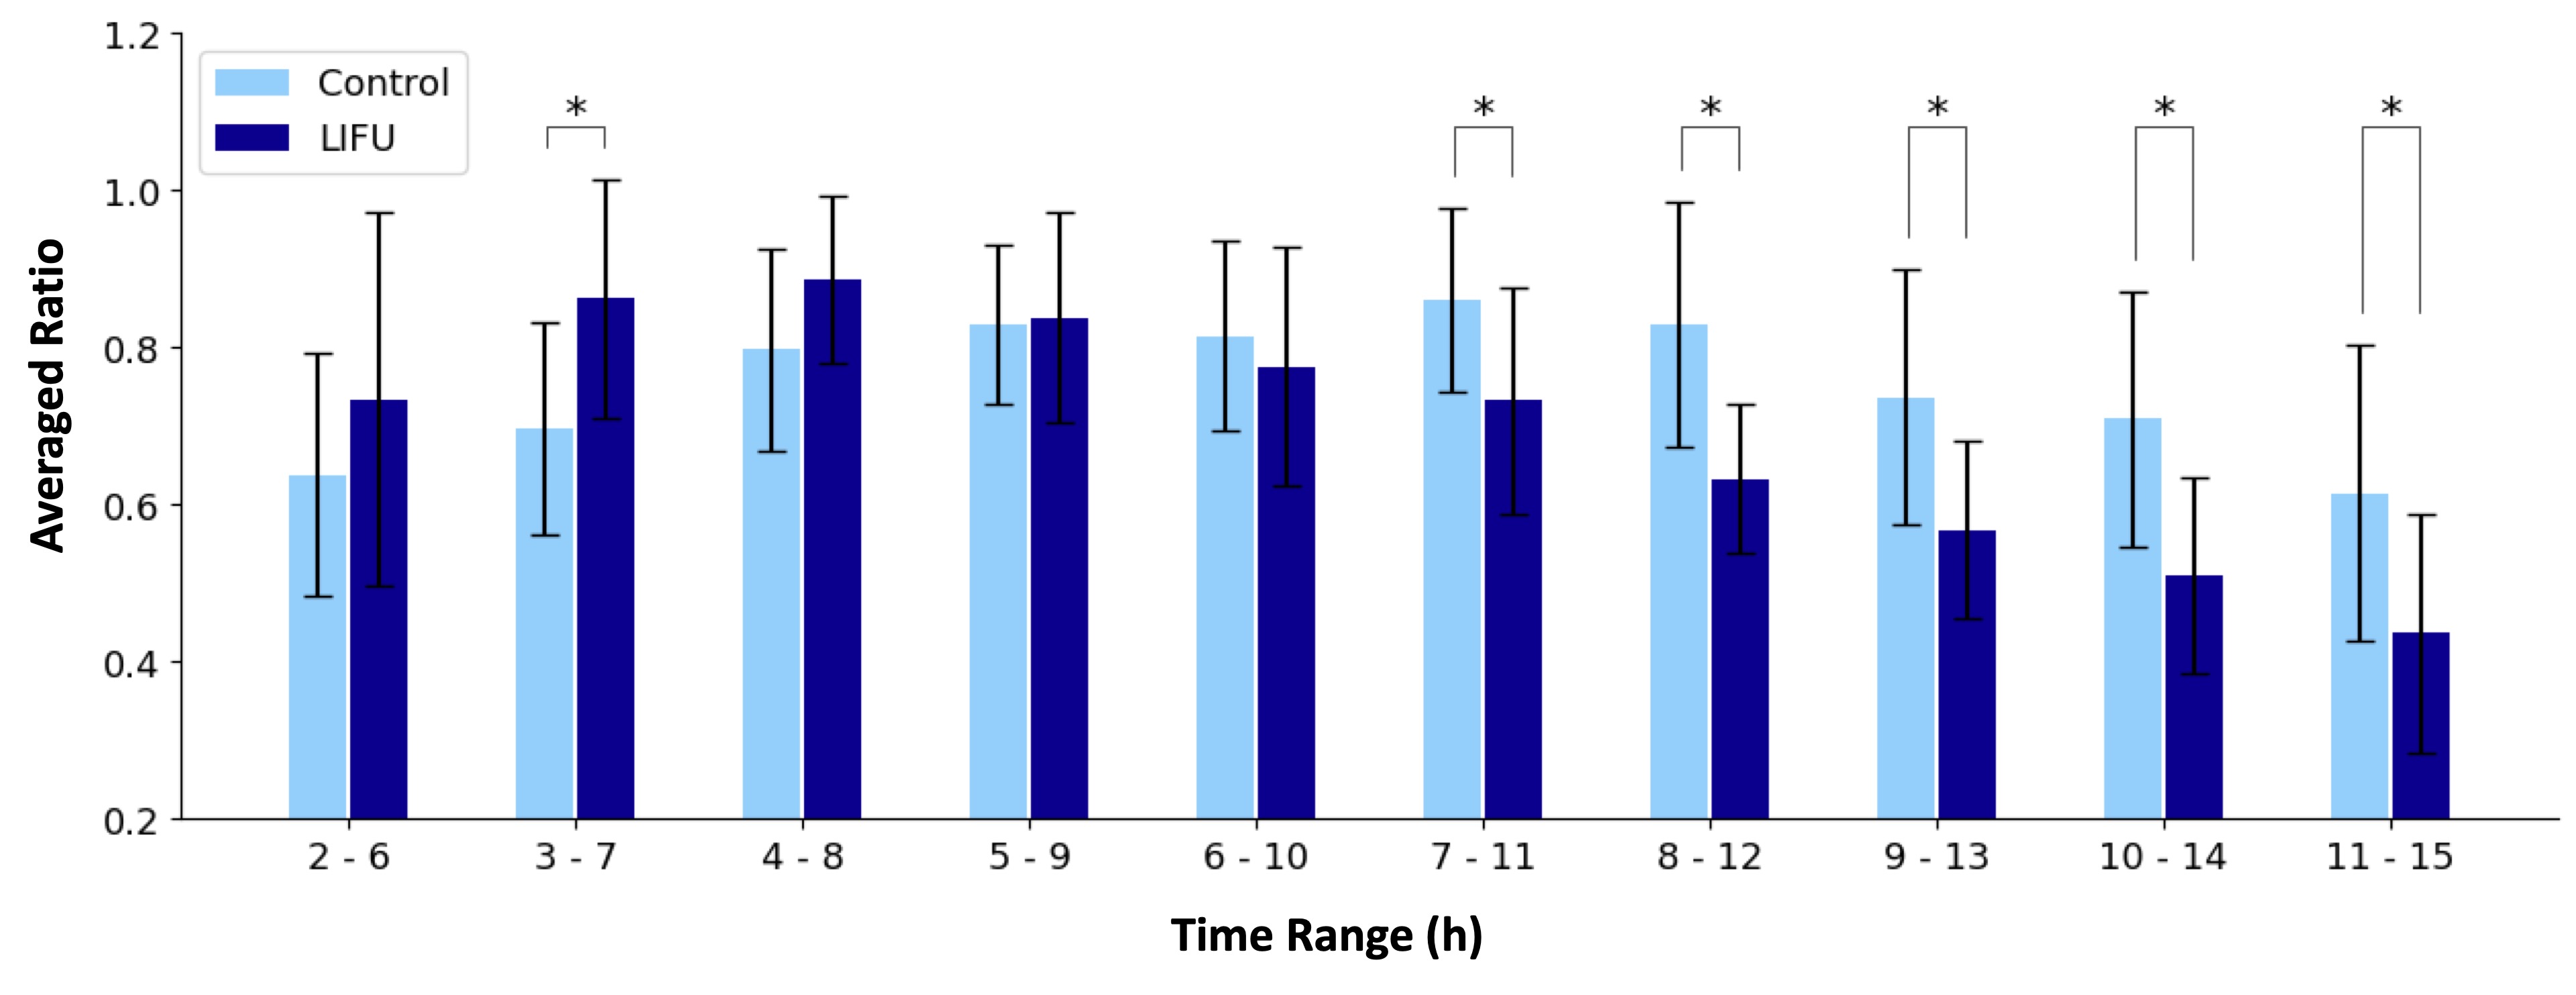
Figure 3. Comparative Statistical Analysis of Glymphatic System Activity Across Time Ranges. This bar chart compares the averaged ratio between control and LIFU groups across various time ranges after stimulation. The light blue bars represent the control group, while the dark blue bars denote the LIFU group, with their respective averaged ratio. Error bars indicate standard deviations. Asterisks (*) above the bars signify time ranges where the differences in activity are statistically significant (P-values ≤ 0.05).