4915
Adiabatic T1rho-mapping of subacute myocardial ischemia with ultra-short echo time 3-D imaging in ex vivo mice1A.I. Virtanen Institute for Molecular Sciences, University of Eastern Finland, Kuopio, Finland, 2Department of Technical Physics, University of Eastern Finland, Kuopio, Finland
Synopsis
Keywords: Myocardium, Quantitative Imaging, Ex vivo applications, High field MRI, Small animals, Ischemia, Preclinical imaging
Motivation: Conventional CMR techniques have many limitations, such as slowness and inability to provide contrast-agent free 3-D assessments of myocardium in the cardiac diseases.
Goal(s): The aim of this study is to develop a faster, high-resolution 3-D CMR imaging method for quantitative imaging of the myocardium after myocardial infarction (MI).
Approach: Mice hearts were imaged ex vivo 7 days after the factitious MI by using an ultra-short echo time 3-D T1ρ technique (MB-SWIFT-CS).
Results: The T1ρ relaxation times were elevated in the infarct area. The findings were validated by 2-D CMR maps and histopathology to confirm ischemia, edema, and fibrosis in the myocardium.
Impact: This study presents a quantitative ultra short echo time 3-D CMR method for ex vivo assessment of myocardium after factitious myocardial infarction in mice. The method allowed rapid comprehensive 3-D myocardial evaluation by utilizing compressed sensing and relaxation time mapping.
Introduction
According to World Health Organization (WHO), in 2017, nearly 19 million people died due to cardiovascular diseases1. Cardiac magnetic resonance (CMR) is an important tool for the assessment of various cardiac conditions, such as after myocardial infarction (MI). Gold stantard CMR relies on quantitative multi-slice 2-D imaging2, with many limitations, such as relatively thick slices and lengthy acquisition. Thus, some small ischemia-induced changes might remain undetected. Therefore, 3-D CMR mapping methods with isotropic resolution are urgently needed. In this study, we present quantitative, ultra-short echo time 3-D adiabatic T1ρ Multi-Band SWeep Imaging with Fourier Transform3 and Compressed Sensing4 (MB-SWIFT-CS) technique for accelerating imaging in MI mice hearts ex vivo.Materials and Methods
The hearts of C57BL (n = 8) mice were collected 7 days after Left Anterior Descending (LAD) Coronary Artery in Ligation, fixated 4% PFA in PBS and imaged in Galden with adiabatic T1ρ weighted MB-SWIFT-CS MRI.For T1ρ determination, a train of frequency-modulated adiabatic full-passage (AFP) preparation pulses were used as presented earlier5. Eight 3-D MB-SWIFT images were acquired with spin-lock durations of [0 4 8 12 16 20 24 28] ms, using magnetization preparation (MP) blocks with increasing number (n = 0 to 7) of MLEV-4 phase cycled sets of 4 AFP pulses (HS1R10), with a single pulse duration t180 of 1 ms. The other imaging parameters were TR 2.96 ms, flip angle 3o, field of view 25 mm3 and matrix size 2563. Eventually, altogether 6553 spokes per image were used in the CS image reconstruction, corresponding to a total scan time of 3.4 min.For comparison, a single 1 mm thick short axis slice was selected from lower mid level of the heart and imaged with 2-D FSE sequence with Hahn double echo T2 and adiabatic T1ρ -mapping methods. For 2-D measurements, 4 weighted images with FOV of 20mm2, resolution 1922, RF pulse power of 1250 Hz and pulse duration of 4.5 ms (T2) or 2 ms (HS4, T1ρ) were used.
Relaxation time maps were calculated using monoexponential fitting with MATLAB R2022b (MathWorks Inc., Natick, CA, USA) and Aedes (http://aedes.uef.fi). For region of interest (ROI) analysis, damaged and remote areas were determined from 2-D T1ρ and T2 relaxation time maps and drawn to corresponding anatomical 3-D images, and subsequently used to collect the T1ρ relaxation times. Standard histological processing and paraffin embedding were used, with 4 μm thick sections cut from base to apex and stained with Hematoxylin-Eosin and Sirius Red. Edema was studied by digitally quantifying the empty extracellular space in the myocardium and comparing the percentage of the septum edema area of the MI hearts to the septum of healthy hearts using Fiji image processing software6. The stained sections were photographed using a Nikon Eclipse microscope with a Ds-Ri2 camera (Nikon Instruments Europe BV).
Results
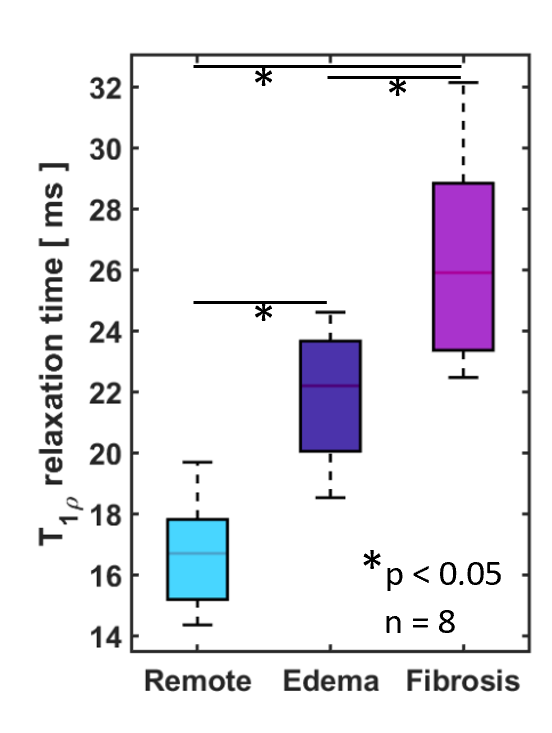
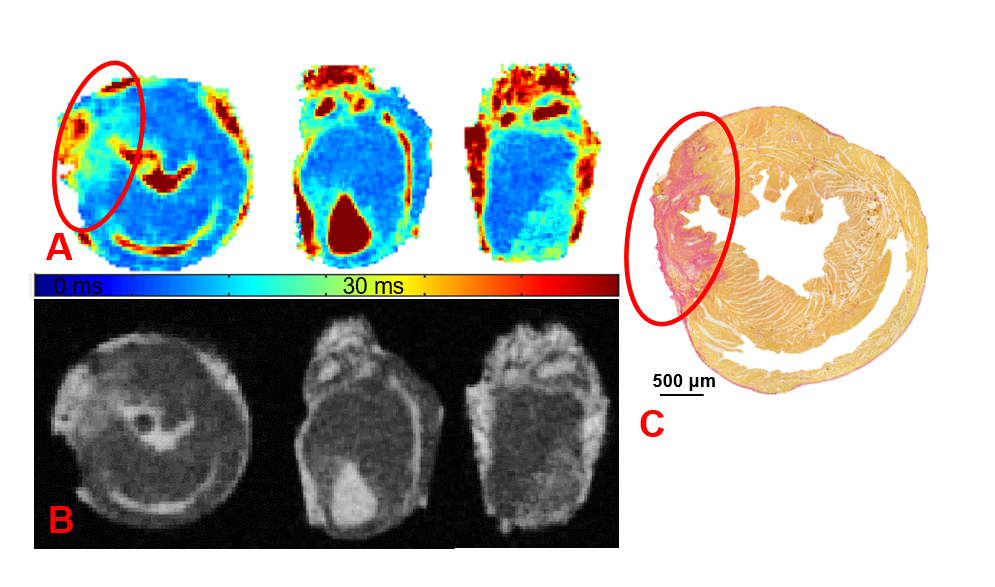
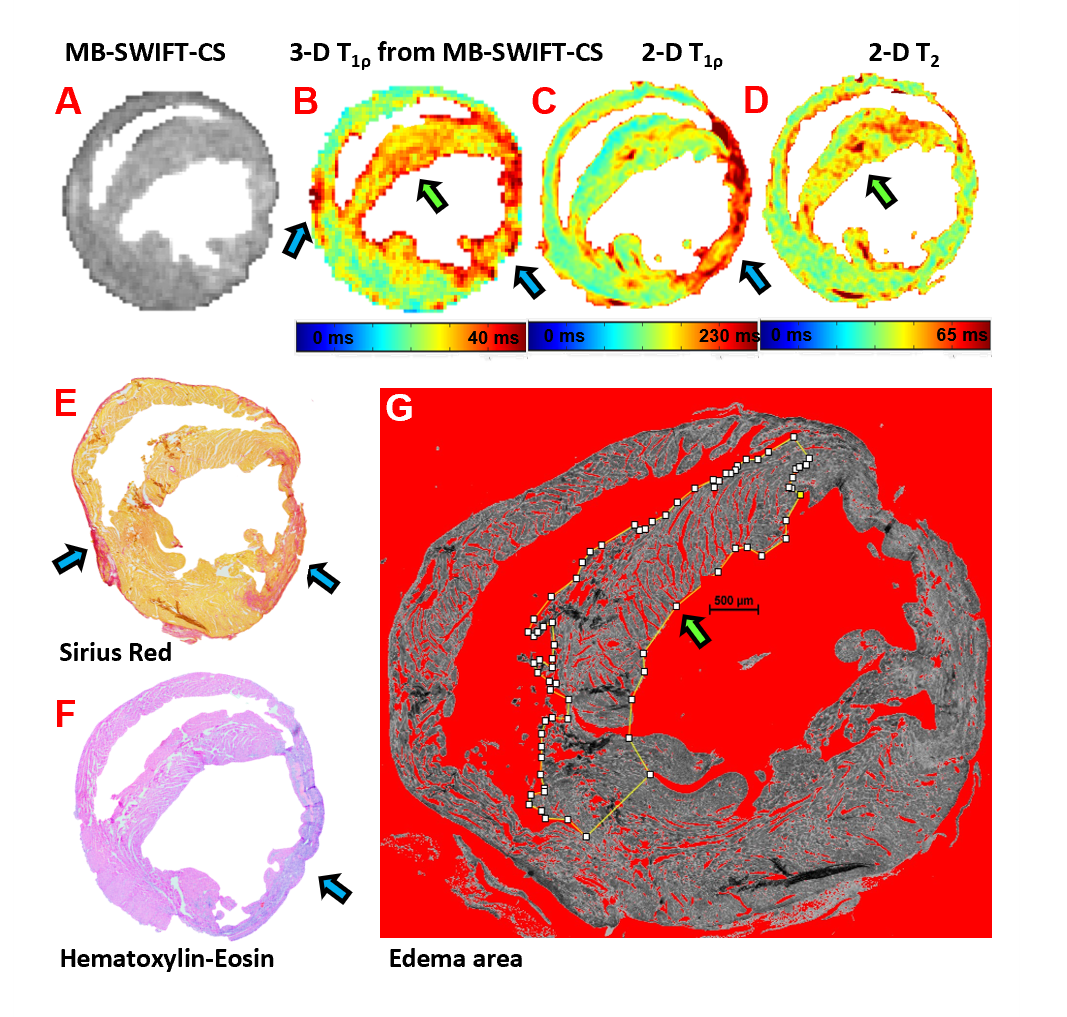
T1ρ relaxation time values were elevated in the damaged areas (p<0.05) (Fig. 1). The values in the myocardium were 17±1.8 ms (remote), 22±2.2 ms (edema), and 26±3.5 ms (fibrosis). Ischemic areas could also be observed visually in the 3-D T1ρ, 2-D T2 and T1ρ maps compared to remote areas (Fig. 2). Sirius Red staining showed increased collagen formation in the infarct area in the anterior wall of the left ventricle, supporting the CMR findings . Hematoxylin-Eosin showed loss of cardiomyocytes and coronary capillaries, and infiltration of inflammatory cells. Compared to healthy hearts, digital thresholding indicated significant edema-related changes in the septum of the MI hearts (Fig. 3).Discussion
As expected, adiabatic T1ρ relaxation time values were elevated in the ischemic areas due to the fibrosis7, which was confirmed with histology. However, we observed elevated T1ρ values in the septum, which could not be connected to the histological findings or 2-D T1ρ findings. Therefore, further investigation was needed. It is known, that T2 is sensitive to myocardial edema8, which cannot be determined with post-mortem stainings. Additionally, due to the almost zero echo time, MB-SWIFT is sensitive to very short T2 values9. For that reason, we wanted to compare those findings to findings of 2-D T2 maps. It was found that both T2 and T1ρ MB-SWIFT-CS values were elevated in the septum. Additionally, digital analysis revealed empty space between the myocytes, associated with initial edema in the septum, which supports our findings.CS translated well to MB-SWIFT, enabling shorter acquisition time. The results indicated that the relaxation time weighted MB-SWIFT-CS is an accurate tool for imaging ischemic changes in the myocardium quantitatively, three-dimensionally and in accelerated way.
Conclusion
With this method, we were able to determine MI and remote areas with novel fast quantitative 3-D assessment.Acknowledgements
This study was supported by The Finnish Foundation for Cardiovascular Research, Orion Research Foundation, Urho Känkänen Foundation, GeneCellNano Flagship project, Olvi Foundation and Päivikki and Sakari Sohlberg Foundation and the Academy of Finland projects #325146 and #354693. Additionally, authors thank the Kuopio Biomedical imaging unit (BIU) for providing infrastructure for this study.References
[1] WHO CVD Risk Chart Working Group (2019). World Health Organization cardiovascular disease risk charts: revised models to estimate risk in 21 global regions. The Lancet. Global health, 7(10), e1332–e1345. [2] Kramer, C.M., Barkhausen, J., Bucciarelli-Ducci, C. et al. Standardized cardiovascular magnetic resonance imaging (CMR) protocols: 2020 update. J Cardiovasc Magn Reson 22, 17 (2020). [3] Idiyatullin D, Corum CA, Garwood M. Multi-Band-SWIFT. J Magn Reson. 2015 Feb;251:19-25 [4] Donoho, D.L. (2004) “Compressed Sensing. Information Theory,” IEEE Transactions on, 52(4), 1289-13065 [5] Zhang, J., Nissi, M. J., Idiyatullin, D., Michaeli, S., Garwood, M., & Ellermann, J. (2016). Capturing fast relaxing spins with SWIFT adiabatic rotating frame spin-lattice relaxation (T1ρ) mapping. NMR in biomedicine, 29(4), 420–430. [6] Schindelin, J., Arganda-Carreras, I., Frise, E. et al. Fiji: an open-source platform for biological-image analysis. Nat Methods 9, 676–682 (2012). [7] Thompson, E.W., Kamesh Iyer, S., Solomon, M.P. et al. Endogenous T1ρ cardiovascular magnetic resonance in hypertrophic cardiomyopathy. J Cardiovasc Magn Reson 23, 120 (2021). [8] Abdel-Aty, H., Zagrosek, A., Schulz-Menger, J., Taylor, A. J., Messroghli, D., Kumar, A., Gross, M., Dietz, R., & Friedrich, M. G. (2004). Delayed enhancement and T2-weighted cardiovascular magnetic resonance imaging differentiate acute from chronic myocardial infarction. Circulation, 109(20), 2411–2416. [9] Idiyatullin D, Corum C, Park J-Y, Garwood M. Fast and quiet MRI using a swept radiofrequency. J. Magn. Reson. 2006;181:342–349Figures