4914
Good agreement of turbulent kinetic energy assessment by compressed sensing-accelerated 4D flow MRI in aortic stenosis patients1Department of Radiology, Children's Hospital Colorado, University of Colorado Anschutz Medical Campus, Aurora, CO, United States, 2Institute of Medical Devices, Kangwon National University, Chuncheon, Korea, Republic of, 3Medical Device Development Center, Daegu-Gyeongbuk Medical Innovation Foundation, Daegu, Korea, Republic of, 4Cardiovascular MR R&D, Siemens Medical Solutions, Cleveland, OH, United States, 5Siemens Healthineers Ltd., Seoul, Korea, Republic of, 6Department of Radiology, Eunpyeong St. Mary’s Hospital, College of Medicine, The Catholic University of Korea, Seoul, Korea, Republic of, 7Division of Cardiology, Department of Internal Medicine, Eunpyeong St. Mary’s Hospital, College of Medicine, The Catholic University of Korea, Seoul, Korea, Republic of
Synopsis
Keywords: Flow, Data Analysis, 4D flow MRI, Compressed sensing
Motivation: Compressed sensing (CS) acceleration has improved the clinical applicability of 4D flow MRI. However, but no studies have investigated turbulent kinetic energy (TKE) assessment using CS-accelerated 4D flow MRI.
Goal(s): This study aims to validate TKE assessment in CS 4D flow MRI compared to conventional 4D flow MRI.
Approach: The effect of CS acceleration on TKE assessment was evaluated by in vitro coarctation model. In addition, TKE assessment was further validated in healthy subjects and aortic stenosis (AS) patients.
Results: TKE parameters had good agreement in AS patients at the ascending aorta, while healthy subjects had significant differences.
Impact: TKE estimation has been limited due to asymmetric velocity encoding scheme, requiring additional MR scans. This study firstly validates the reliability of TKE using CS 4D flow with reduced scan time in AS patients.
Introduction
Time-resolved three-dimensional phase-contrast MRI (4D flow MRI) has become a promising tool for complex hemodynamic analysis. Estimating TKE by 4D flow MRI can provide valuable information on flow energy dissipation within the aorta—beyond the capabilities of current echocardiography methods1. However, TKE estimation achieves high accuracy at a relatively low velocity-encoding (VENC) values2, indicating that additional MR scans are crucially required to obtain appropriate velocity information without aliasing. This potentially extends the scan time and hinders the practical clinical application of TKE estimation.Compressed sensing (CS) acceleration in MRI imaging has emerging as a promising method for reducing MR scan time of 4D flow MRI by only 2 minutes3. In addition, the reliability of CS-accelerated 4D flow MRI has been validated by comparing various hemodynamic parameters, including peak velocity, peak flow rate and wall shear stress, with conventional 4D flow MRI4. Although the applicability of CS 4D flow MRI has been extensively established, no studies have investigated the effect of CS acceleration on TKE estimation. Thus, this study aims to validate TKE using CS 4D flow MRI compared to TKE obtained by 4D flow MRI.
Methods
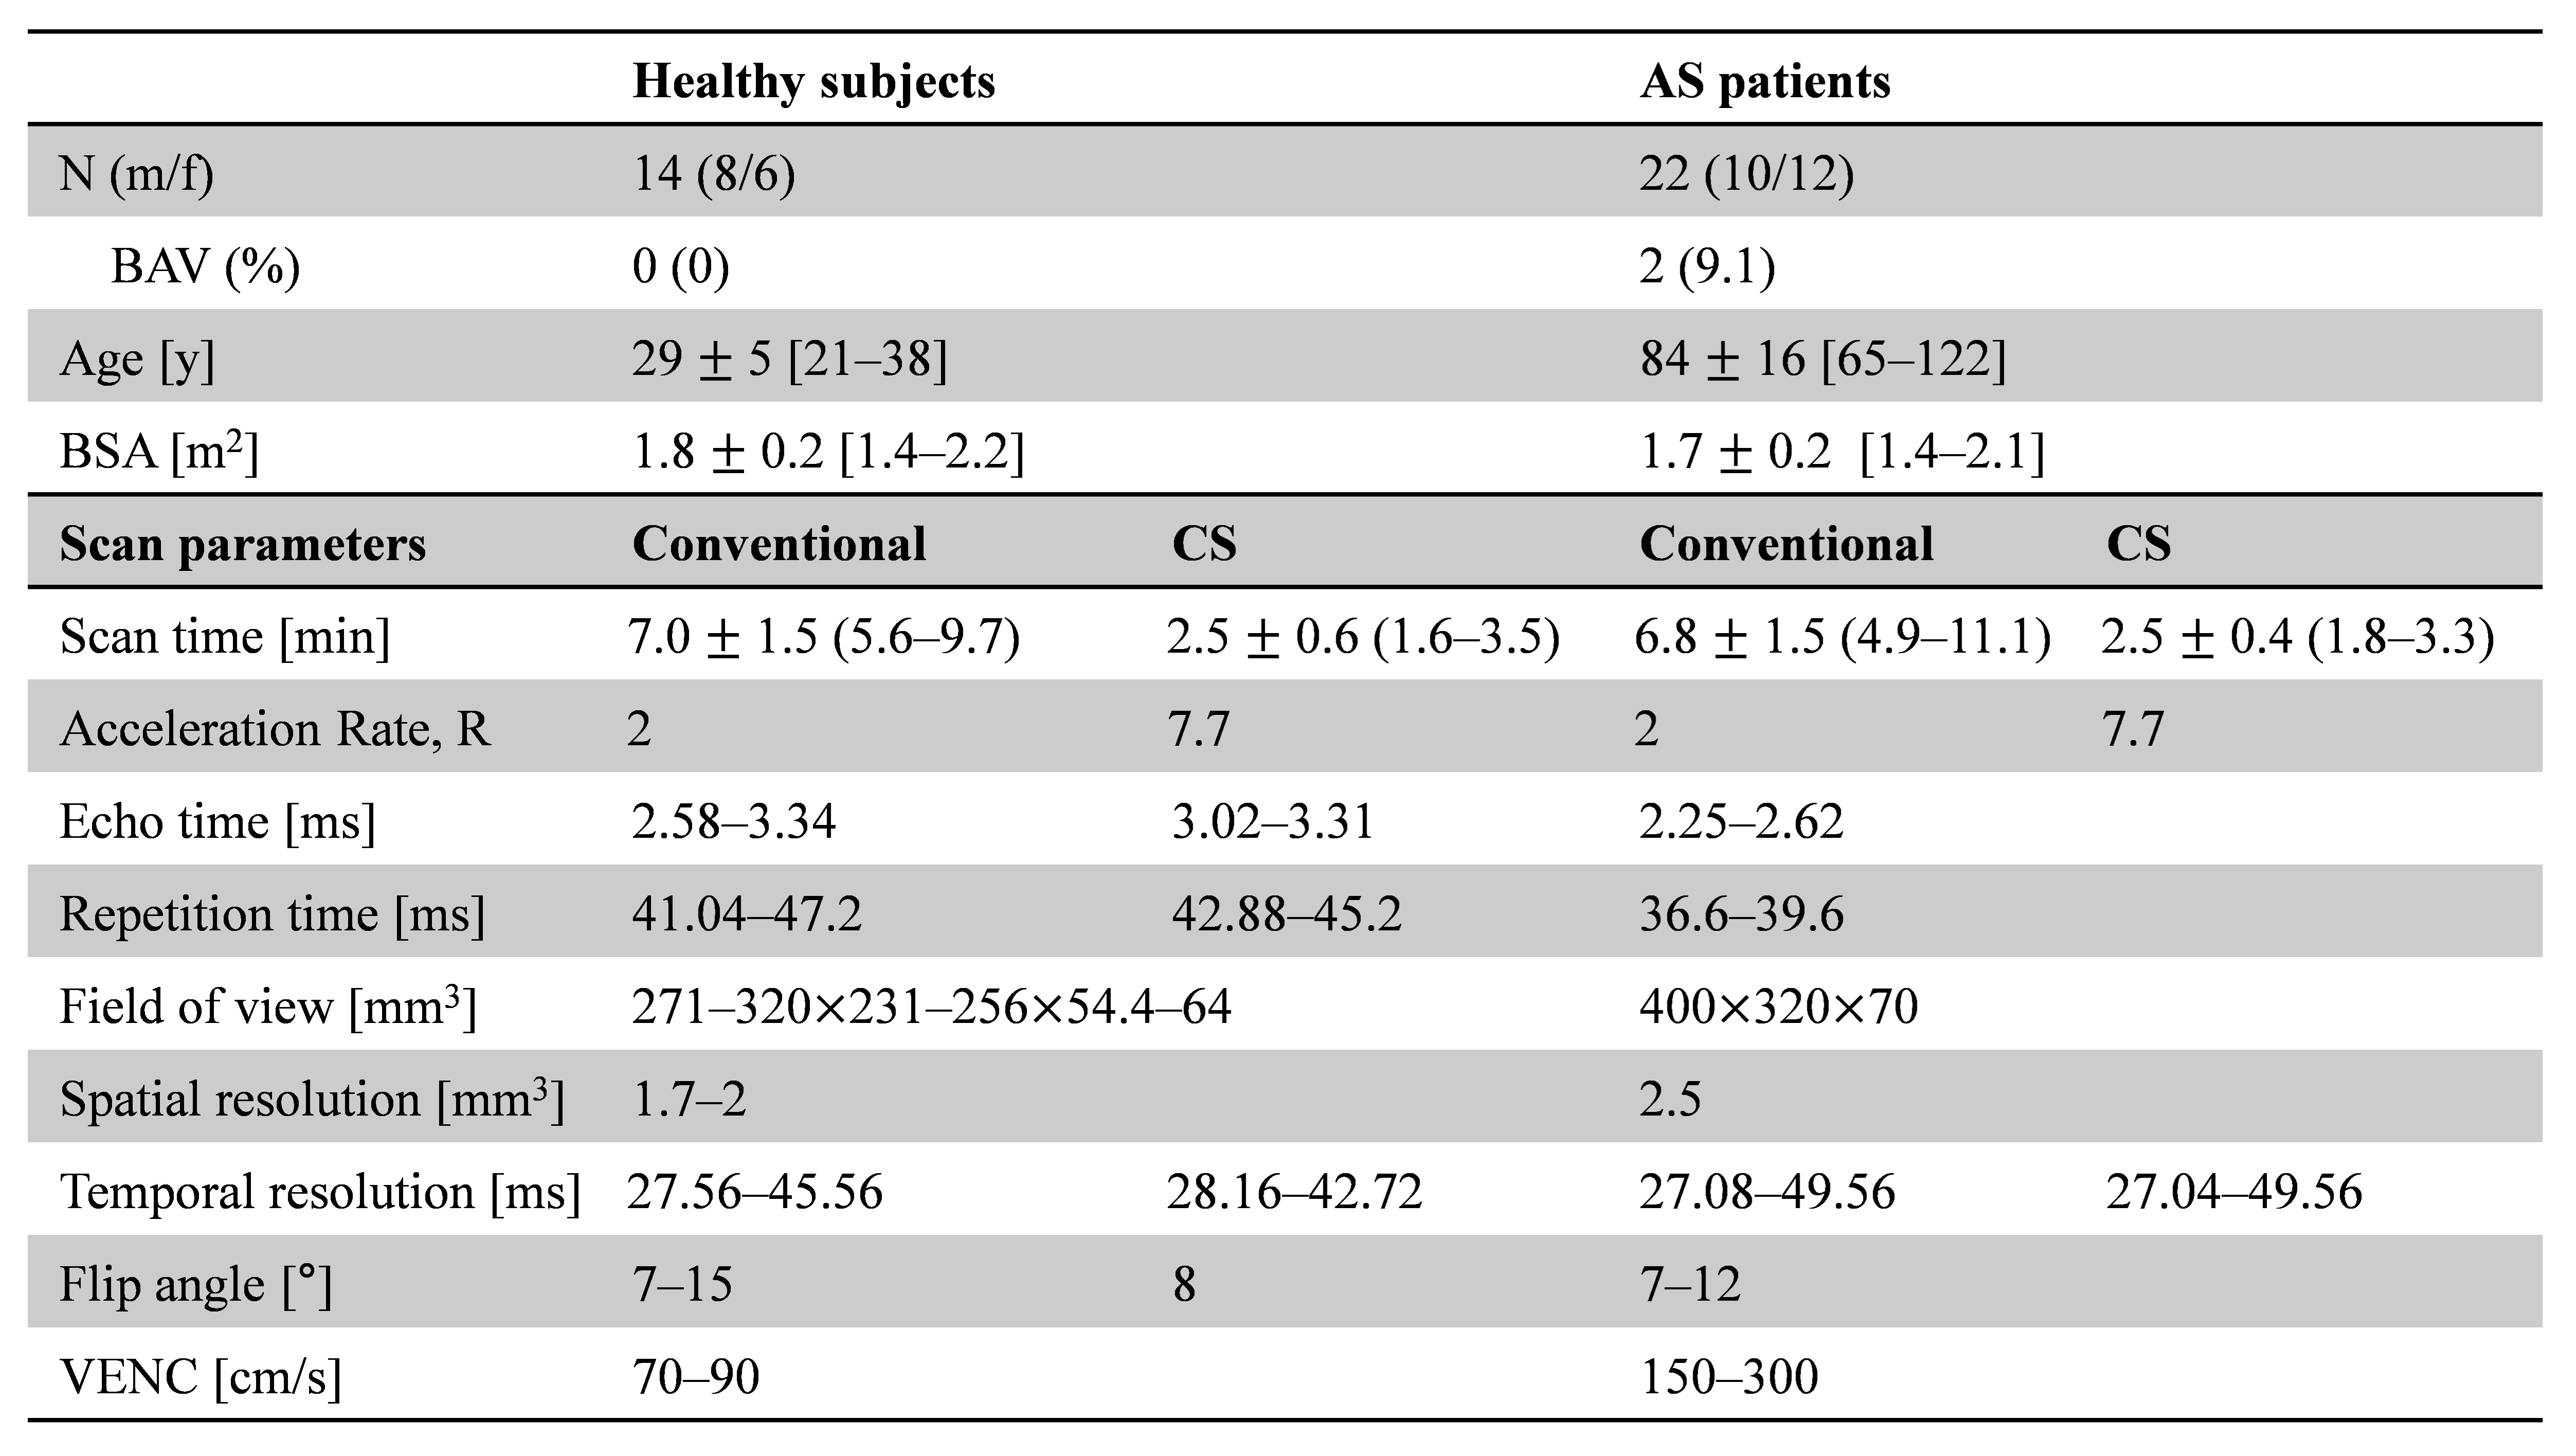
A coarctation phantom model was used to validate TKE estimation between CS-accelerated 4D flow MRI (R=7.7) and conventional 4D flow MRI (GRAPPA, R=2) using in-house pulsatile pump. The 4D flow scans were performed on a 3T MRI system (MAGNETOM Skyra, Siemens Healthcare, Erlangen, Germany) at the Daegu Gyeongbuk Medical Innovation Foundation (KMEDIhub). Asymmetric VENC values of 200 and 300 (V200 and V300, respectively) were used to obtain TKE parameters, and symmetric VENC value of 400 was used to obtain appropriate velocity data. The sequence parameters were matched for both conventional and CS 4D flow scans as follows: TE/TR = 2.32‒2.55/37.3‒40.8, BW = 495‒560 Hz/voxel, flip angle = 15°, spatial resolution = 222 mm3, temporal resolution = 41.4‒41.6 ms, cardiac time frames = 25.To validate clinical applicability, 4D flow MRI images were acquired on two different 3T MRI systems: the Skyra (Siemens Healthcare) at the KMEDIhub for healthy subjects and the Vida (Siemens Healthcare) at Eunpyeong St. Mary’s Hospital for AS patients. Demographics and MR scan parameters were summarized in Table 1. A two-tailed paired t-test was employed to evaluate statistical differences for TKE parameters. Bland-Altman analysis was also conducted to compare similarity between conventional and CS 4D flow. Change for CS [%] for TKE parameters was defined as the ratio of (CS 4D flow – Conventional 4D flow) to (Conventional 4D flow).
Results
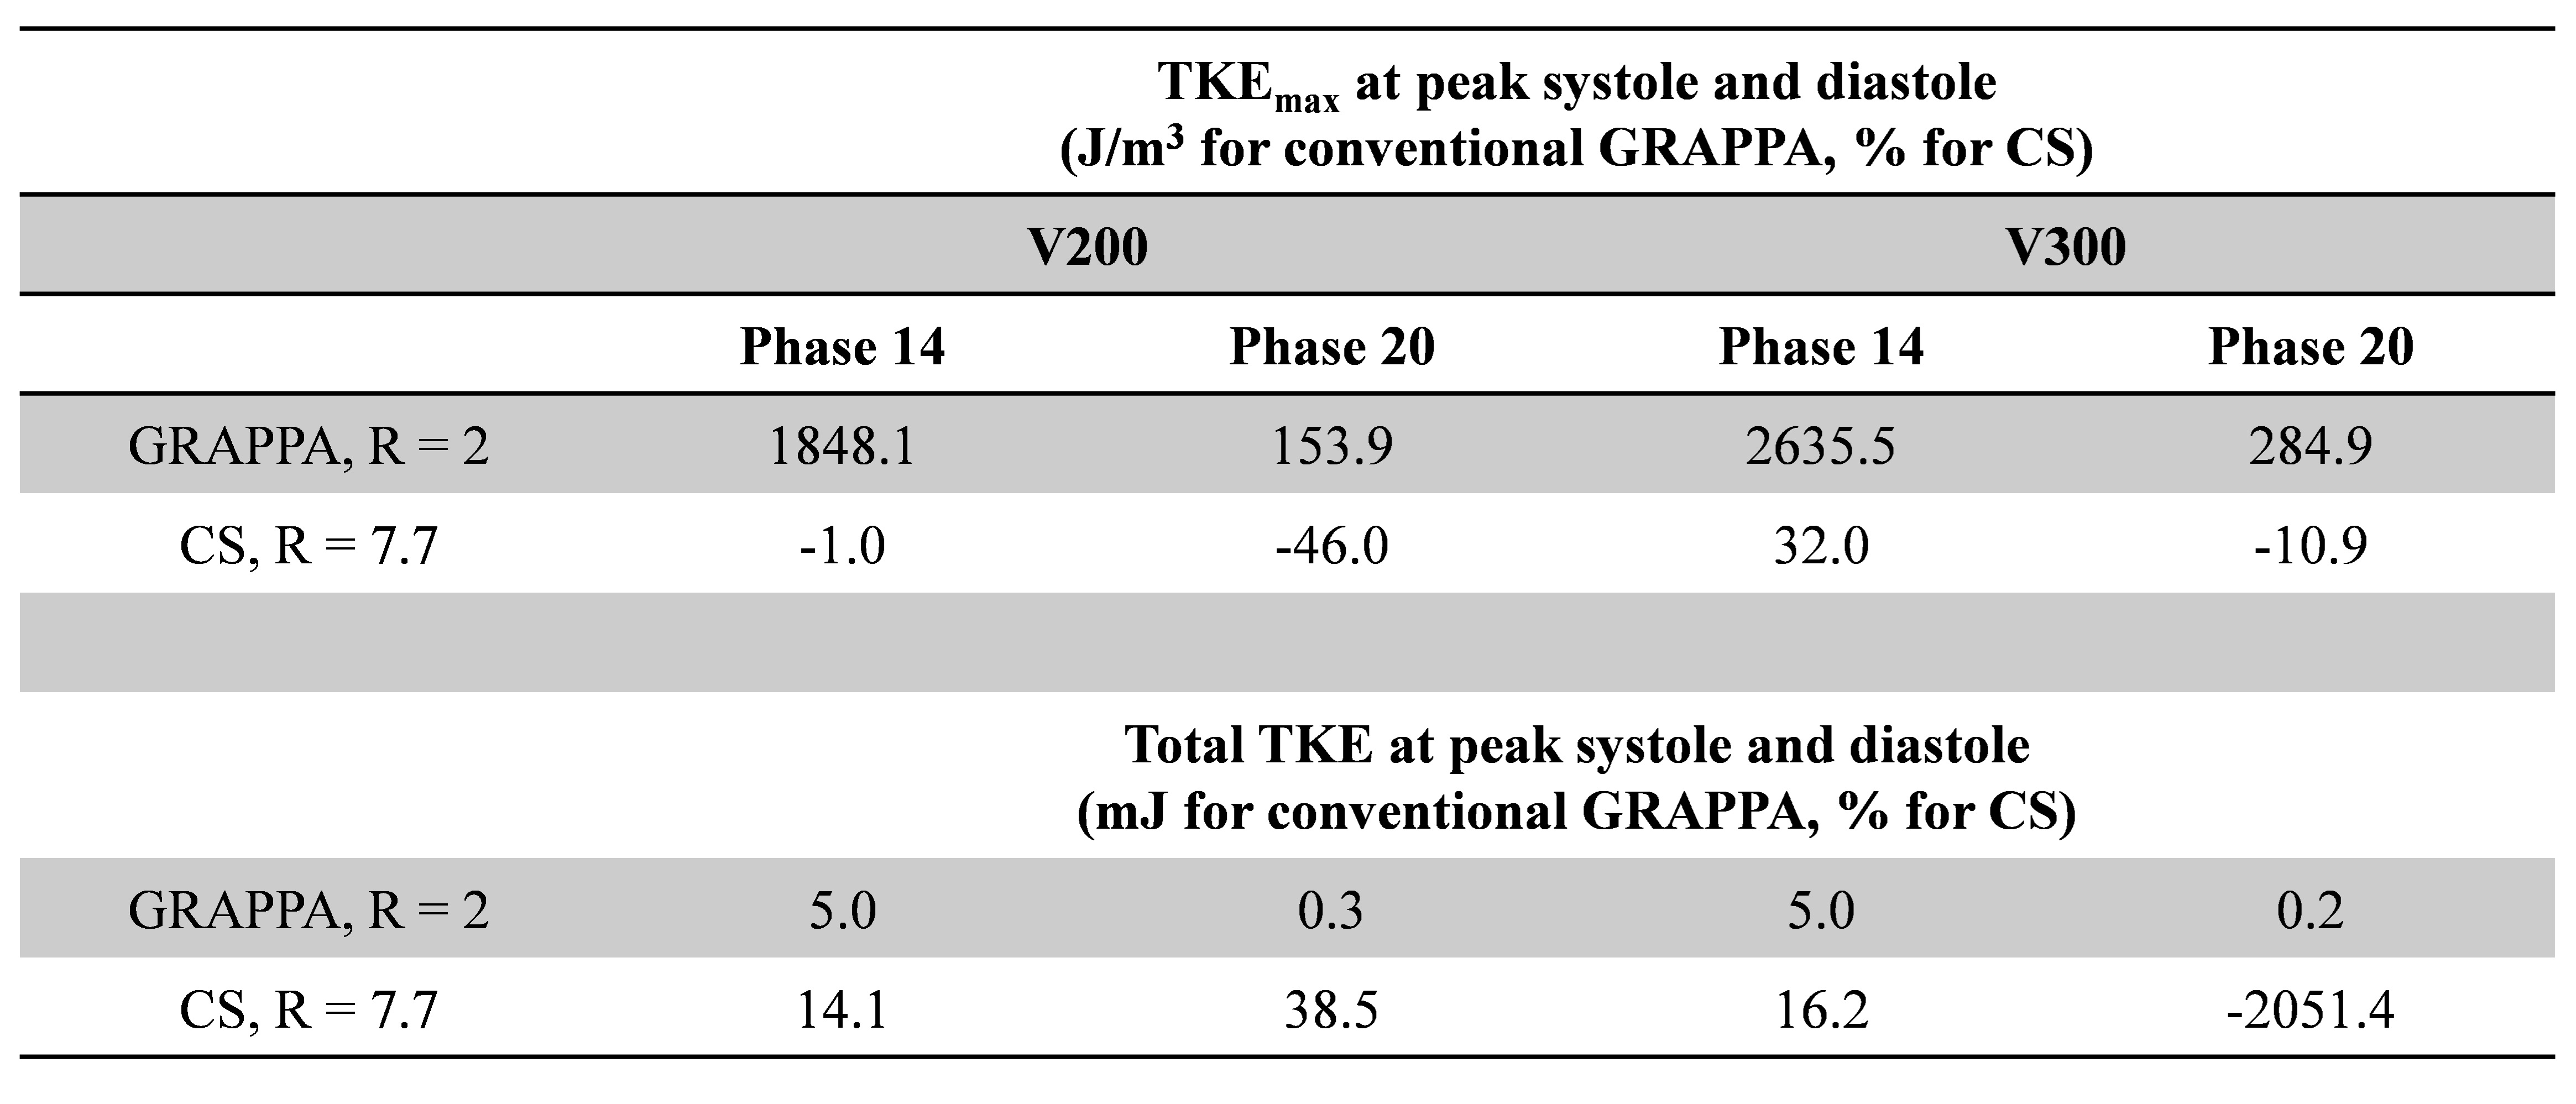
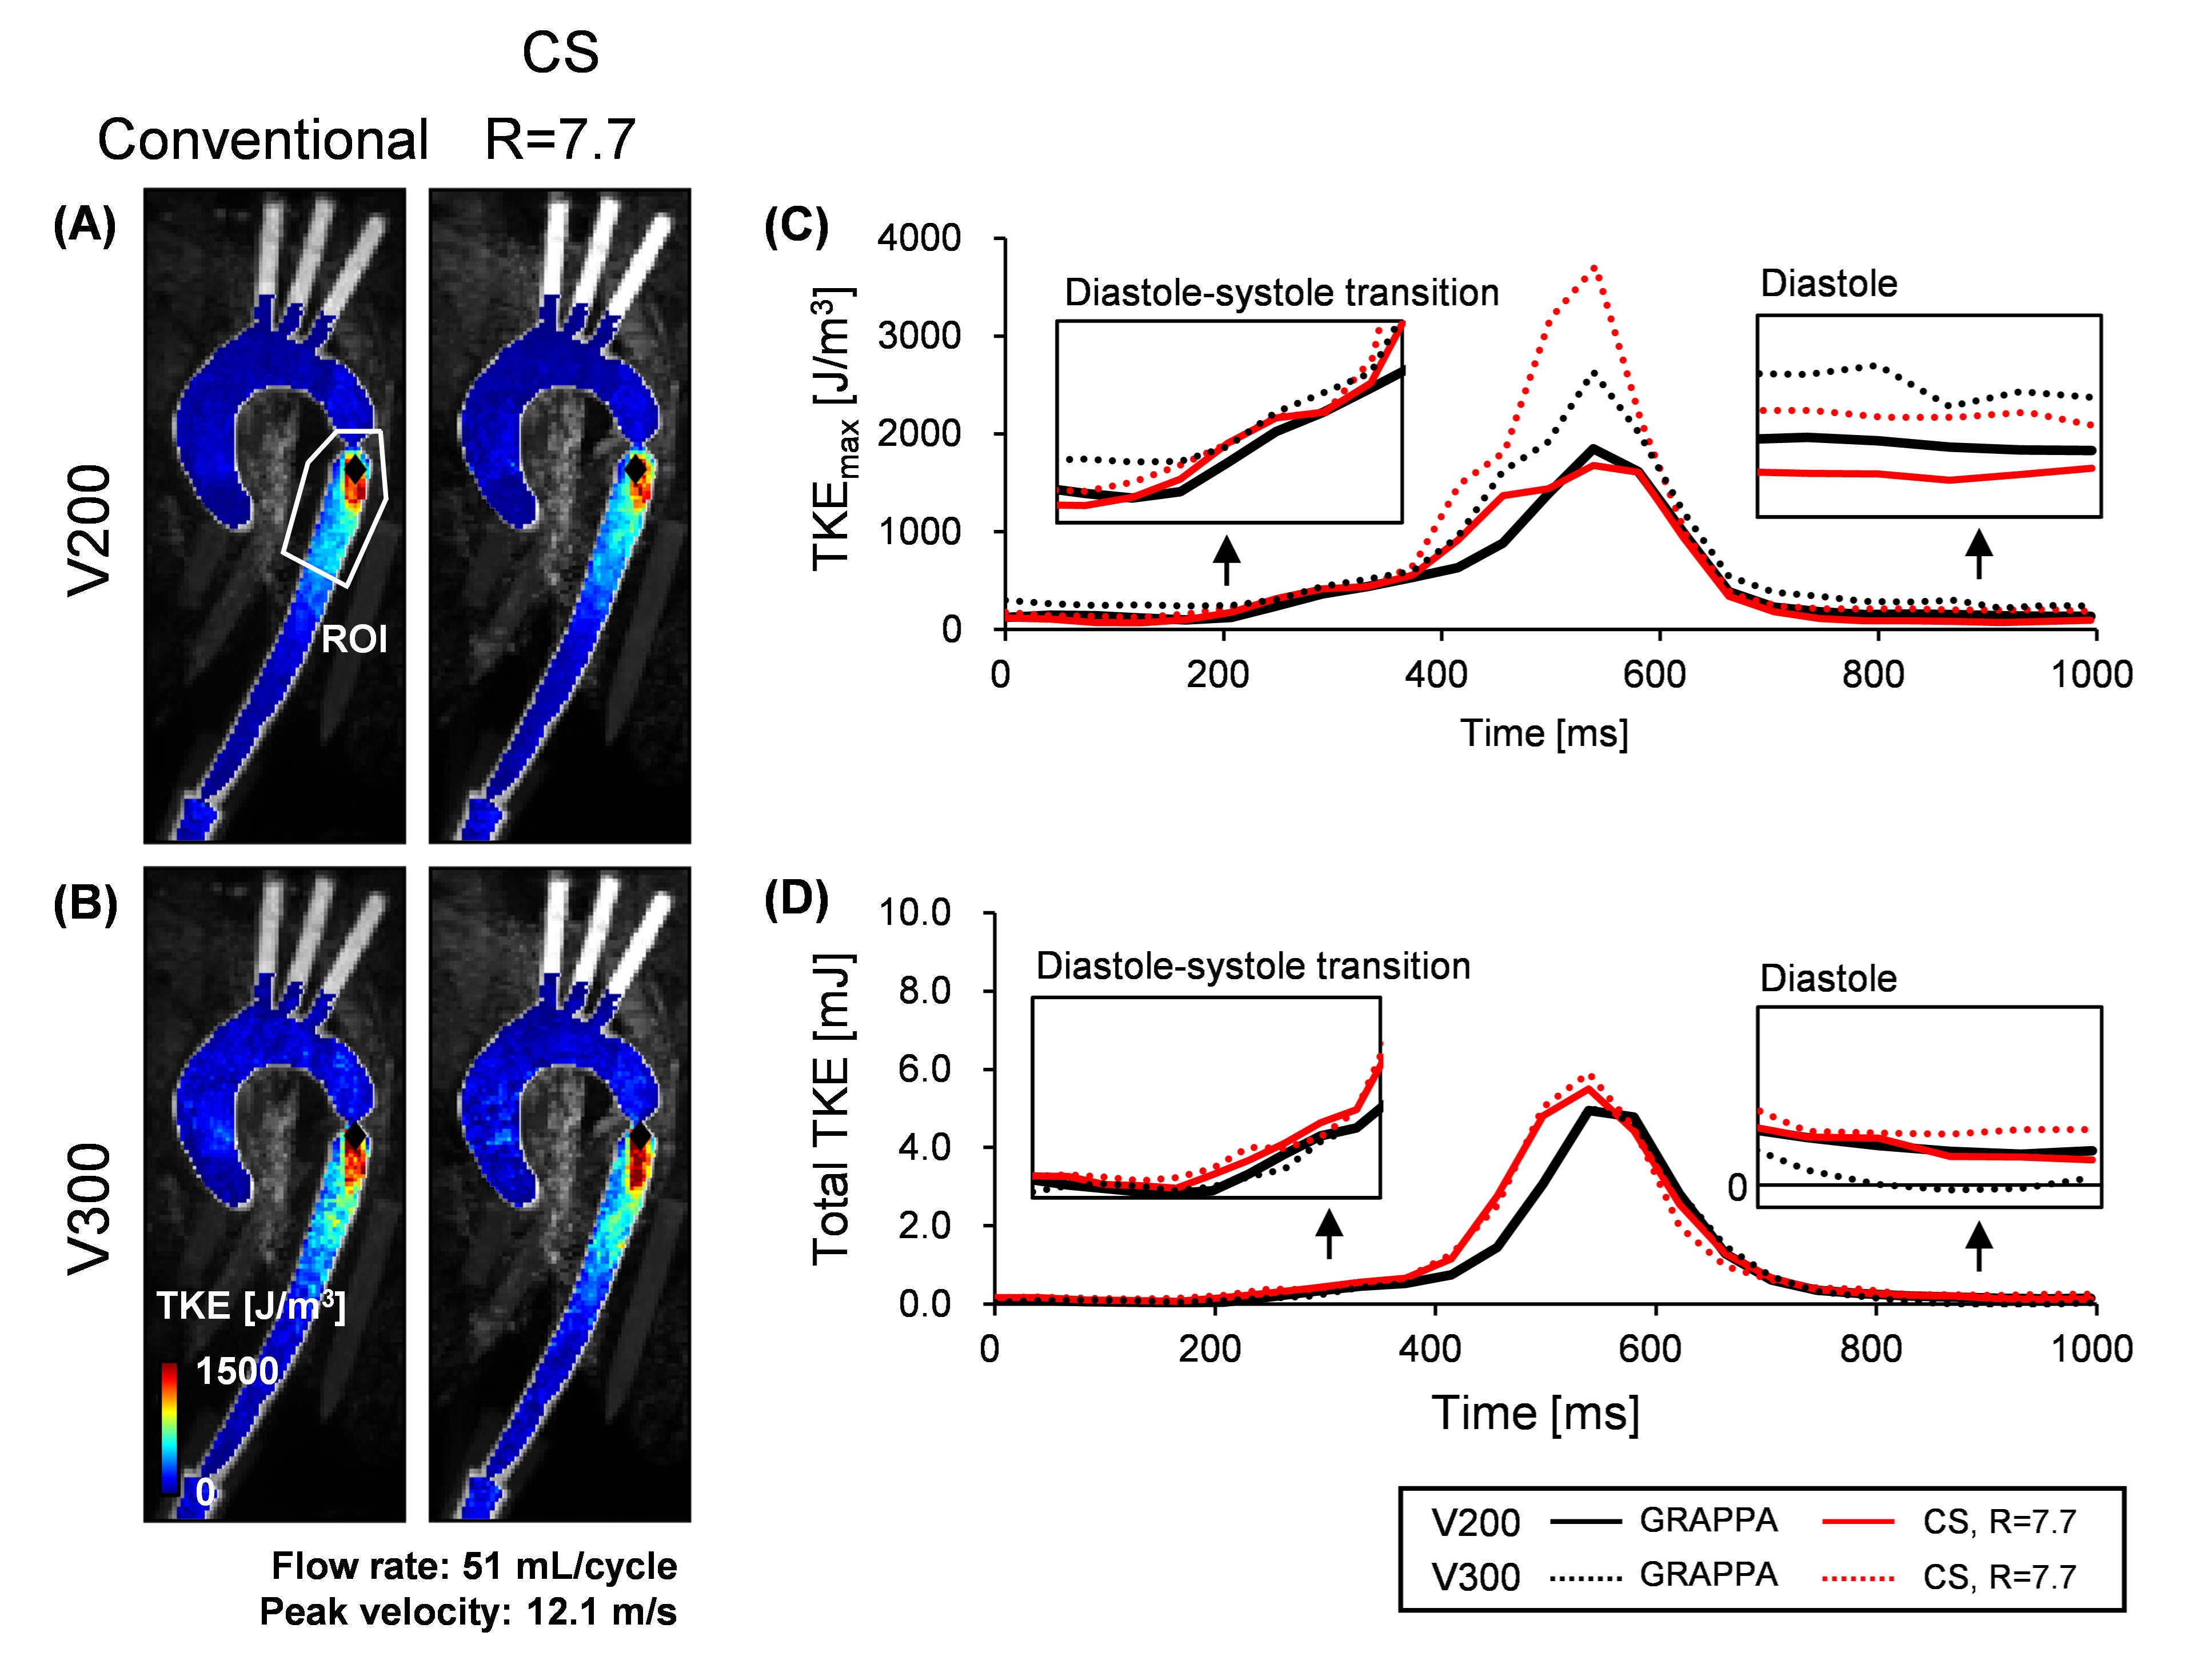
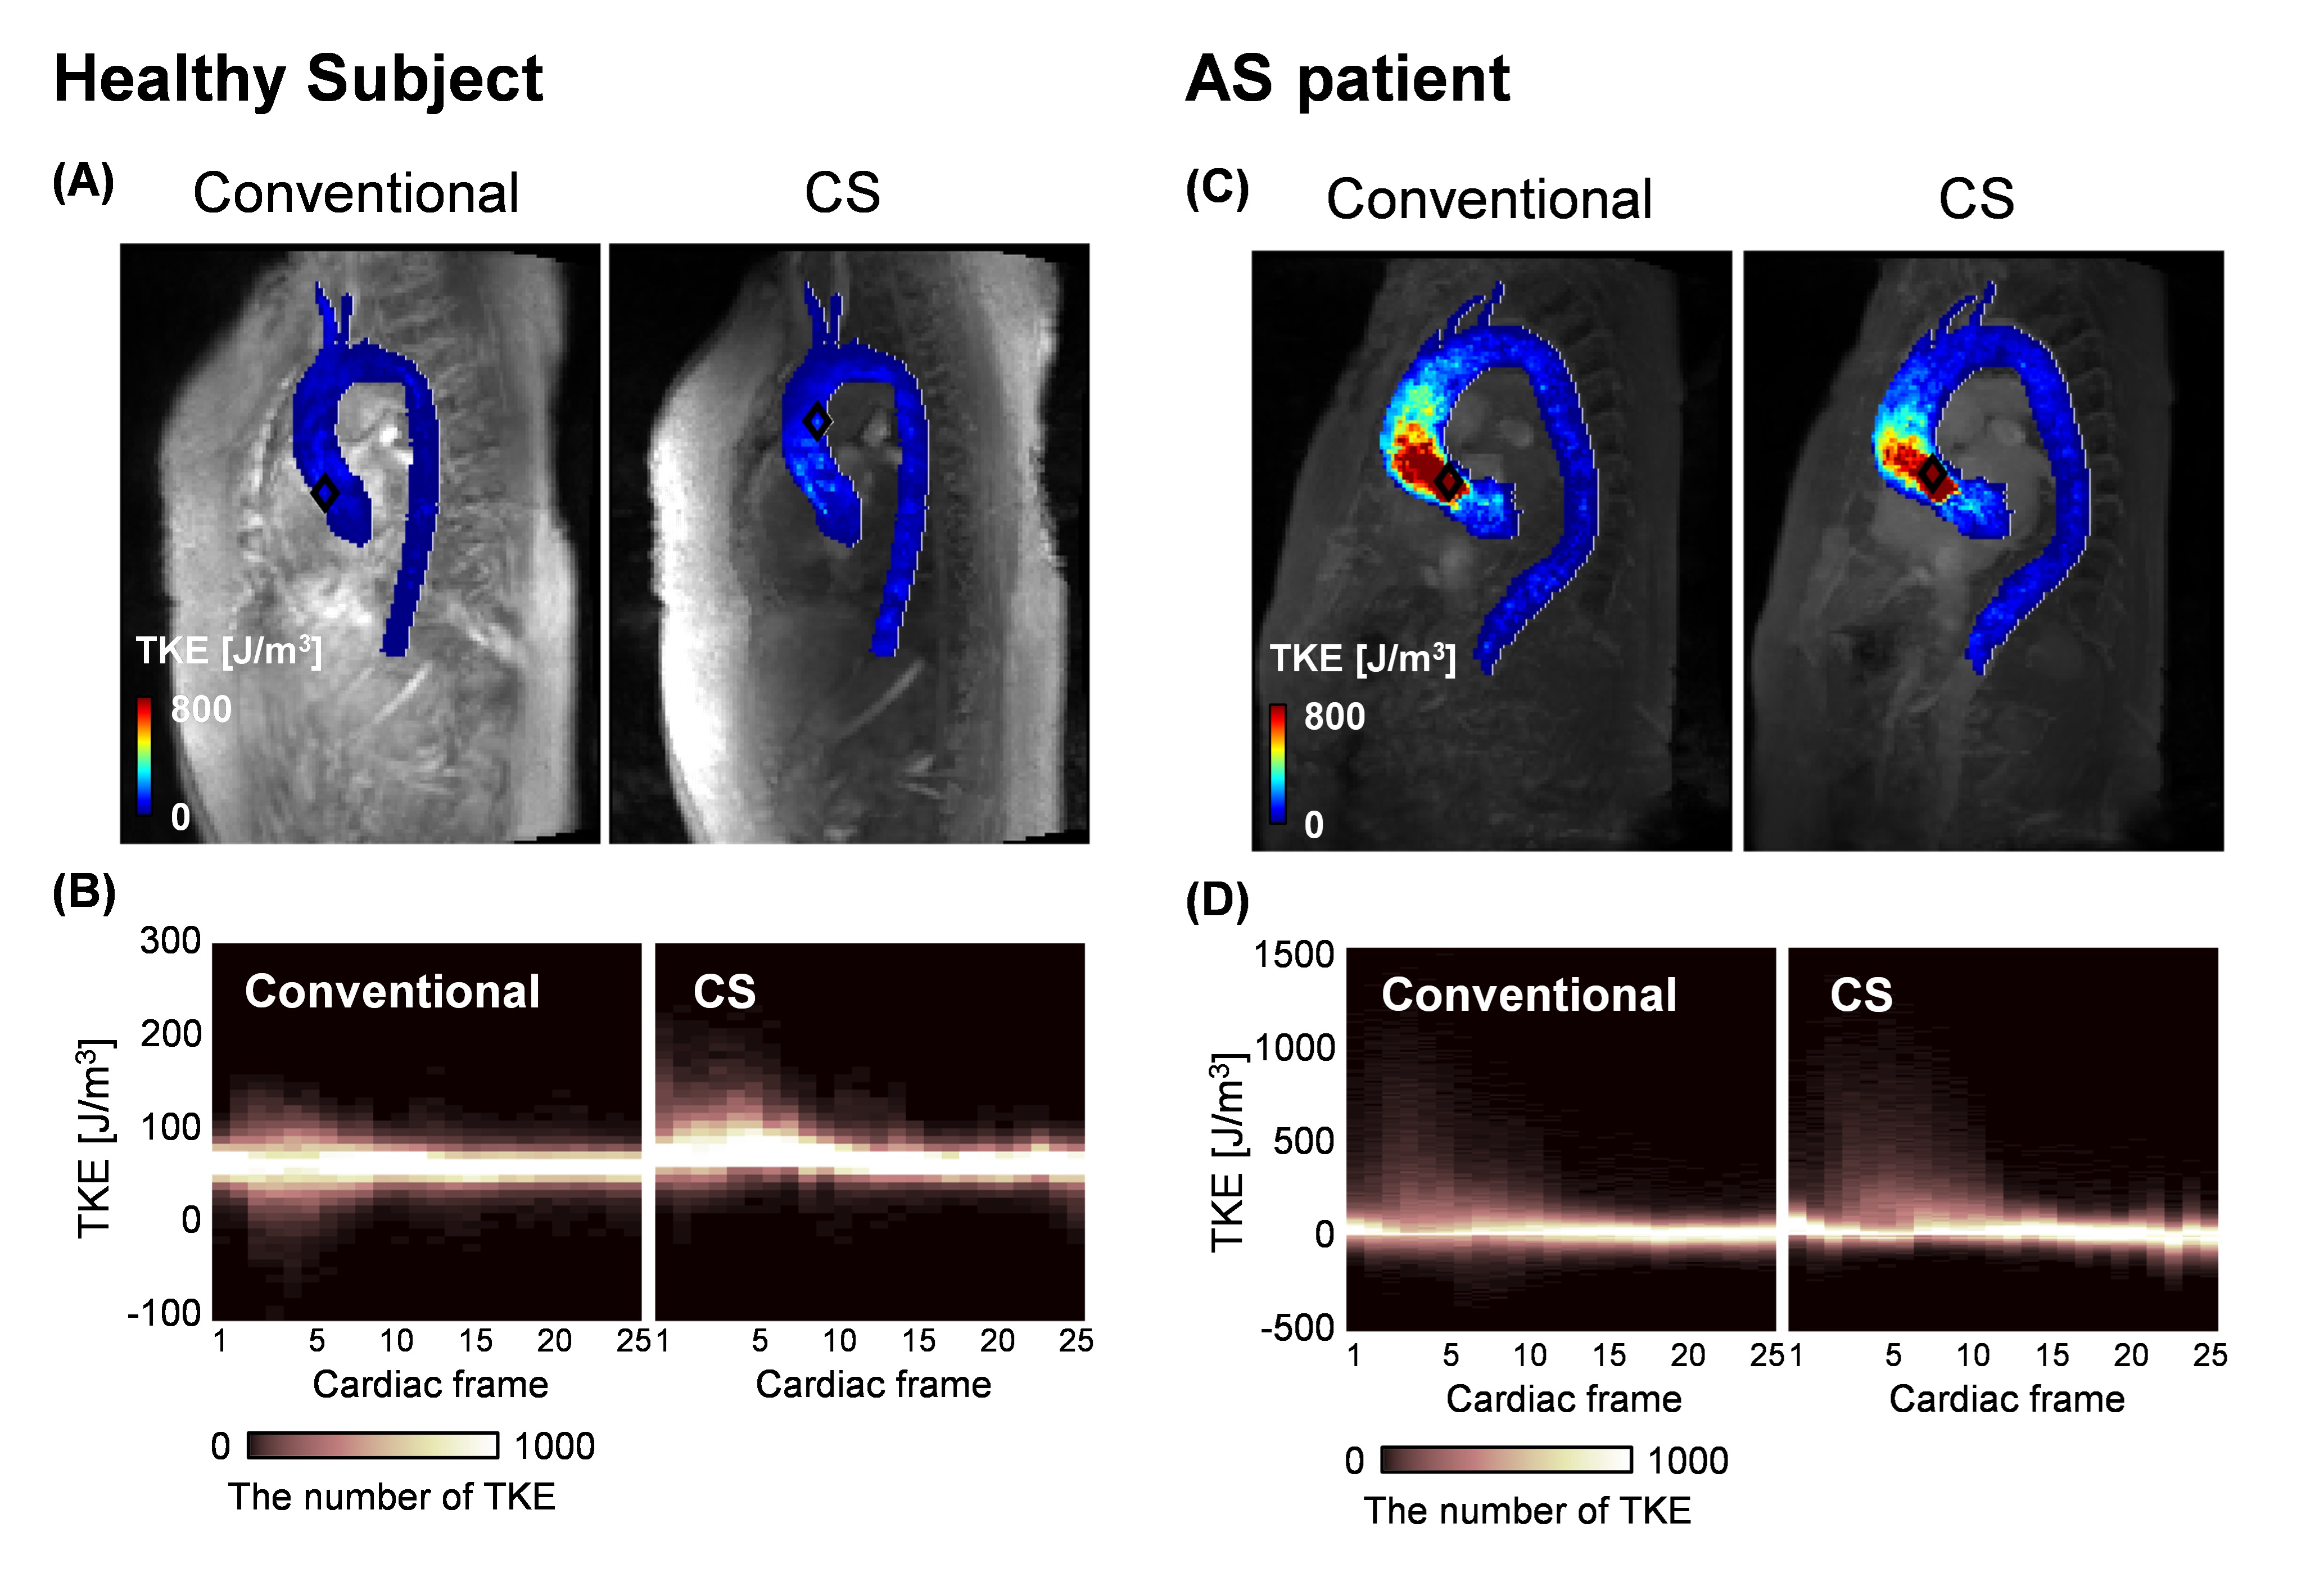
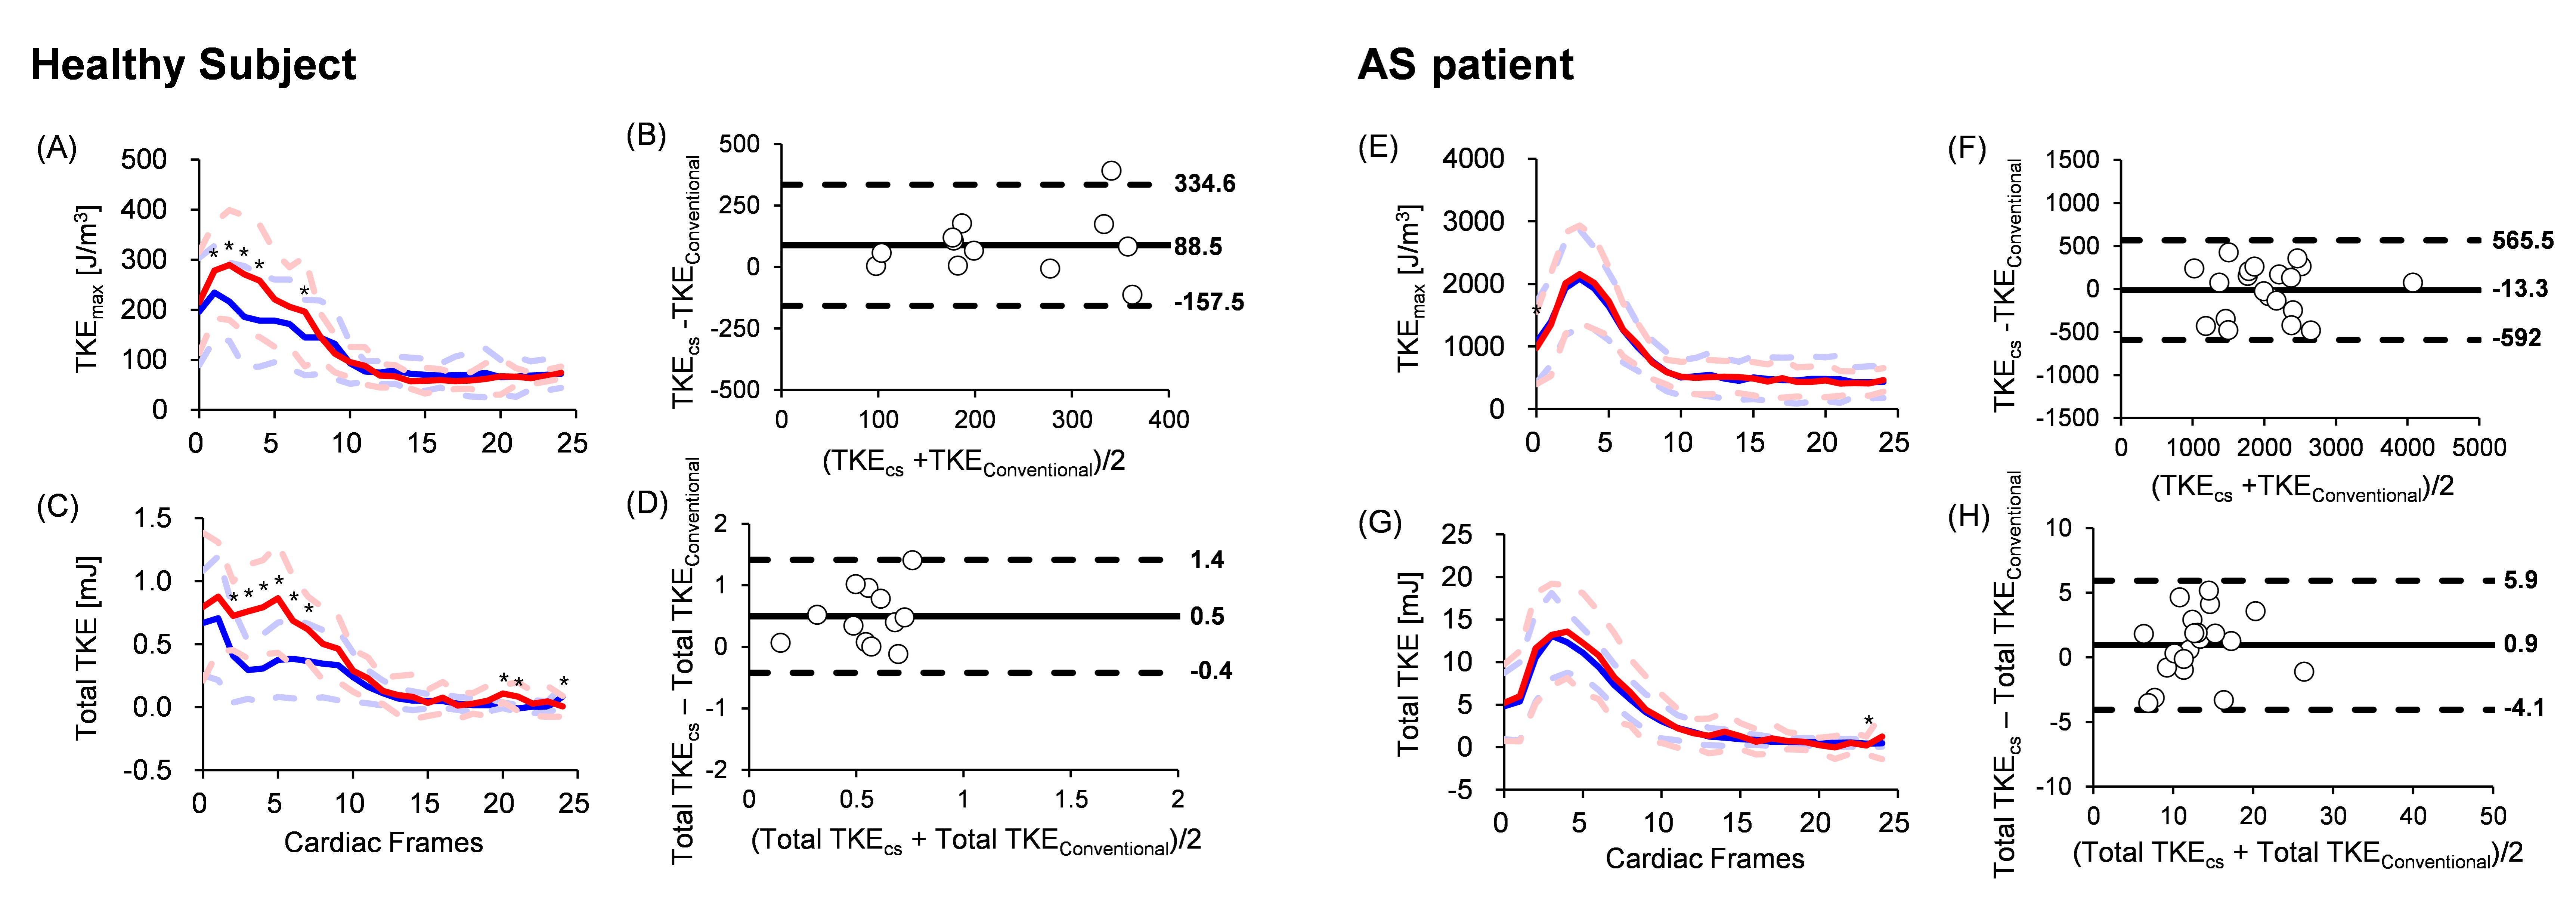
The representative distribution of TKE in the in vitro model during peak systole is shown in Fig. 1. The peak location was similar between conventional and CS 4D flow at each VENC, but both peak location and TKE distribution varied depending on the VENC values. TKE estimation at V200 showed similar trends in TKEmax distribution (Fig. 1C), while both TKEmax and total TKE remained comparable even at V300 (Fig. 1D). In addition, both TKEmax and total TKE were similar especially at the low VENC and peak systole (Table 2). Fig. 2 illustrates the representative TKE distribution for both healthy subject and AS patient at peak systole. Healthy subject exhibited the higher number of elevated TKE in CS 4D flow (Fig. 2A,B). In contrast, TKE distribution appeared nearly identical between conventional and CS 4D flow in AS patient (Fig. 2C,D). Fig. 3 showed averaged TKE parameters for all healthy subjects and AS patients. AS patients had good agreement in TKE assessment between conventional and CS 4D flow with fewer or no significant differences.Discussion
Our in vitro study demonstrated that VENC value plays an important role to minimize TKE bias, recommending to select VENC values ranging from 30% to 60% of the maximum velocity to achieve high accuracy of TKE5. In addition, TKE by CS 4D flow was overestimated in healthy subject especially at close to the ascending aorta. Spatial acceleration by the movement of the aorta significantly increases close to the vessel wall, which overestimates CS-accelerated TKE6. On the contrary, our in vitro and AS patient’s cohort studies demonstrate that TKE estimation by CS 4D flow had good agreement with conventional 4D flow during systole where high flow regime potentially occurs. Thus, this suggests that TKE estimation could be a potential biomarker to estimate energy dissipation by AS severity. A detailed examination of the effect of acceleration factors and voxel size on TKE estimation will be further required for the practical clinical application.Conclusion
CS 4D flow MRI demonstrated goodagreement in TKE estimation for AS patients, while healthy subjects showed significant differences.Acknowledgements
This research was supported by the Basic Science Research Program through the National Research Foundation of Korea (NRF), funded by the Ministry of Education (NRF-2021R1C1C1003481). This research was supported from the Korean Cardiac Research Foundation (202002-01).References
1. Binter, C. et al. Turbulent kinetic energy assessed by multipoint 4-dimensional flow magnetic resonance imaging provides additional information relative to echocardiography for the determination of aortic stenosis severity. Circulation: Cardiovascular Imaging 10, e005486 (2017).
2. Dyverfeldt, P., Gårdhagen, R., Sigfridsson, A., Karlsson, M. & Ebbers, T. On MRI turbulence quantification. Magnetic resonance imaging 27, 913-922 (2009).
3. Ma, L. E. et al. Aortic 4D flow MRI in 2 minutes using compressed sensing, respiratory controlled adaptive k‐space reordering, and inline reconstruction. Magnetic resonance in medicine 81, 3675-3690 (2019).
4. Pathrose, A. et al. Highly accelerated aortic 4D flow MRI using compressed sensing: Performance at different acceleration factors in patients with aortic disease. Magnetic resonance in medicine 85, 2174-2187 (2021).
5. Ha, H. et al. Estimation of turbulent kinetic energy using 4D phase-contrast MRI: Effect of scan parameters and target vessel size. Magnetic resonance imaging 34, 715-723 (2016).
6. Dyverfeldt, P., Sigfridsson, A., Kvitting, J. P. E. & Ebbers, T. Quantification of intravoxel velocity standard deviation and turbulence intensity by generalizing phase‐contrast MRI. Magnetic Resonance in Medicine: An Official Journal of the International Society for Magnetic Resonance in Medicine 56, 850-858 (2006).
Figures