4909
reproducibility and accuracy of PC-MRI for low velocity measurement: A pilot study.1Facing Faces Institute/CHIMERE EA 7516, University of Picardy, AMIENS, France, 2Bruker Biospin MRI GmbH, Wissembourg, France, 3University Centre for Health Research (CURS, PIRMPA), University of Picardy Jules Verne, amiens, France
Synopsis
Keywords: Preclinical Image Analysis, Data Acquisition, Flow measurment
Motivation: Non-invasive measurement of intracranial flow can elucidate fluid interactions within the brain. However, it's essential to determine the range of velocities that can be reliably measured using this approach.
Goal(s): Our aim is to assess the ability of PC MRI "Flow Compensated Fast low angle Shot (fcFLASH)" based sequence for velocity measurements in small blood vessels and cerebrospinal fluid in rats.
Approach: A phantom is built to simulate fluid flow. Measurements are repeated for each velocity range.
Results: Non gated fcFLASH-based PC MRI allows a rough estimation of flow velocities on the order of 0.5 cm/s.
Impact: our study shows that the fcFLASH-based PC MRI can be used for a rough estimation of a small fluid circulation. A methodological development is necessary for a reliable measurement.
Introduction
Reliable and reproducible blood flow measurement is essential for investigating cardiovascular1 and neurological diseases 2. Many diseases are known to cause alterations in blood flow 3, making it a biomarker in many cases. In addition, understanding the mechanism of fluid interaction within the brain may help to understand and manage a pathology. Phase-contrast MRI (PC-MRI) offers the possibility to quantify blood and cerebrospinal fluid (CSF) velocities, as well as to visualize velocities waveforms. This study aimed to assess the reproducibility of PC-MRI for measuring microcirculation within the intracranial region of the rat.Method
- Flow simulation
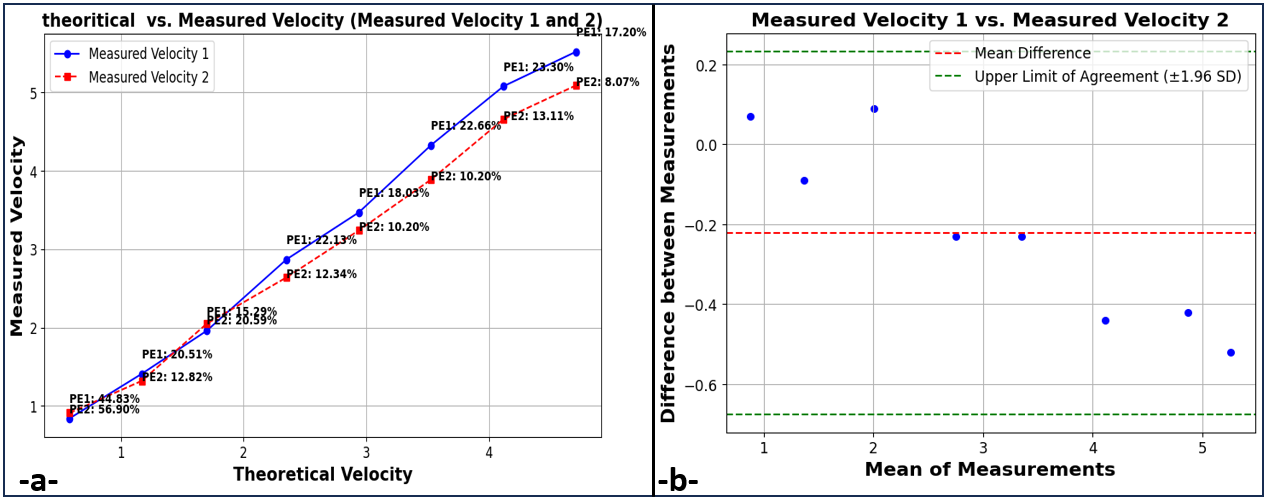
First, we varied the pulsatile flow rate from 10 ml/min to 80 ml/min with a step of 10 ml/min, corresponding to velocities of 0.58 cm/s and 4.71 cm/s, respectively. The measurement was made twice on a 6 mm inner diameter tube using the same acquisition parameters.
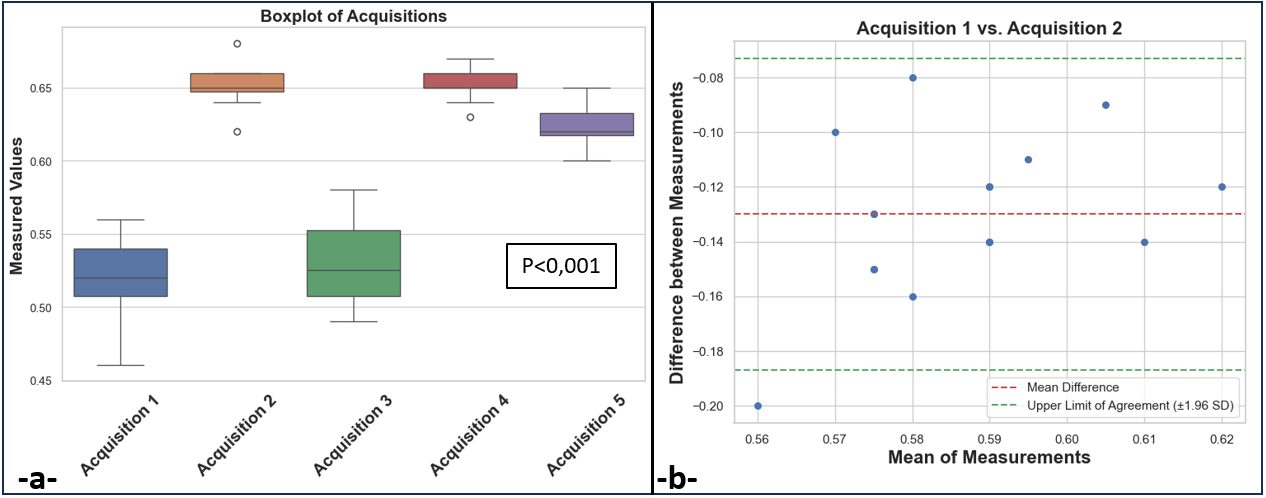
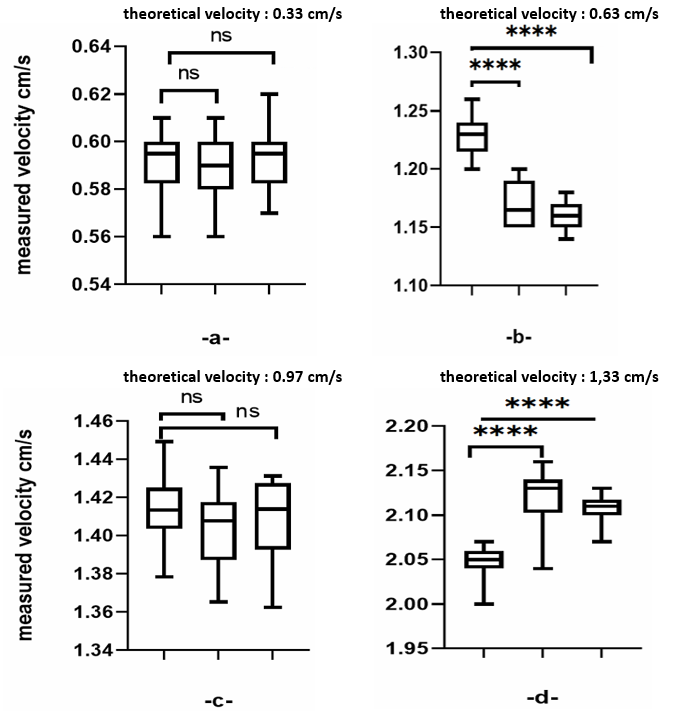
Repeatability was then tested at a flow rate of 0.4 ml/min, corresponding to an average velocity of 0.3 cm/s; five measurements were performed on 1.6mm inner diameter tube. Finally, we varied the flow rate of a syringe pump within the range of 0.15 ml/min to 1.6 ml/min, corresponding to velocities ranging from 0.3 cm/s to 1.33 cm/s. the measurement was repeated 3 times on 1 mm inner diameter tube.
- Image acquisition:
- Image processing and statistics
The normality test was performed for each series of measurements, and the Anova test was used to evaluate differences. The Bland Altman test was performed to assess the repeatability of two measurements for both pulsatile and constant fluid. The tests were performed using Python programming language (version 3.10.11).
Result
- Pulsatile Flow, 6 mm ID:
- Pulsatile flow, 1.6mm ID:
- Constant flow, 1mm ID:
Discussion
In pulsatile flow, variations in measurements are related to non-synchronization: as fluid frequency (flow rate) increases, the measurement errors decrease. Additionally, we observed an overestimation of velocities, which is associated with the encoding velocity (Venc), however consecutive measurements are within the limits of agreement with small bias in the measurements.Due to MRI electronics limitations, the minimum Venc was 4.4 cm/s. The decrease in Venc will influence the spatial resolution, which was 0.14. For a constant flow, even though we can acknowledge the difference between the measurements, the values are consistently overestimated for the same reason: Venc limitations.conclusion
This study demonstrates the feasibility of measuring a specific range of flow velocities. However, at this point, we can consider that non gated fcFLASH PC-MRI may only be useful for a preliminary estimation of low intracranial flow.Acknowledgements
No acknowledgement found.References
- Braig, M.; Leupold, J.; Menza, M.; Russe, M.; Ko, C.-W.; Hennig, J.; von Elverfeldt, D. Preclinical 4D-Flow Magnetic Resonance Phase Contrast Imaging of the Murine Aortic Arch. PLoS One 2017, 12 (11), e0187596. https://doi.org/10.1371/journal.pone.0187596.
- Gadda, G.; Cocozza, S.; Gambaccini, M.; Taibi, A.; Tedeschi, E.; Zamboni, P.; Palma, G. NO-HYPE: A Novel Hydrodynamic Phantom for the Evaluation of MRI Flow Measurements. Med Biol Eng Comput 2021, 59 (9), 1889–1899. https://doi.org/10.1007/s11517-021-02390-2.
- Fukuyama, N.; Tsukamoto, Y.; Takizawa, S.; Ikeya, Y.; Fujii, T.; Shinozaki, Y.; Takahari, Y.; Kawabe, N.; Wakana, N.; Umetani, K.; Todoroki, K.; Fukui, S.; Tanaka, C.; Tanaka, E.; Mori, H. Altered Blood Flow in Cerebral Perforating Arteries of Rat Models of Diabetes: A Synchrotron Radiation Microangiographic Study toward Clinical Evaluation of White Matter Hyperintensities. Geriatr Gerontol Int 2015, 15 Suppl 1, 74–80. https://doi.org/10.1111/ggi.12658.
- Ungersböck, K.; Heimann, A.; Kempski, O. Cerebral Blood Flow Alterations in a Rat Model of Cerebral Sinus Thrombosis. Stroke 1993, 24 (4), 563–569; discussion 569-570. https://doi.org/10.1161/01.str.24.4.563.
- Balédent, O.; Henry-Feugeas, M.-C.; C, ´eCILE; Idy-Peretti, I. Cerebrospinal Fluid Dynamics and Relation with Blood Flow: A Magnetic Resonance Study with Semiautomated Cerebrospinal Fluid Segmentation. Investigative Radiology 2001, 36 (7), 368–377.
Figures