4908
CEST MRI detects antiretroviral therapy-induced metabolomic alterations in brains of a rodent model1Radiology, University of Nebraska Medical Center, Omaha, NE, United States, 2Pharmacology and Experimental Neuroscience, University of Nebraska Medical Center, Omaha, NE, United States
Synopsis
Keywords: Small Animals, CEST & MT, Drugs, metabolites, antiretroviral, HIV, ART, gluatamate, creatine
Motivation: The neurotoxicity of antiretroviral (ARV) drugs has been reported to affect neurocognition.
Goal(s): In this study, we tried to link CEST results of ARVs and metabolites to elucidate the effects of ARVs on metabolic alterations.
Approach: Mice administrated with TDF/3TC/DTG were scanned using CEST MRI to detect 3TC (at 1 and 2 ppm) and TDF (at 3 ppm). Metabolites were also measured using CEST MRI.
Results: Results showed that when used in combination, MRI is not sensitive to the CEST contrasts of 3TC and TDF. Glutamate, creatine and NOE were affected by TLD indicating the toxicity of TLD.
Impact: The study showed the potential to use CEST MRI to elucidate the effects of antiretroviral drugs on the neuropathologic outcomes by testing the association of MRI measurements of ARVs and metabolic imaging results.
Introduction
Antiretroviral (ARV) drugs has transformed human immunodeficiency virus type one (HIV-1) infection from a fatal to a manageable chronic disease1,2. However, the mild forms of disease persist3-7 that include HIV-associated neurocognitive disorders (HAND)3-7. The neurotoxicity of ART has been reported to affect cognition through persistent inflammation8-15. MRI has been used to detect metabolic alterations associated with brain immune dysfunctions employing the chemical exchange saturation transfer (CEST) contrasts of metabolites16-20. CEST MRI also shows the potential to detect ARVs based on their CEST contrasts21,22. Herein, we hypothesize that the MRI measurements of ARVs are correlated with metabolomic imaging results. This study elucidates the effects of ARVs on the neuropathology that could consequently impair neurocognitive outcomes.Materials and Methods
Male C57BL/6 mice (n = 18) were administrated with Lipopolysaccharide (LPS) by intraperitoneal (IP) injections for 6days (3 mg/kg at day 1 and 1 mg/kg for subsequent 5 days in 100 µL sterile saline)23. First group of animals (n = 6) were administered with antiretroviral regimen (ART) of DTG/ABC/3TC (Triumeq®, 20.5 /246 /123 mg/kg/day, respectively) by oral gavage for 5 days starting 24 hours after the first LPS injection. Another group of mice (n = 6) were administrated with TDF/3TC/DTG (TLD, 123 /123 /20.5 mg/kg/day, respectively) with same timeline as Triumeq® administration. The control group (n = 6) were administrated with vehicle [Dimethylsulfoxide:Solutol®:50mM N-methylglucamine in 3% mannitol (1:1:8, v:w:v)]. 24 hours after the last ART administration, the mice were scanned on a 7 T Bruker Scanner (PharmaScan) with CEST RARE. The RF saturation was 2 µT, and 2 seconds in length. The frequency was -5 to 5 ppm with step = 0.2 ppm. CEST data were analyzed using 5-pool Lorentzian fitting to detect water, magnetization transfer contrast (MTC), CEST contrasts at 2 and 3 ppm, and at -3.5 ppm (nuclear Overhauser effect, NOE).Results
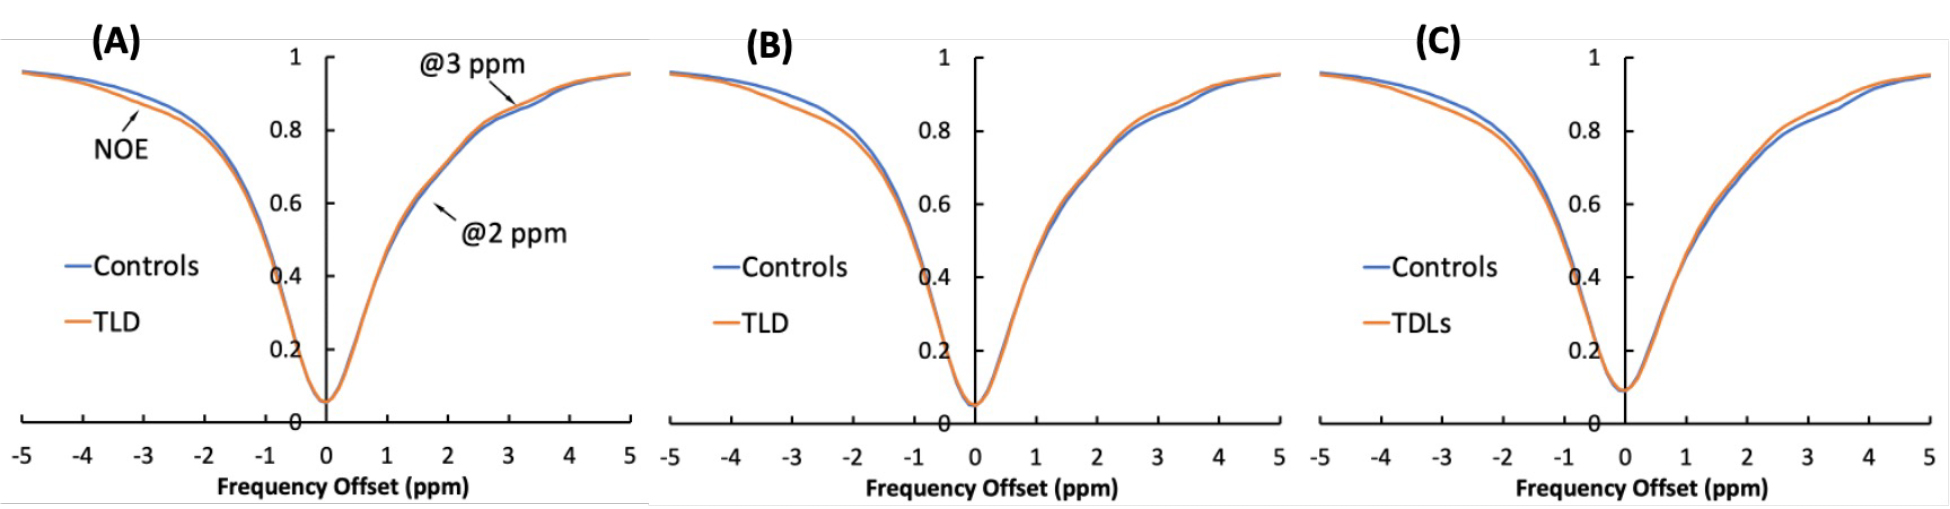
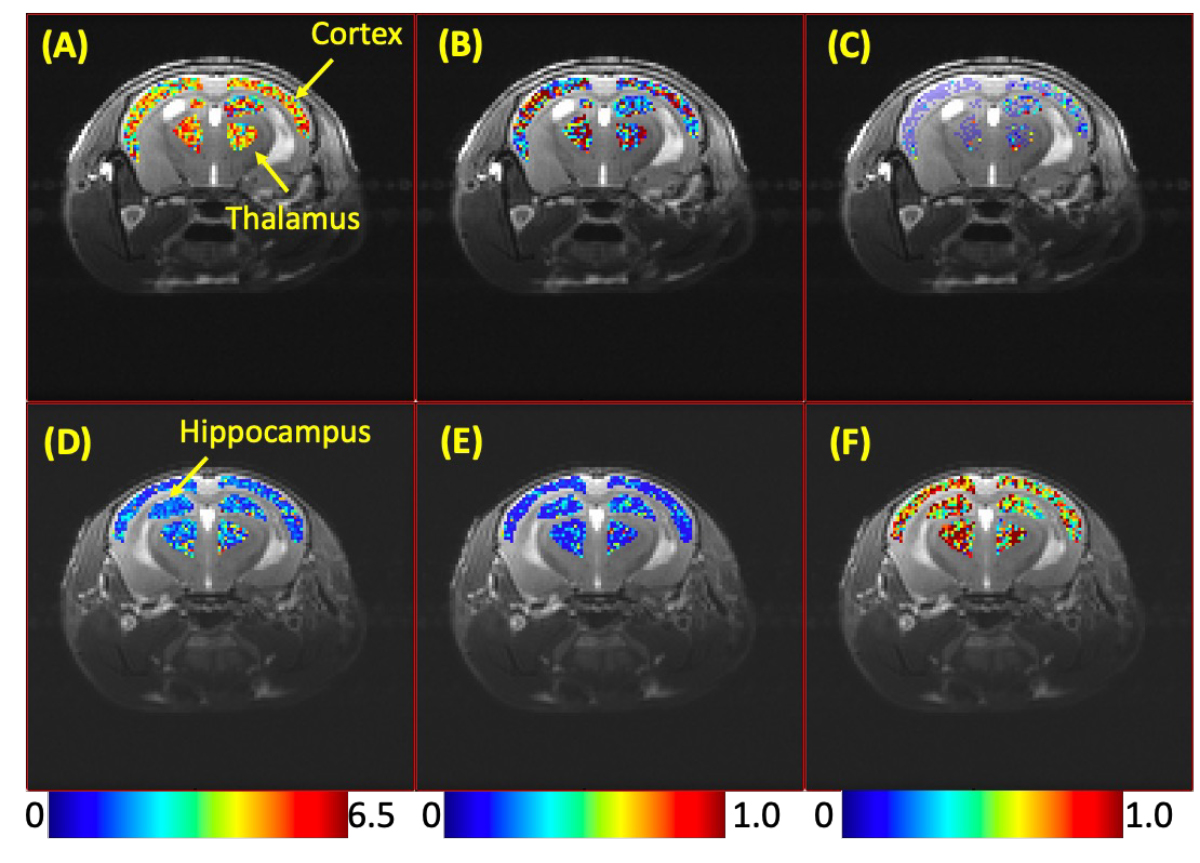
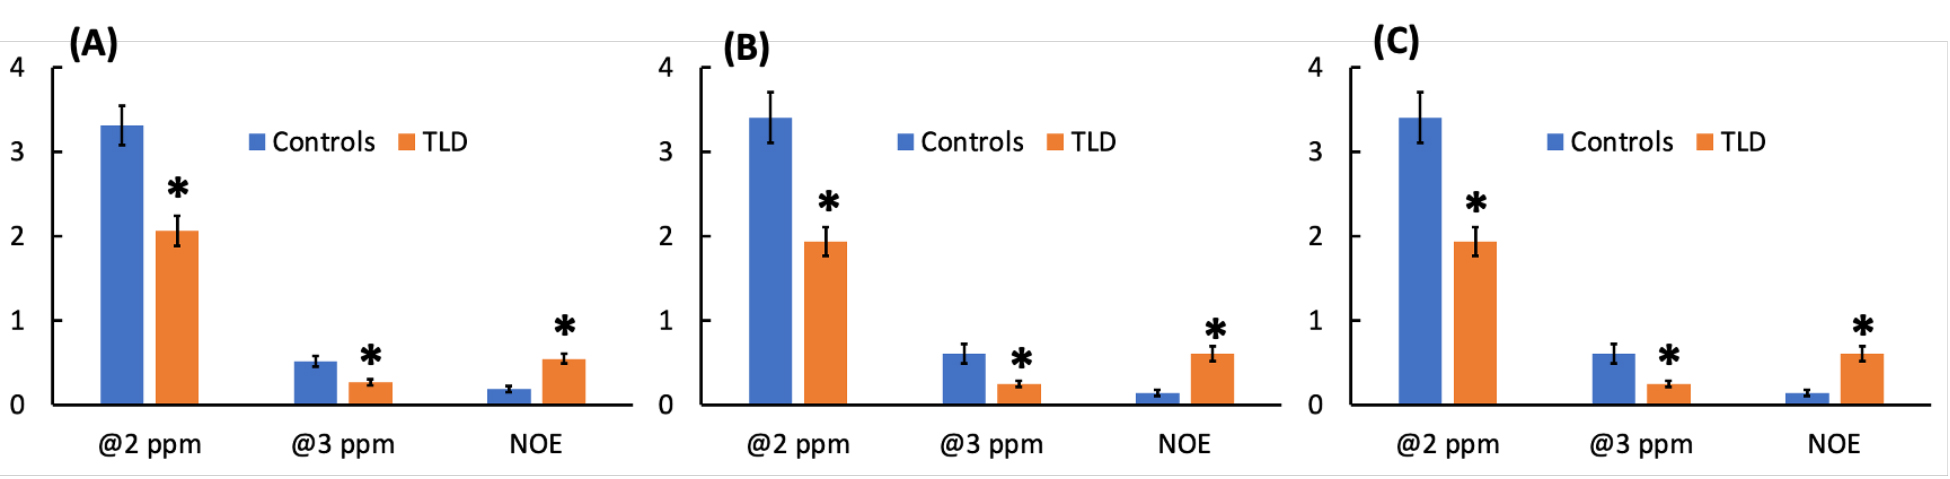
Decrease in CEST contrasts at 2 ppm and 3 ppm was observed in brains of TLD treated mice compared to those of vehicle rated controls. Figure 1A-C shows the Z-spectra of controls and TLD-administrated mice on brain regions include hippocampus, cortex, and thalamus, respectively. The CEST contrasts were detected using Lorentzian fitting, and the areas of under the Lorentzian curves (AUC) at 2 ppm, 3 ppm and -3.5 ppm were calculated for each pixel. The colormaps of the AUC are shown in Figure 2. Figure 2A-C show the colormaps at 2 ppm 3 ppm and -3.5 ppm on hippocampus, cortex and thalamus, respectively, of a control mouse. The colormaps of a TLD-administrated mouse are shown in Figure 2D-F. The AUC values were averaged over brain regions and compared between TLD and vehicle treated animals (Figure 3). The AUC values were significantly reduced in all three brain regions of TLD treated mice at 2 ppm (p = 0.00073 on hippocampus, p = 0.00082 on cortex, p = 0.00034 on thalamus) and 3 ppm (p = 0.0025, p = 0.0072, p = 0.0055 on hippocampus, cortex and thalamus) of a control mouse. TLD-administrated mice showed elevated CEST contrast at -3.5 ppm on hippocampus (p = 0.00013), cortex (p = 0.00029) and thalamus (p = 0.00069). Interestingly, no changes were observed in CEST contrasts on brains of mice administrated with Triumeq® compared to those of controls (data not shown).Discussion
Our in vitro data showed that CEST contrasts at 1 and 2 ppm in 3TC, and 3 ppm in TDF21. DTG and ABC did nto show detectable CEST contrast in 7 Tesla. Previously, we measured 3TC concentrations in mouse brains using MRI by employing drugs CEST contrasts21. In this study, the CEST contrasts of 3TC were not detected in brains of mice administrated with Triumeq® (DTG/ABC/3TC) or TLD (TDF/3TC/DTG). It is potentially due to confounding effect of other ARVs of combinational regimen on CEST contrasts of 3TC. It is believed that creatine and glutamate are the underlying molecular basis of the 2 and 3 ppm CEST contrasts, respectively18-20,24-29. The reduced CEST contrasts at 2 and 3 ppm in the TLD-administrated mice could result from altered metabolism of creatine and glutamate. The increased NOE of membrane lipids at -3.5 ppm in mice administered with TLD indicate changes in brain cellular integrity. In summary, the CEST contrasts of individual ARV were not detected when drugs were used in combination. TLD showed toxicity that altered brain metabolomic and cellular integrity.Acknowledgements
This study was partially supported by NIH R21MH128123, R21MH134678, P20GM130447, Nebraska Research Initiative, UNMC Graduate Fellowship. The authors want to thank the Small Animal MRI core facility at UNMC for technical support.References
1. Phanuphak N, Gulick RM. HIV treatment and prevention 2019: current standards of care. Current opinion in HIV and AIDS. 2020;15(1):4-12.
2. Ghosn J, Taiwo B, Seedat S, Autran B, Katlama C. HIV. The Lancet. 2018;392(10148):685-697.
3. Valcour V, Chalermchai T, Sailasuta N, et al. Central nervous system viral invasion and inflammation during acute HIV infection. The Journal of infectious diseases. 2012;206(2):275-282.
4. Saylor D, Dickens AM, Sacktor N, et al. HIV-associated neurocognitive disorder--pathogenesis and prospects for treatment. Nat Rev Neurol. 2016;12(4):234-248.
5. Katuri A, Bryant J, Heredia A, Makar TK. Role of the inflammasomes in HIV-associated neuroinflammation and neurocognitive disorders. Experimental and Molecular Pathology. 2019;108:64-72.
6. Cohen RA, Seider TR, Navia B. HIV effects on age-associated neurocognitive dysfunction: premature cognitive aging or neurodegenerative disease? Alzheimers Res Ther. 2015;7(1):37-37.
7. Hong S, Banks WA. Role of the immune system in HIV-associated neuroinflammation and neurocognitive implications. Brain, behavior, and immunity. 2015;45:1-12.
8. Shah A, Gangwani MR, Chaudhari NS, Glazyrin A, Bhat HK, Kumar A. Neurotoxicity in the Post-HAART Era: Caution for the Antiretroviral Therapeutics. Neurotox Res. 2016;30(4):677-697.
9. Zulu SS, Abboussi O, Simola N, Mabandla MV, Daniels WMU. Effects of combination antiretroviral drugs (cART) on hippocampal neuroplasticity in female mice. J Neurovirol. 2021;27(2):325-333.
10. Zulu SS, Simola N, Mabandla MV, Daniels WMU. Effect of long-term administration of antiretroviral drugs (Tenofovir and Nevirapine) on neuroinflammation and neuroplasticity in mouse hippocampi. J Chem Neuroanat. 2018;94:86-92.
11. Lanman T, Letendre S, Ma Q, Bang A, Ellis R. CNS Neurotoxicity of Antiretrovirals. J Neuroimmune Pharmacol. 2021;16(1):130-143.
12. Akay C, Cooper M, Odeleye A, et al. Antiretroviral drugs induce oxidative stress and neuronal damage in the central nervous system. J Neurovirol. 2014;20(1):39-53.
13. De Benedetto I, Trunfio M, Guastamacchia G, Bonora S, Calcagno A. A review of the potential mechanisms of neuronal toxicity associated with antiretroviral drugs. J Neurovirol. 2020;26(5):642-651.
14. Yuan NY, Kaul M. Beneficial and Adverse Effects of cART Affect Neurocognitive Function in HIV-1 Infection: Balancing Viral Suppression against Neuronal Stress and Injury. J Neuroimmune Pharmacol. 2021;16(1):90-112.
15. Jordan-Sciutto KL. Effects of Antiretroviral Therapy in the Central Nervous System: Beyond Viral Suppression. J Neuroimmune Pharmacol. 2021;16(1):71-73.
16. Cai K, Haris M, Singh A, et al. Magnetic resonance imaging of glutamate. Nature medicine. 2012;18(2):302-306.
17. Haris M, Cai K, Singh A, Hariharan H, Reddy R. In vivo mapping of brain myo-inositol. Neuroimage. 2011;54(3):2079-2085.
18. Jia Y, Chen Y, Geng K, et al. Glutamate Chemical Exchange Saturation Transfer (GluCEST) Magnetic Resonance Imaging in Pre-clinical and Clinical Applications for Encephalitis. Front Neurosci. 2020;14:750.
19. Neal A, Moffat BA, Stein JM, et al. Glutamate weighted imaging contrast in gliomas with 7 Tesla magnetic resonance imaging. NeuroImage: Clinical. 2019;22:101694.
20. Singh A, Debnath A, Cai K, et al. Evaluating the feasibility of creatine-weighted CEST MRI in human brain at 7 T using a Z-spectral fitting approach. NMR Biomed. 2019;32(12):e4176.
21. Bade AN, Gendelman HE, McMillan J, Liu Y. Chemical exchange saturation transfer for detection of antiretroviral drugs in brain tissue. Aids. 2021;35(11):1733-1741.
22. Y L, GC G, HE G, AN B. Dual-Peak Lorentzian CEST MRI for Antiretroviral Drug Brain Distribution. NeuroImmune Pharmacology and Therapeutics. in press.
23. Haruwaka K, Ikegami A, Tachibana Y, et al. Dual microglia effects on blood brain barrier permeability induced by systemic inflammation. Nature communications. 2019;10(1):5816.
24. Bagga P, Pickup S, Crescenzi R, et al. In vivo GluCEST MRI: Reproducibility, background contribution and source of glutamate changes in the MPTP model of Parkinson’s disease. Scientific Reports. 2018;8(1):2883.
25. Debnath A, Hariharan H, Nanga RPR, Reddy R, Singh A. Glutamate-Weighted CEST Contrast After Removal of Magnetization Transfer Effect in Human Brain and Rat Brain with Tumor. Mol Imaging Biol. 2020;22(4):1087-1101.
26. Li R, Dai Z, Hu D, et al. Mapping the Alterations of Glutamate Using Glu-Weighted CEST MRI in a Rat Model of Fatigue. Frontiers in Neurology. 2020;11.
27. Zhuang Z, Shen Z, Chen Y, et al. Mapping the Changes of Glutamate Using Glutamate Chemical Exchange Saturation Transfer (GluCEST) Technique in a Traumatic Brain Injury Model: A Longitudinal Pilot Study. ACS Chemical Neuroscience. 2019;10(1):649-657.
28. Cai K, Singh A, Poptani H, et al. CEST signal at 2ppm (CEST@2ppm) from Z-spectral fitting correlates with creatine distribution in brain tumor. NMR Biomed. 2015;28(1):1-8.
29. Chen L, Zeng H, Xu X, et al. Investigation of the contribution of total creatine to the CEST Z-spectrum of brain using a knockout mouse model. NMR Biomed. 2017;30(12).
Figures