4907
Water diffusion is influenced by the changes in regional volume1Division of Regenerative Medicine, Jikei University School of Medicine, Tokyo, Japan, 2RIKEN Center for Brain Science, Saitama, Japan, 3National Institute of Advanced Industrial Science and Technology (AIST), Ibaraki, Japan, 4Department of Radiology, Tokyo Medical University, Tokyo, Japan, 5University of Tsukuba, Ibaraki, Japan, 6Tokyo Metropolitan University, Tokyo, Japan, 7Tokyo Medical University Hospital, Tokyo, Japan, 8Faculty of Health Science, Department of Radiological Technology, Juntendo University, Tokyo, Japan, 9Tokyo Medical University, Tokyo, Japan, 10Keio University School of Medicine, Tokyo, Japan
Synopsis
Keywords: Preclinical Image Analysis, Brain Connectivity, axial diffusivity, marmosets, brain volume
Motivation: A direct examining the volume and diffusion indices of in vivo and ex vivo brains from the same individual is of great interest in linking clinical and histological studies.
Goal(s): The goal of this study is to investigate the relationship between brain volume and diffusion indices in brain using in vivo and ex vivo brains from the same individual.
Approach: Dwi indices and brain volumes of the whole brain, white matter, cerebral cortex, cerebellum, and 52 brain regions were compared in vivo and ex vivo from same individuals.
Results: For each DWI index, AD was correlated with volume change in 40 cortical regions.
Impact: This study successfully compared the same brain in vivo and ex vivo directly, and it sufficiently demonstrates the relationship between volume and diffusion indices. In particular, AD is most sensitive to regional volume changes.
Introduction
Because regional volume in white matter and gray matter reflects the density of neurons, glial cells, or myelin1, the regional brain volume is associated with cognitive function2,3. Diffusion-weighted imaging (DWI), which detects the restricted diffusion of water molecules in the intra/extracellular space, may be affected by changes in cellular membranes4. Therefore, in this study, we aimed to investigate the regional effect of brain volume changes on the restricted diffusion of water molecules in the brain. For this purpose, since it is difficult to study the relationship between water molecule diffusion and local volume in a subject, we chose to examine changes in water molecule restricted diffusion and nerve fiber structure in the brain of the same individual from in vivo brain to ex vivo brain. Furthermore, we focused on the primate common marmoset which more closely resemble human brain structure than rodents and can be used to study higher cognitive brain functions5-7.Methods
Common marmosets (n = 12; 6.0 ± 2.1 years; 2 males and 12 females) were used in this study. MRI was performed using a 9.4T BioSpec 94/30 (Biospin GmbH, Ettlingen, Germany). A transmitting and receiving volume coil with an 86-mm inner diameter was used for in vivo brains, and a transmitting and receiving solenoid type coil with a 28-mm inner diameter was used for ex vivo brains. T2-weighted images and DWI data were obtained to investigate changes in brain volume and water molecule diffusion in these subjects. The animals were administered a mixture of oxygen and isoflurane. The perfusion fixation for ex vivo MRI was performed following in vivo MRI scanning (Figure 1). First, brain volumes of the whole brain, white matter, cerebral cortex, cerebellum, and 52 whole-brain regions were calculated in vivo and ex vivo. Then, we performed noise reduction, correct for B0 field inhomogeneities, eddy currents, and intervolume motion on the obtained DWI data8,9. In addition, we estimated fiber orientation distribution functions and constrained spherical deconvolution10 to generated 100 million streamlines with the anatomically constrained tractography framework11. We used a paired t-test with the Bonferroni correction (α = 0.05) to compare in vivo and ex vivo volume measurements, fractional anisotropy (FA) values, mean diffusivity (MD) values, axial diffusivity (AD) values, radial diffusivity (RD) values, and brain connectivity. The Pearson correlation coefficient was used to assess the linear relationship between brain volume and DWI indices.Results
The ex vivo brain volume was almost significantly reduced in the whole brain compared to the in vivo brain volume (Figure 2). However, there were no statistically significant differences between in vivo and ex vivo volumes in 10 regions (Figure 3). In AD, MD, and RD, the values of each index were significantly reduced in the white and gray matter of the ex vivo brain. FA showed a significant correlation between the DWI indices and volume change in 24 of the 52 regions. In addition, MD and RD showed significant correlations with nine and six regions, respectively. For each DWI index, AD was correlated with volume change in 40 cortical regions. Moreover, there were significant differences in 799 neural connections between in vivo and ex vivo brains (Figure 4).Discussion
By examining the volume and diffusion indices of in vivo and ex vivo brains from the same individual, this study successfully compared the same brain in vivo and ex vivo directly, and it sufficiently demonstrates the relationship between volume and diffusion indices. Notably, AD showed the largest number of regions with significant correlations to volume change and higher correlation coefficients (Figure 5). These results suggest that AD is most sensitive to tissue volume change. A previous study on Alzheimer’s disease, in which the regional volume was reduced, reported that AD is more sensitive in detecting early changes in Alzheimer’s disease12, which supports our findings. This result suggests that AD can be used to assess and predict the stages of dementia and age-related brain atrophy and may have the potential to make a significant positive contribution to clinical practice. Moreover, when structural atrophy was small, neural connectivity based on that region was maintained, and changes in that connectivity were also small. Therefore, it can be said that brain volume changes and neural network changes are closely related and that changes in the ex vivo neural structural network depend on the degree of brain volume change.Conclusion
We clarified the correlation of water molecule diffusion, water molecular anisotropy, and nerve fiber structure with brain volume in the same individual.Acknowledgements
This work was supported by the program for Brain Mapping by Integrated Neurotechnologies for Disease Studies (Brain/MINDS) from the Japan Agency for Medical Research and Development (AMED; Grant Numbers JP15dm0207001 to H.O.).References
1. Giorgio A, De Stefano N. Clinical use of brain volumetry. J Magn Reson Imaging 2013;37(1):1-14.
2. MacLullich AM, Ferguson KJ, Deary IJ, Seckl JR, Starr JM, Wardlaw JM. Intracranial capacity and brain volumes are associated with cognition in healthy elderly men. Neurology 2002;59(2):169-174.
3. Ramanoel S, Hoyau E, Kauffmann L, et al. Gray Matter Volume and Cognitive Performance During Normal Aging. A Voxel-Based Morphometry Study. Front Aging Neurosci 2018;10:235.
4. Harkins KD, Galons JP, Secomb TW, Trouard TP. Assessment of the effects of cellular tissue properties on ADC measurements by numerical simulation of water diffusion. Magn Reson Med 2009;62(6):1414-1422.
5. Buckner RL, Margulies DS. Macroscale cortical organization and a default-like apex transmodal network in the marmoset monkey. Nat Commun 2019;10(1):1976.
6. Hata J, Nakae K, Tsukada H, et al. Multi-modal brain magnetic resonance imaging database covering marmosets with a wide age range. Sci Data 2023;10(1):221.
7. Okano H. Current Status of and Perspectives on the Application of Marmosets in Neurobiology. Annu Rev Neurosci 2021;44:27-48.
8. Veraart J, Fieremans E, Novikov DS. Diffusion MRI noise mapping using random matrix theory. Magn Reson Med 2016;76(5):1582-1593.
9. Andersson JLR, Sotiropoulos SN. An integrated approach to correction for off-resonance effects and subject movement in diffusion MR imaging. Neuroimage 2016;125:1063-1078.
10. Jeurissen B, Tournier JD, Dhollander T, Connelly A, Sijbers J. Multi-tissue constrained spherical deconvolution for improved analysis of multi-shell diffusion MRI data. Neuroimage 2014;103:411-426.
11. Smith RE, Tournier JD, Calamante F, Connelly A. Anatomically-constrained tractography: improved diffusion MRI streamlines tractography through effective use of anatomical information. Neuroimage 2012;62(3):1924-1938.
12. Nir TM, Jahanshad N, Villalon-Reina JE, et al. Effectiveness of regional DTI measures in distinguishing Alzheimer's disease, MCI, and normal aging. Neuroimage Clin 2013;3:180-195.
Figures
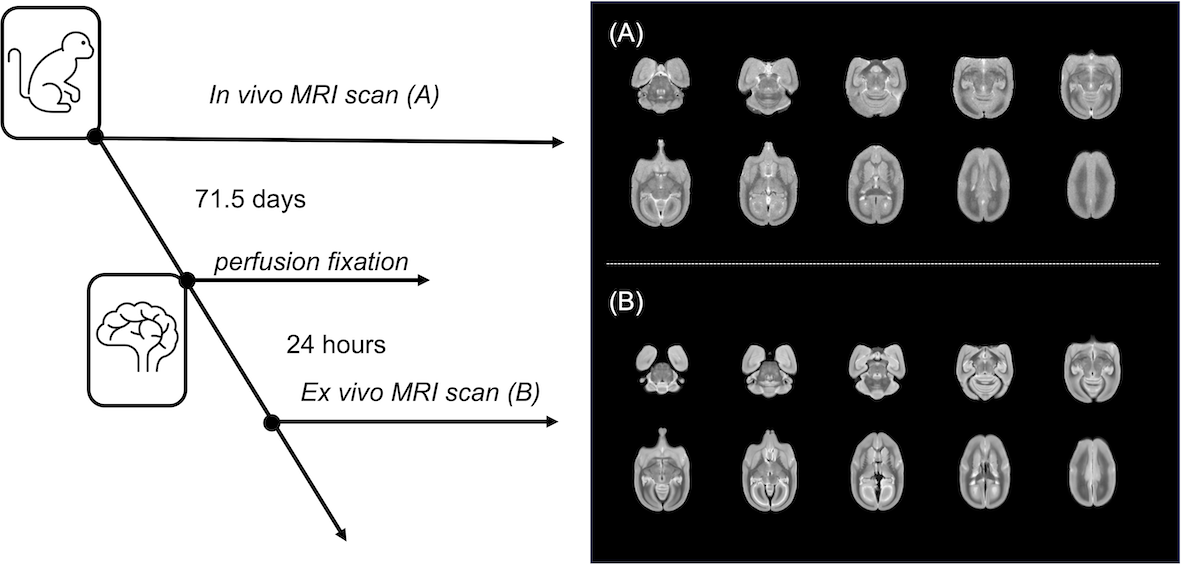
Figure 1. Schematic of the experimental paradigm and T2-weighted images of in vivo and ex vivo brains in the common marmoset.
Experimental schedule from the in vivo MRI scan to the ex vivo MRI scan after perfusion fixation. Right upper figure (A) is an example of an in vivo T2-weighted image and right lower figure (B) is an example of an ex vivo T2-weighted image.
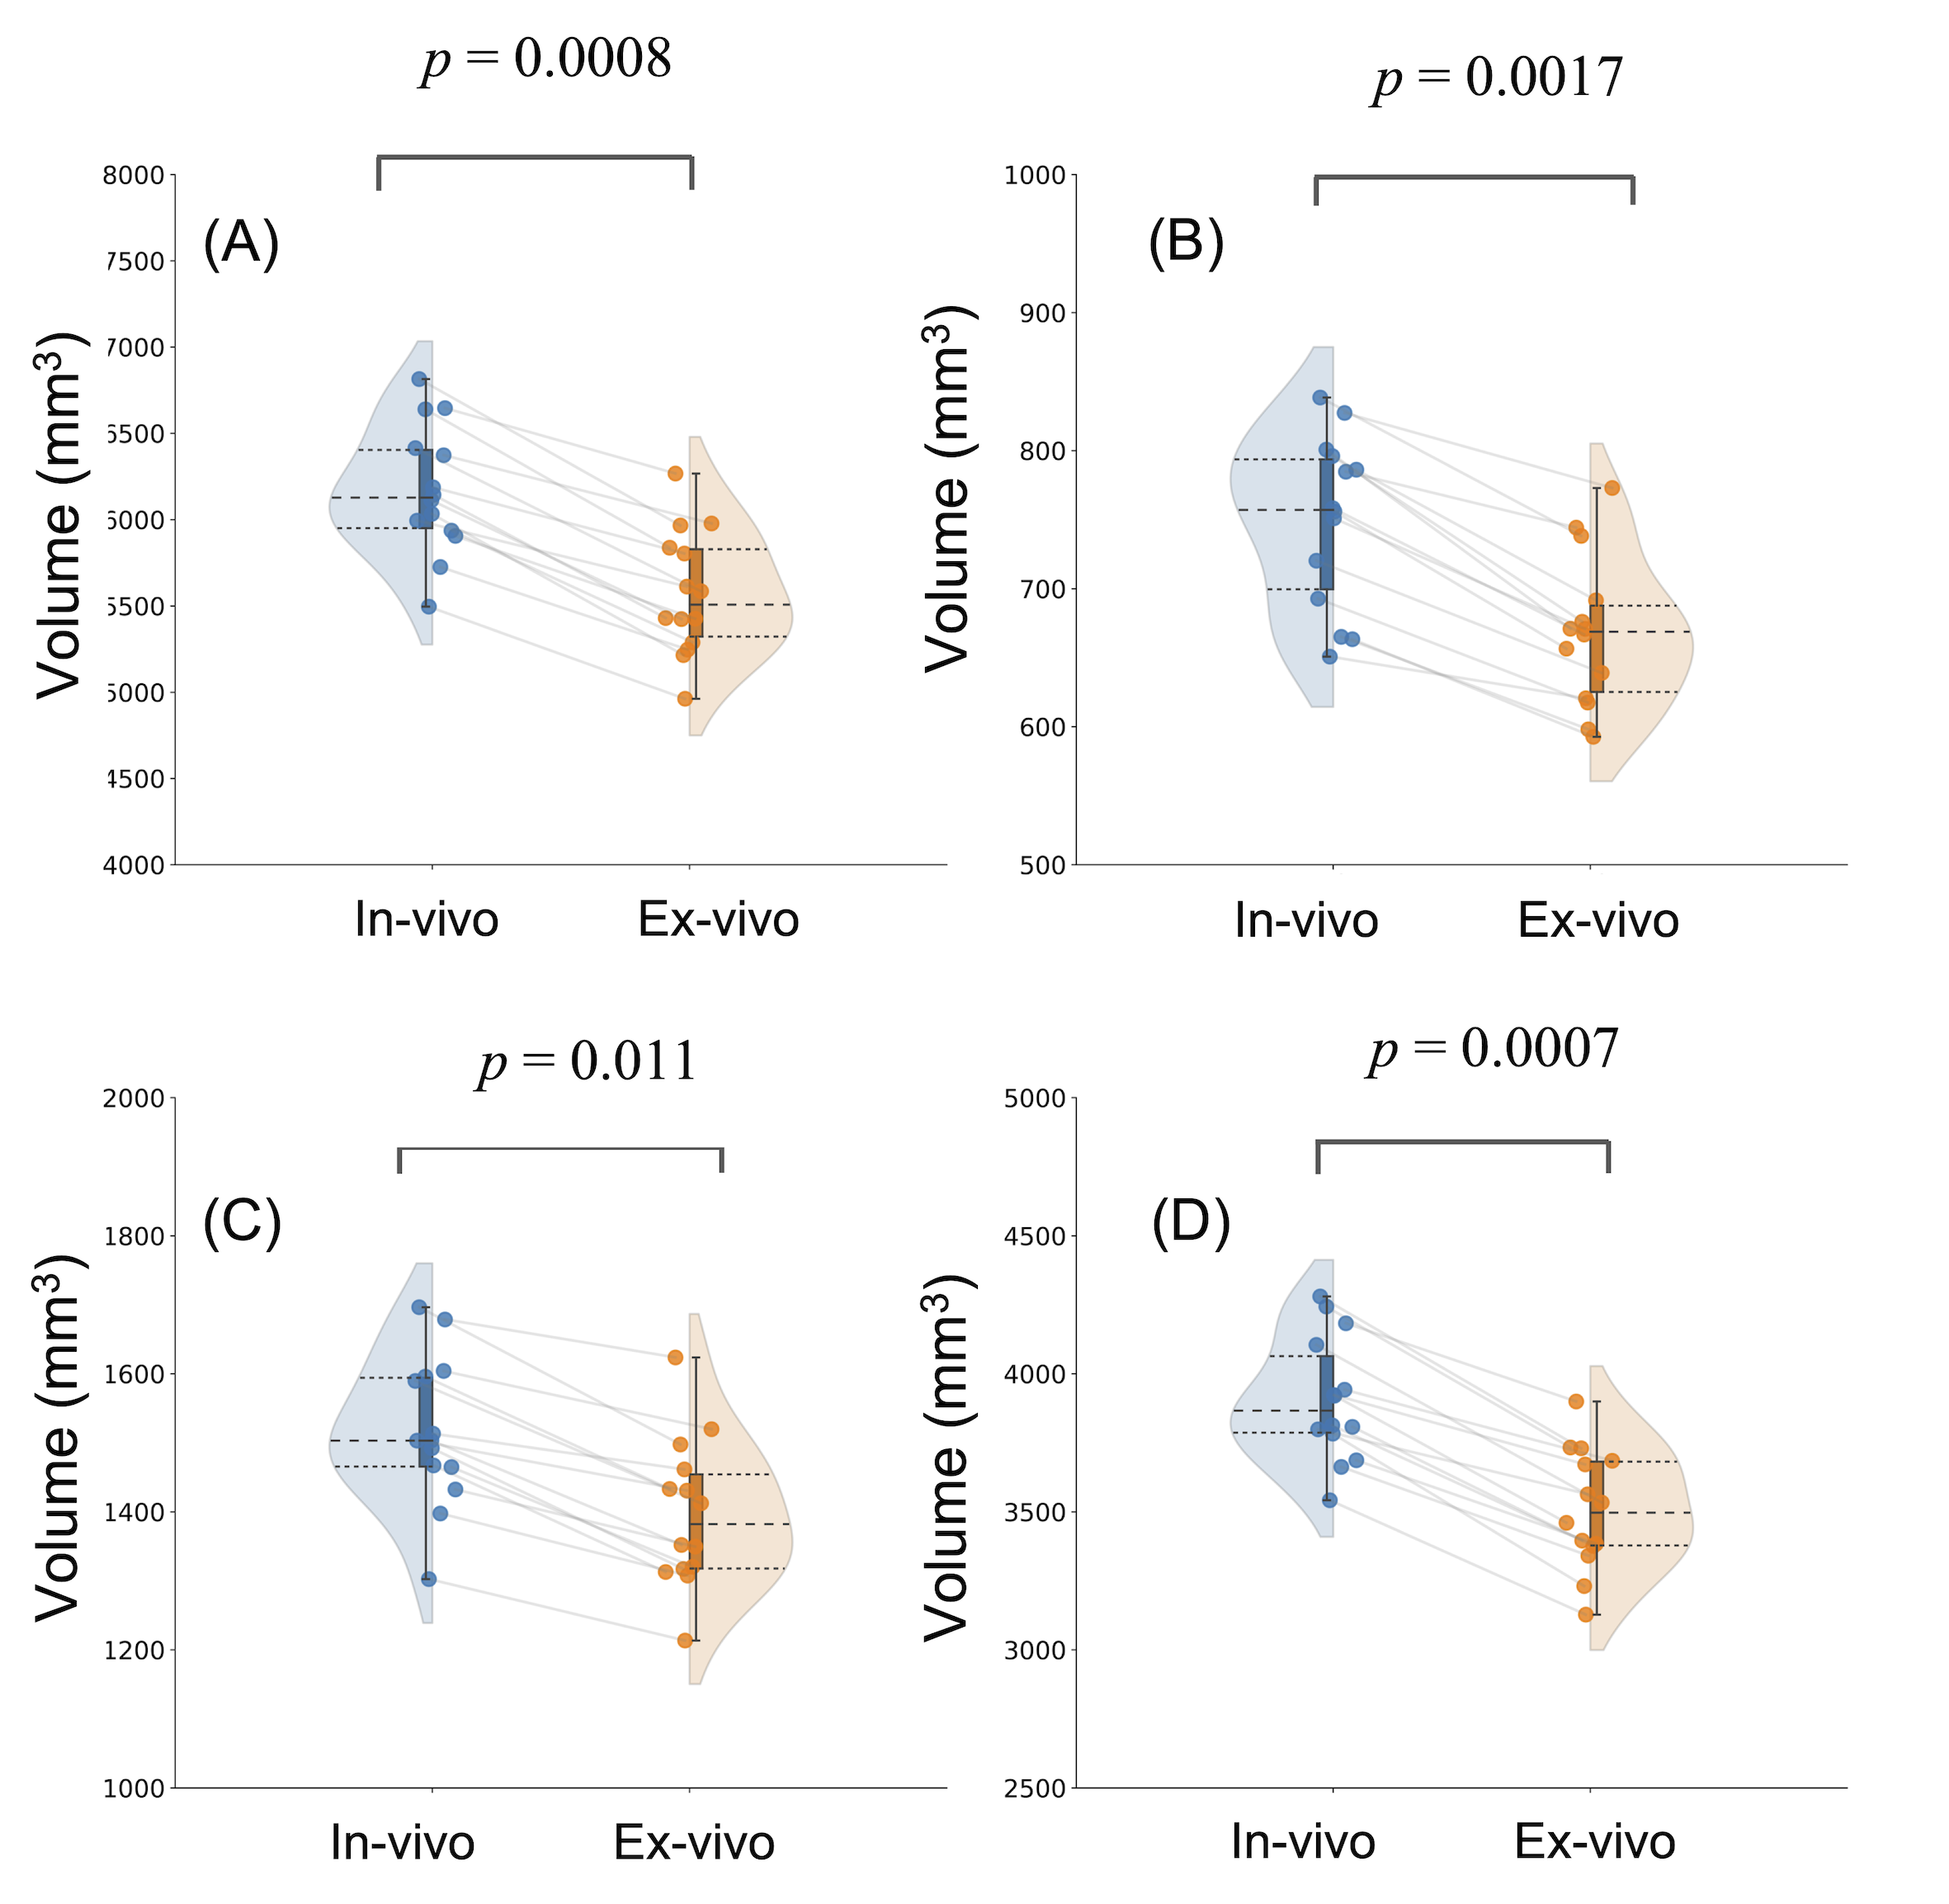
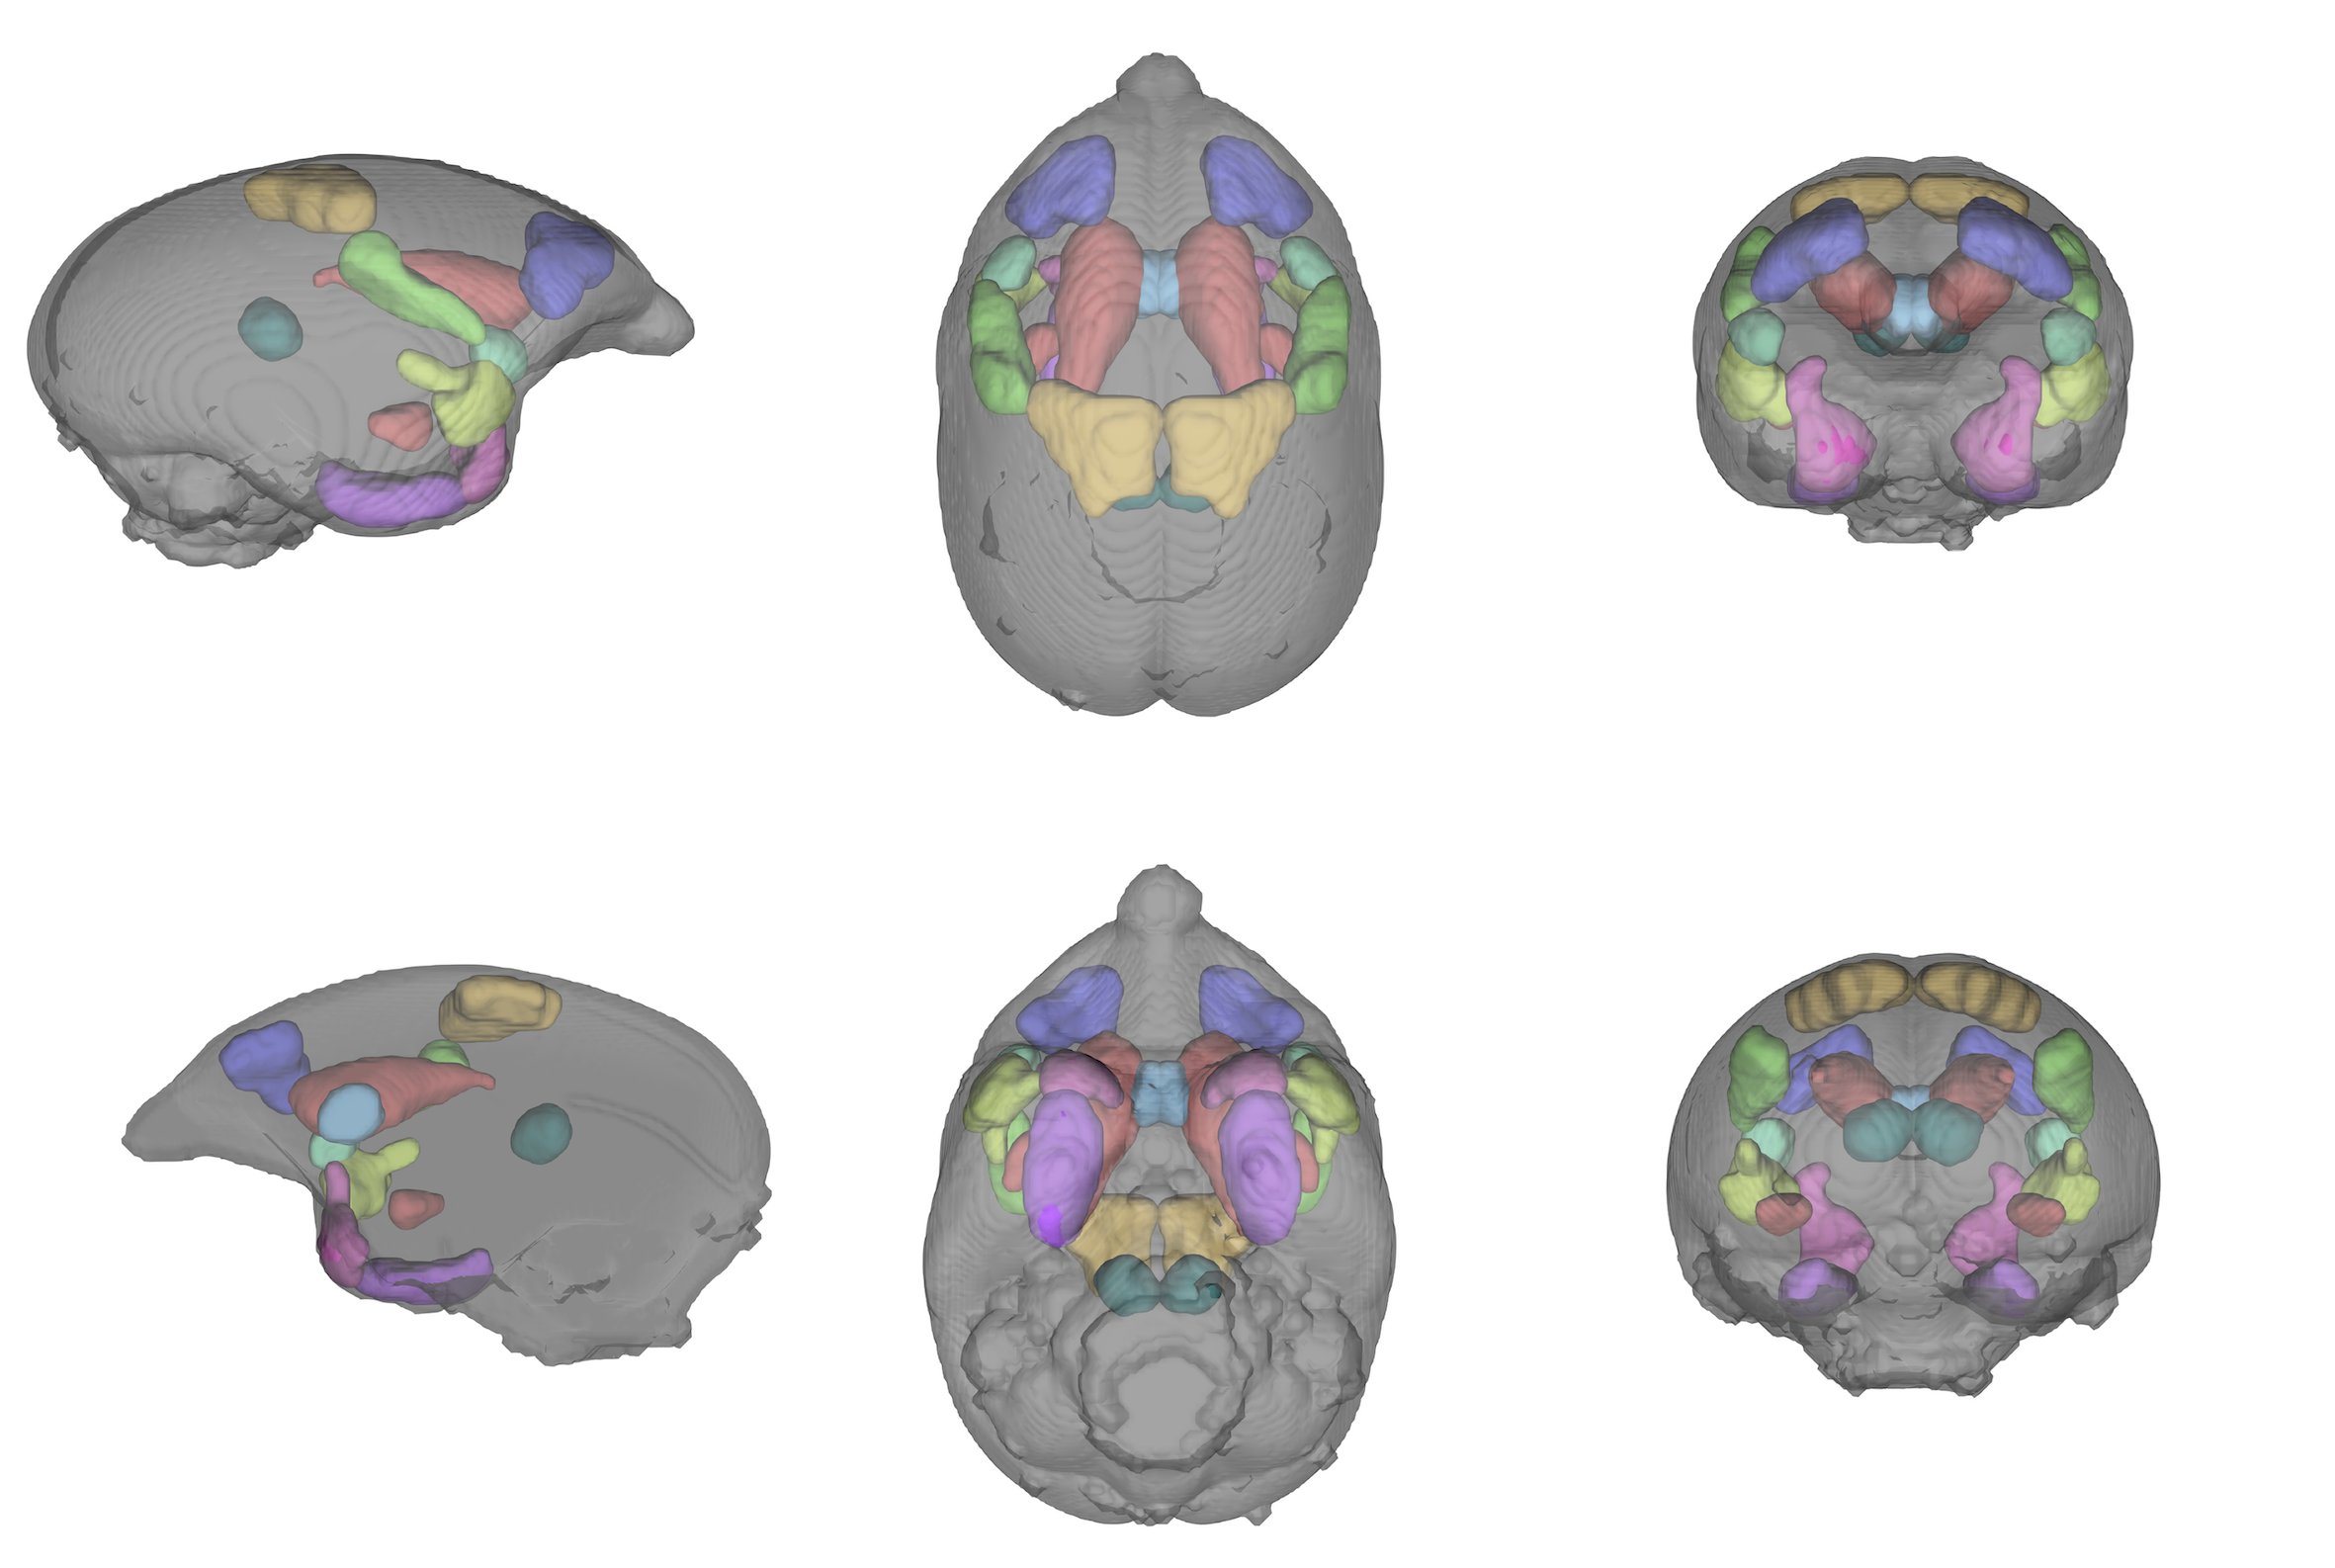
Figure 3. Image showing brain regions whose volumes did not decrease significantly between in vivo and ex vivo conditions following perfusion fixation.
Ten regions that did not show statistically significant differences between in vivo and ex vivo brains are shown. These regions are the pisiform cortex, intraolfactory cortex, dorsolateral prefrontal cortex, septal nucleus, gustatory cortex, secondary somatosensory cortex, superior temporal rostrum, postal parietal region, caudate nucleus, and superior colliculus.
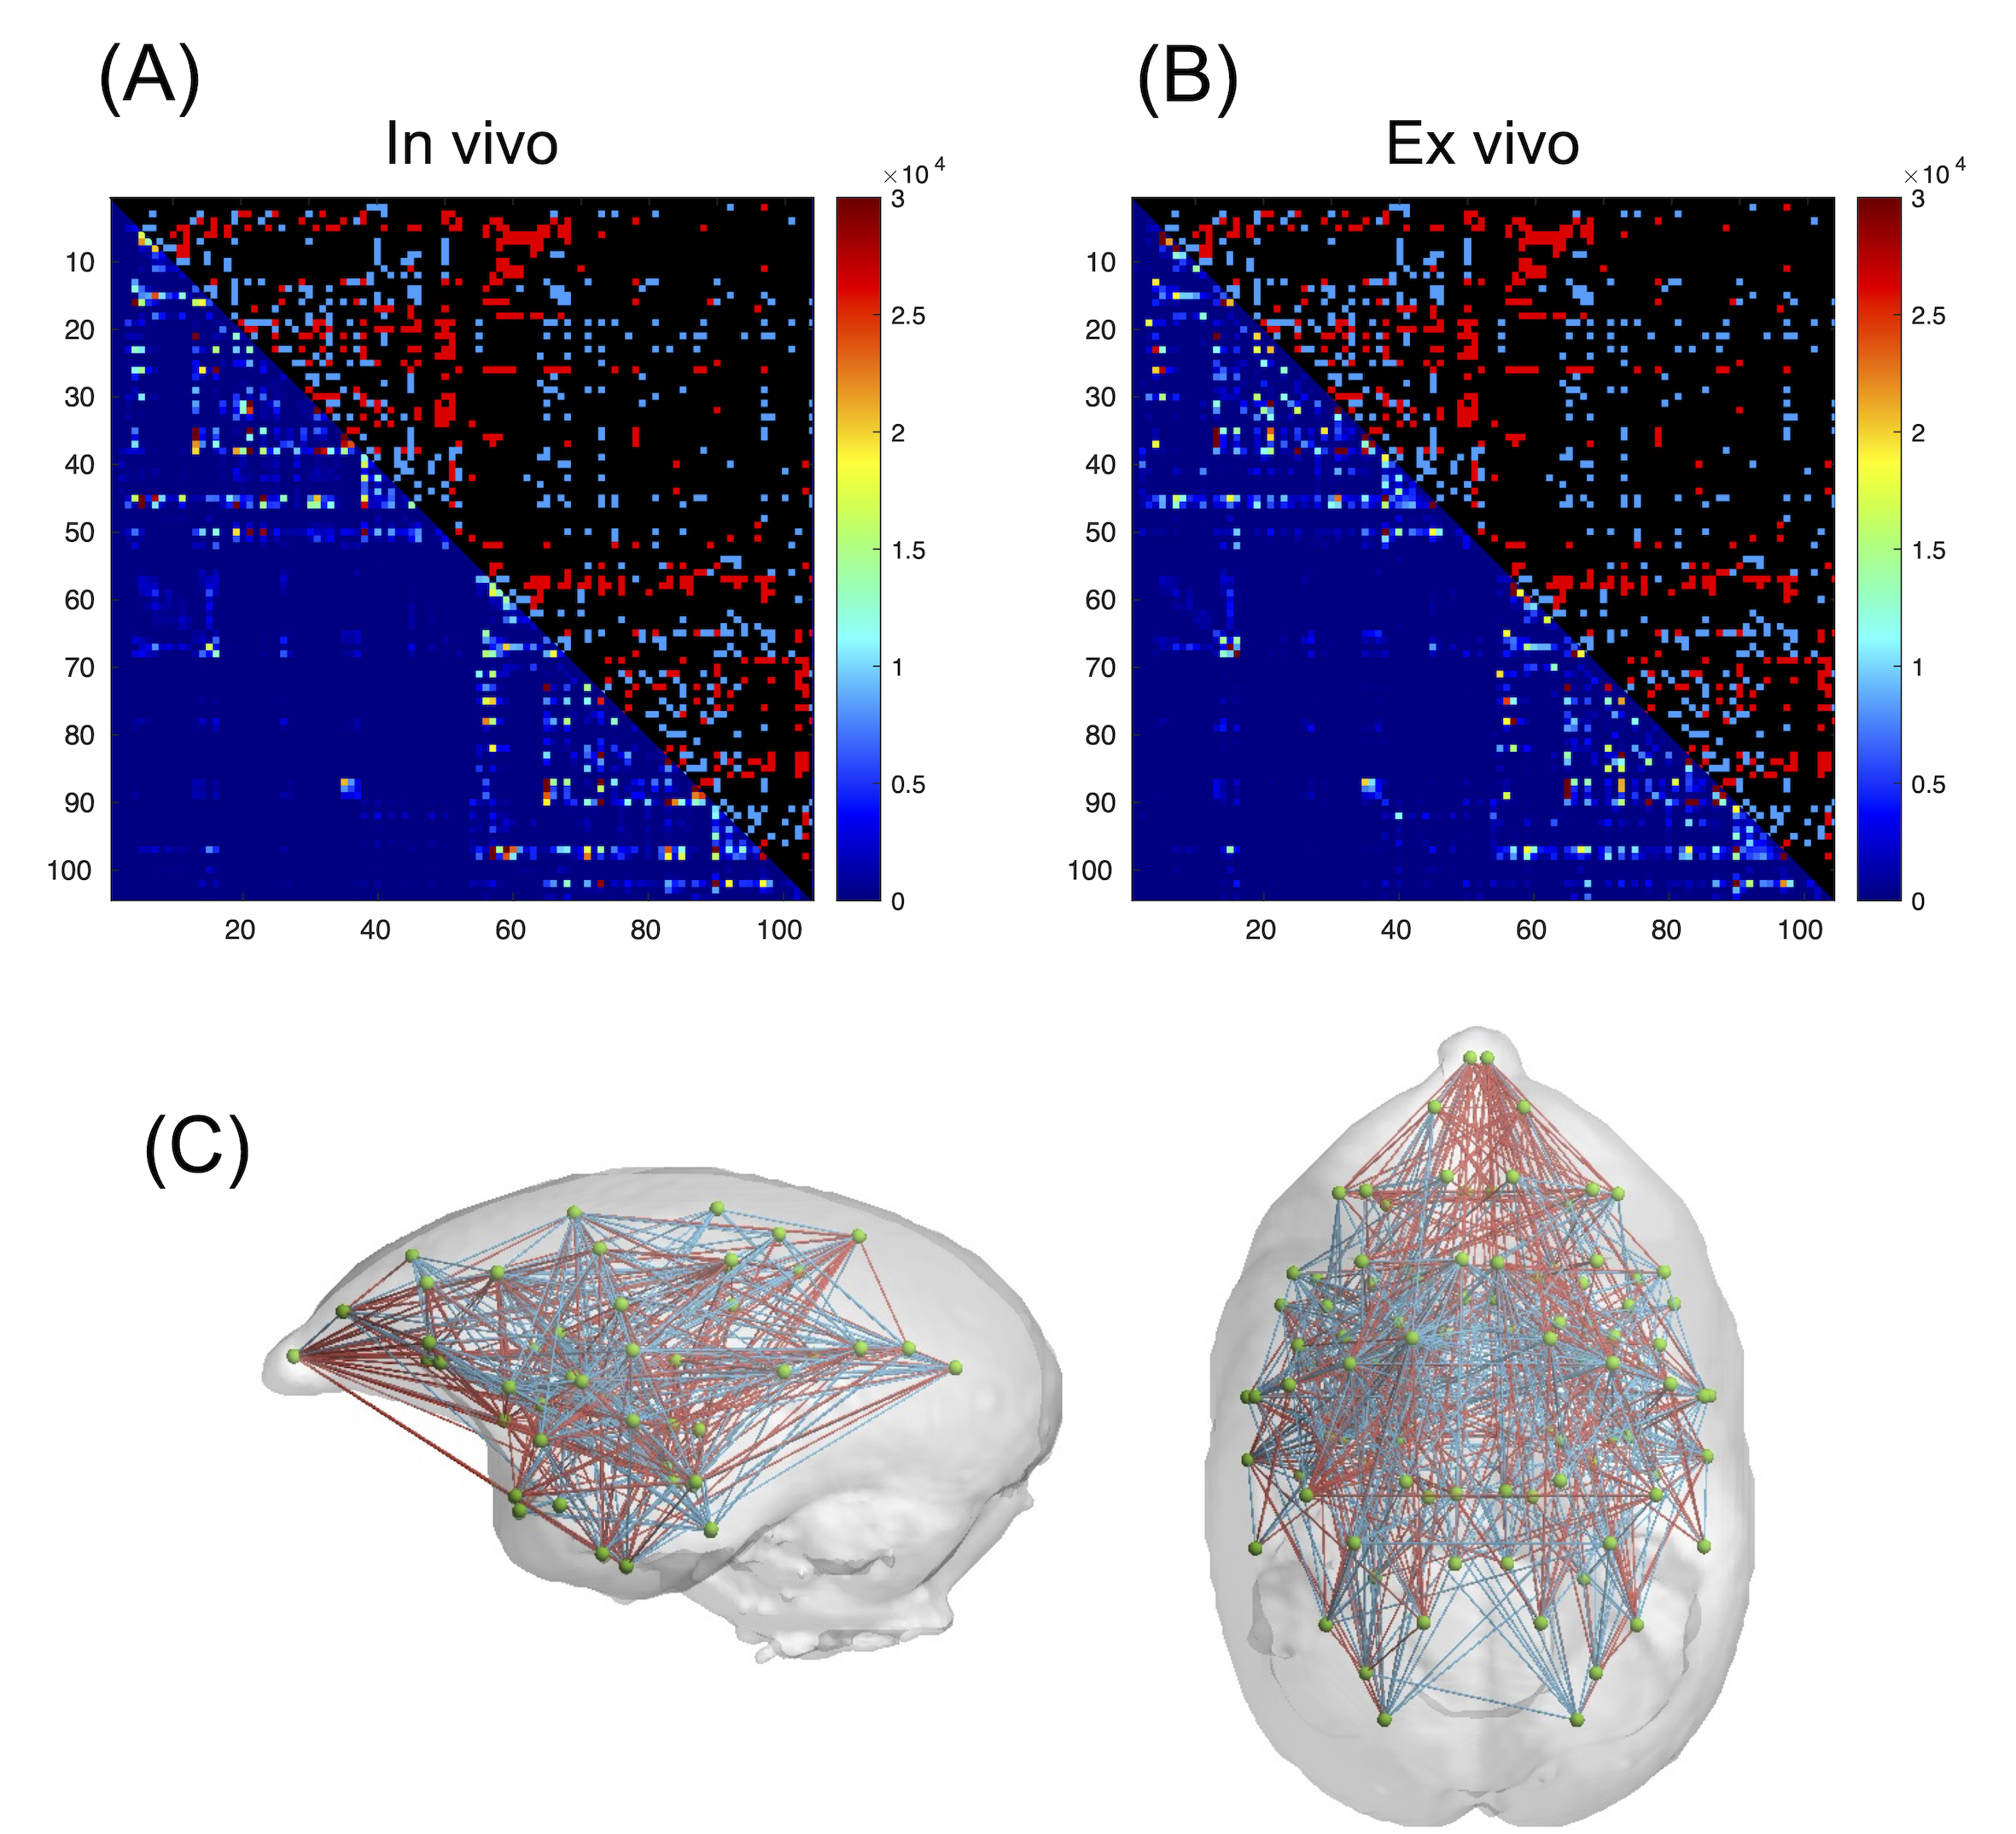
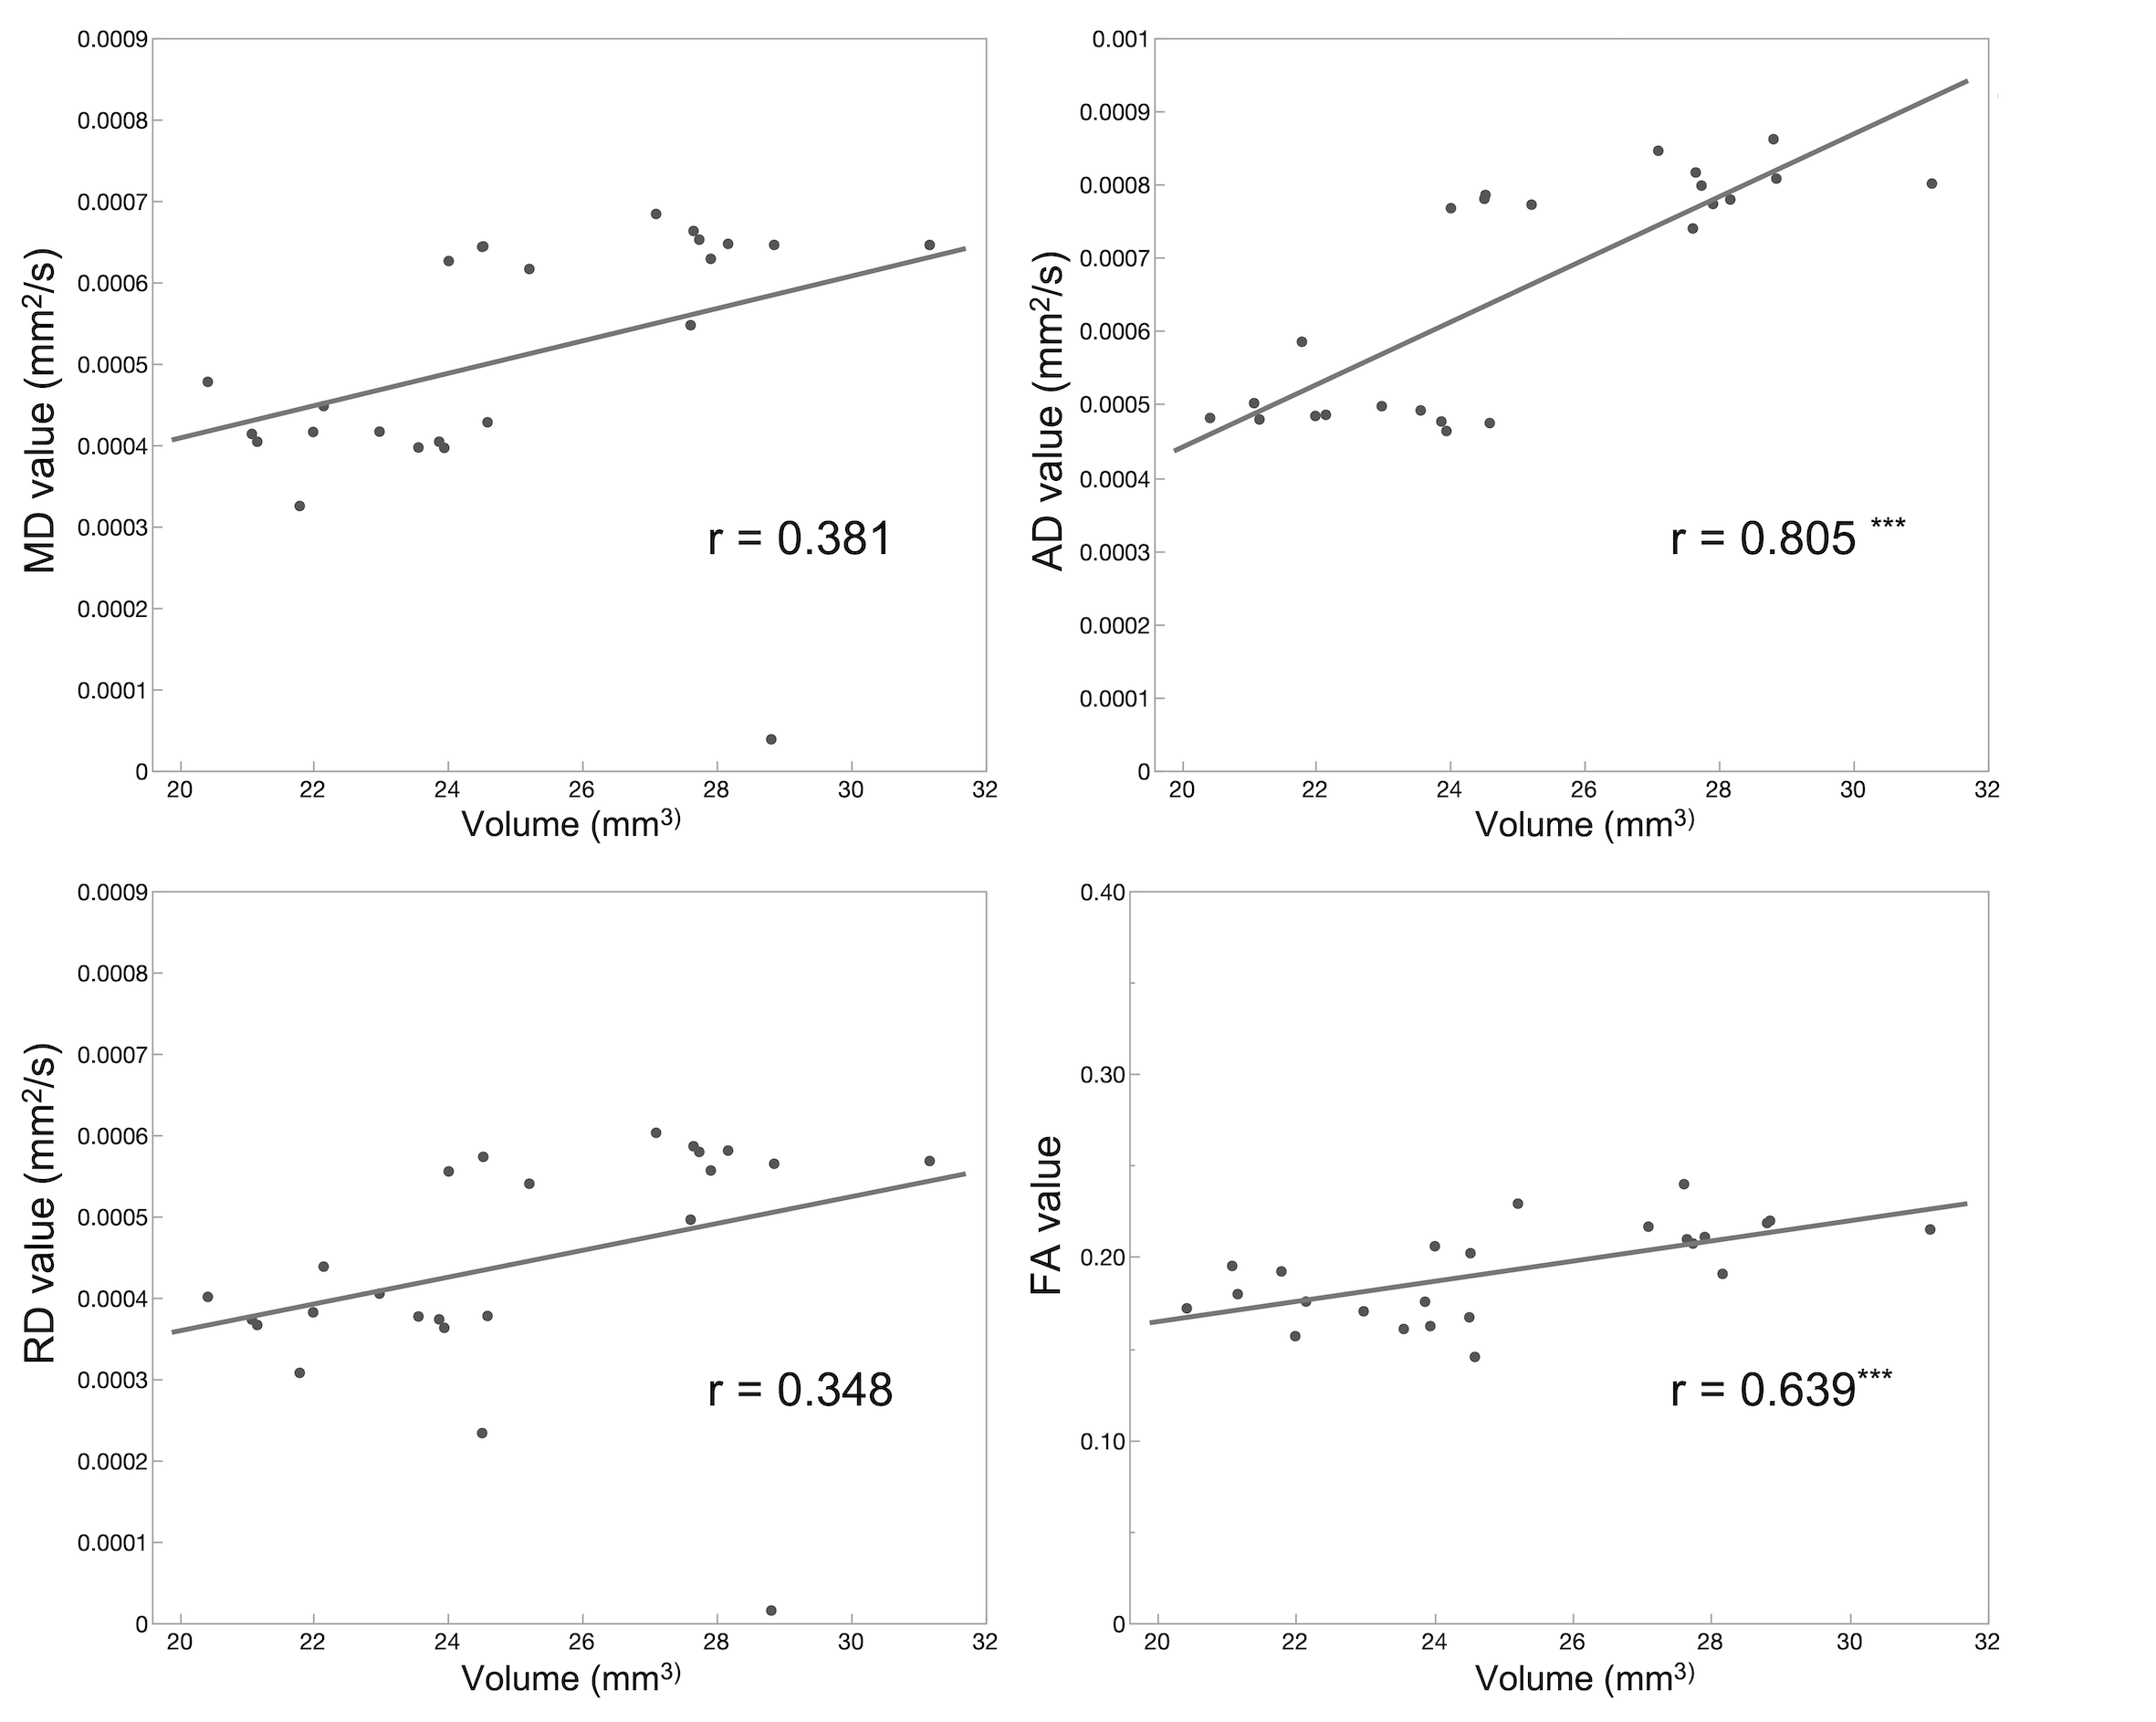
Figure 5. The relationship between DWI indices and volume changes in cortical regions.
The figure shows the correlation between the DWI indices MD, AD, RD, and FA and the volume change of cortical areas. The results for the frontal pole are shown here as an example. The Pearson correlation coefficient (r) was used to assess the linear relationship between brain volume and DWI indices. Significant correlations are indicated by an asterisk in the upper right corner of the correlation coefficient (*p < 0.05, **p < 0.01, ***p < 0.0001).