4905
T2*-mapping of the mouse brain at 7T with a 3D Multi Gradient Echo Sequence.1CRMSB, CNRS, Bordeaux, France, 2GIN-IMN, CNRS, Bordeaux, France
Synopsis
Keywords: Small Animals, Relaxometry
Motivation: Measuring T2* in mouse brains may therefore be of interest in assessing pathological models or innovative treatments directed against these pathologies.
Goal(s): The goal of this study was to obtain a high resolution and accurate T2* map of the mouse brain ex vivo and in vivo.
Approach: A 3D Multi Gradient Echo sequence with a drift compensation module was used and combined with an optimized fitting model which takes account the non-central chi distribution of the multi-channel gaussian noise.
Results: T2* map were obtained ex vivo and in vivo at 117 µm isotropic resolution in 20 minutes.
Impact: A high-resolution 3D Multi-Gradient Echo sequence sequence has been coupled with an optimized fitting algorithm to generate high resolution T2* map of the mouse brain. This method can be used to study preclinical stroke model.
Introduction
Quantitative T2* MRI is commonly used in human for analysing iron deposition in the heart or liver and also in the brain after a stroke [1]. Measuring T2* in mouse brains may therefore be of interest in assessing pathological models or innovative treatments directed against these pathologies. However, reproducibly T2* mapping in small animal brains remains a challenge. Indeed, it is necessary to obtain parametric maps with high spatial resolution (<150µm) and in 3D. Acquisitions are generally carried out at high magnetic fields, which has the effect of increasing susceptibility and generating short T2* Long acquisition times also generate potential resonance frequency drift and hence artifacts on the parametric maps.The aim of our work is therefore to propose a Multi Gradient Echo (MGE) sequence combined with a robust fitting method to obtain highly resolved 3D T2* maps on mouse models. Acquisitions were performed first ex vivo and then in vivo on C57Bl/6 and BALB/c models.Methods
Materials: Experiments were performed on a 7T Bruker BioSpec system equipped with a volume resonator (75.4mm inner diameter, active length 70mm) for excitation, and a 4‐element (2×2) phased surface cryoprobe for signal reception.Ex vivo Brain images: Brains were extracted and incubated (N=5) or not with Gd-DOTA (3mM) (N=5), then placed in a plastic tube. The brain was installed at the center of the MR coil.
In vivo Brain images: Mice (N=5) were anesthetized with isoflurane (1.5-2% in air) and positioned with the brain at the center of the MR coil. Animal breathing and temperature were monitored during the scanning session and maintained at 60-90 resp/min and 37°C+/-0.8.
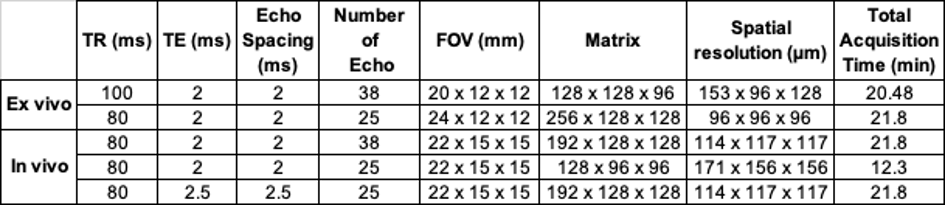
Sequence: A 3D monopolar Multi-Gradient-Echo sequence was used with parameters describe in Table.1. A drift compensation module was added every TR before the acquisition and enabled to reset the acquisition frequency in real-time.
T2* mapping: The data were reconstructed with Julia using the package MRIReco.jl [2]. Specific masks covering the whole brain were designed with 3D Slicer. For the T2* calculation, 3 fitting models have been tested: the offset model, the truncation model and the second moment noise model (M2NCM) [3]. The offset model adds a free parameter to the Bloch equation to represent the contribution from iron-poor species and noise. The truncation model tries to minimize the impact of the noise by fitting the data with high intensity only: it consists of removing the last echo, one by one, until the R2 is high enough. The second moment noise model takes into account the non-central chi distribution of the multichannel gaussian noise. All the curve fits were perform using a Levenberg-Marquardt optimization.
Results
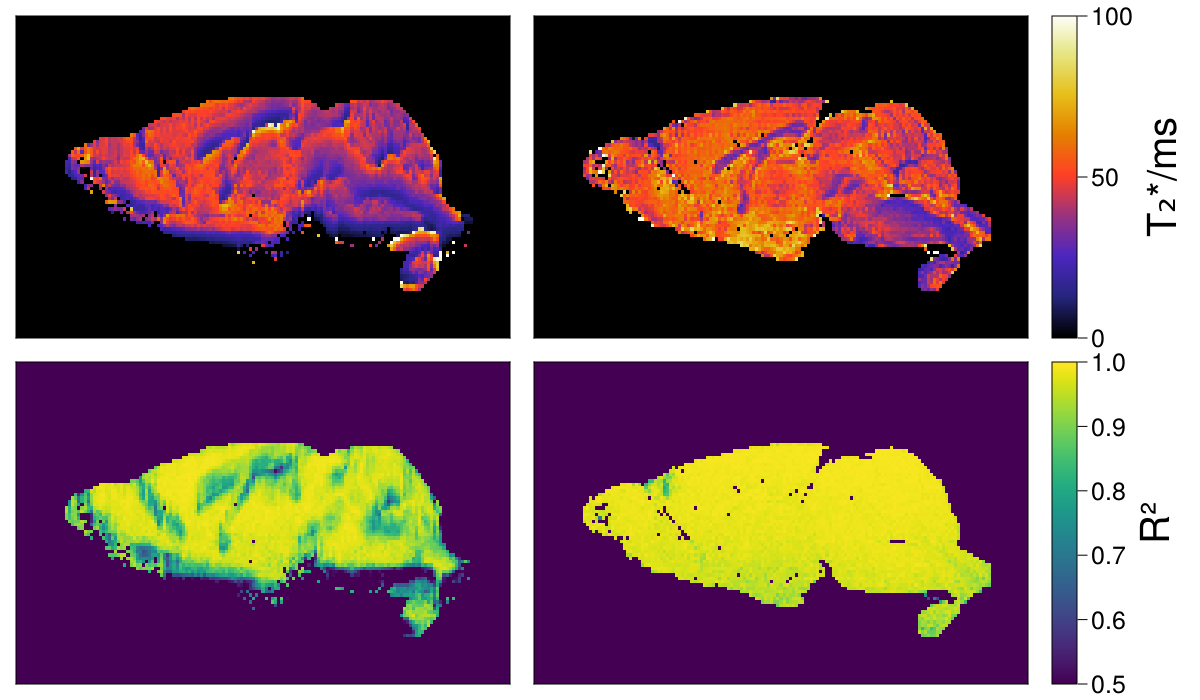
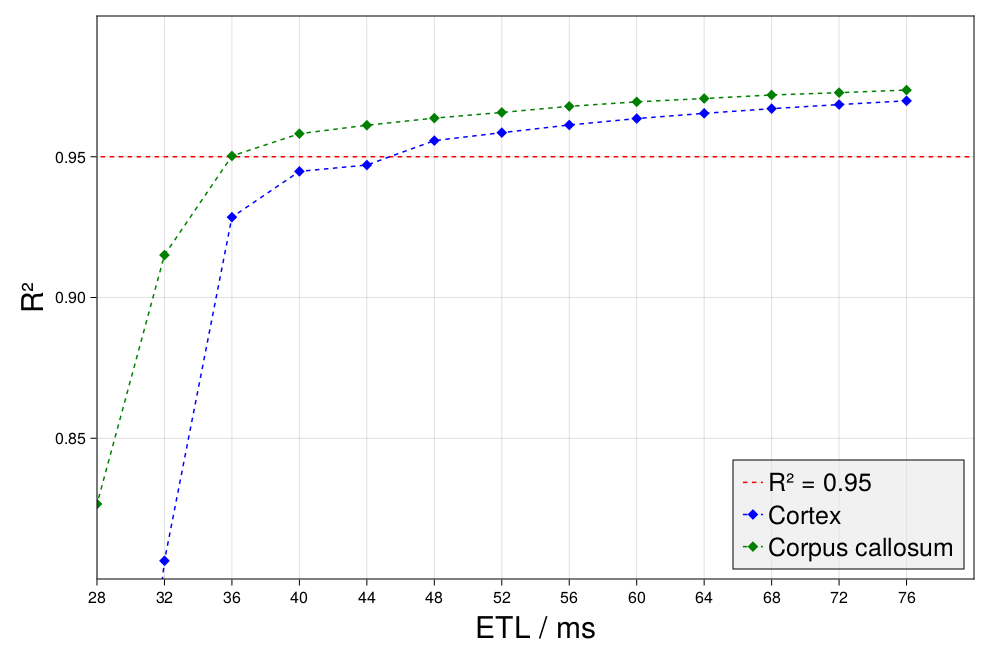
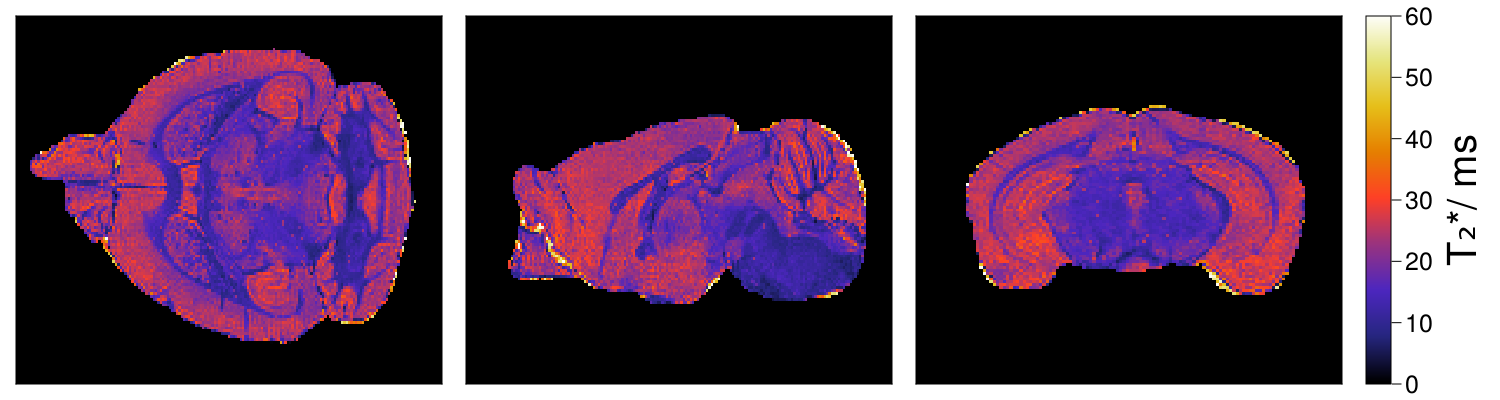
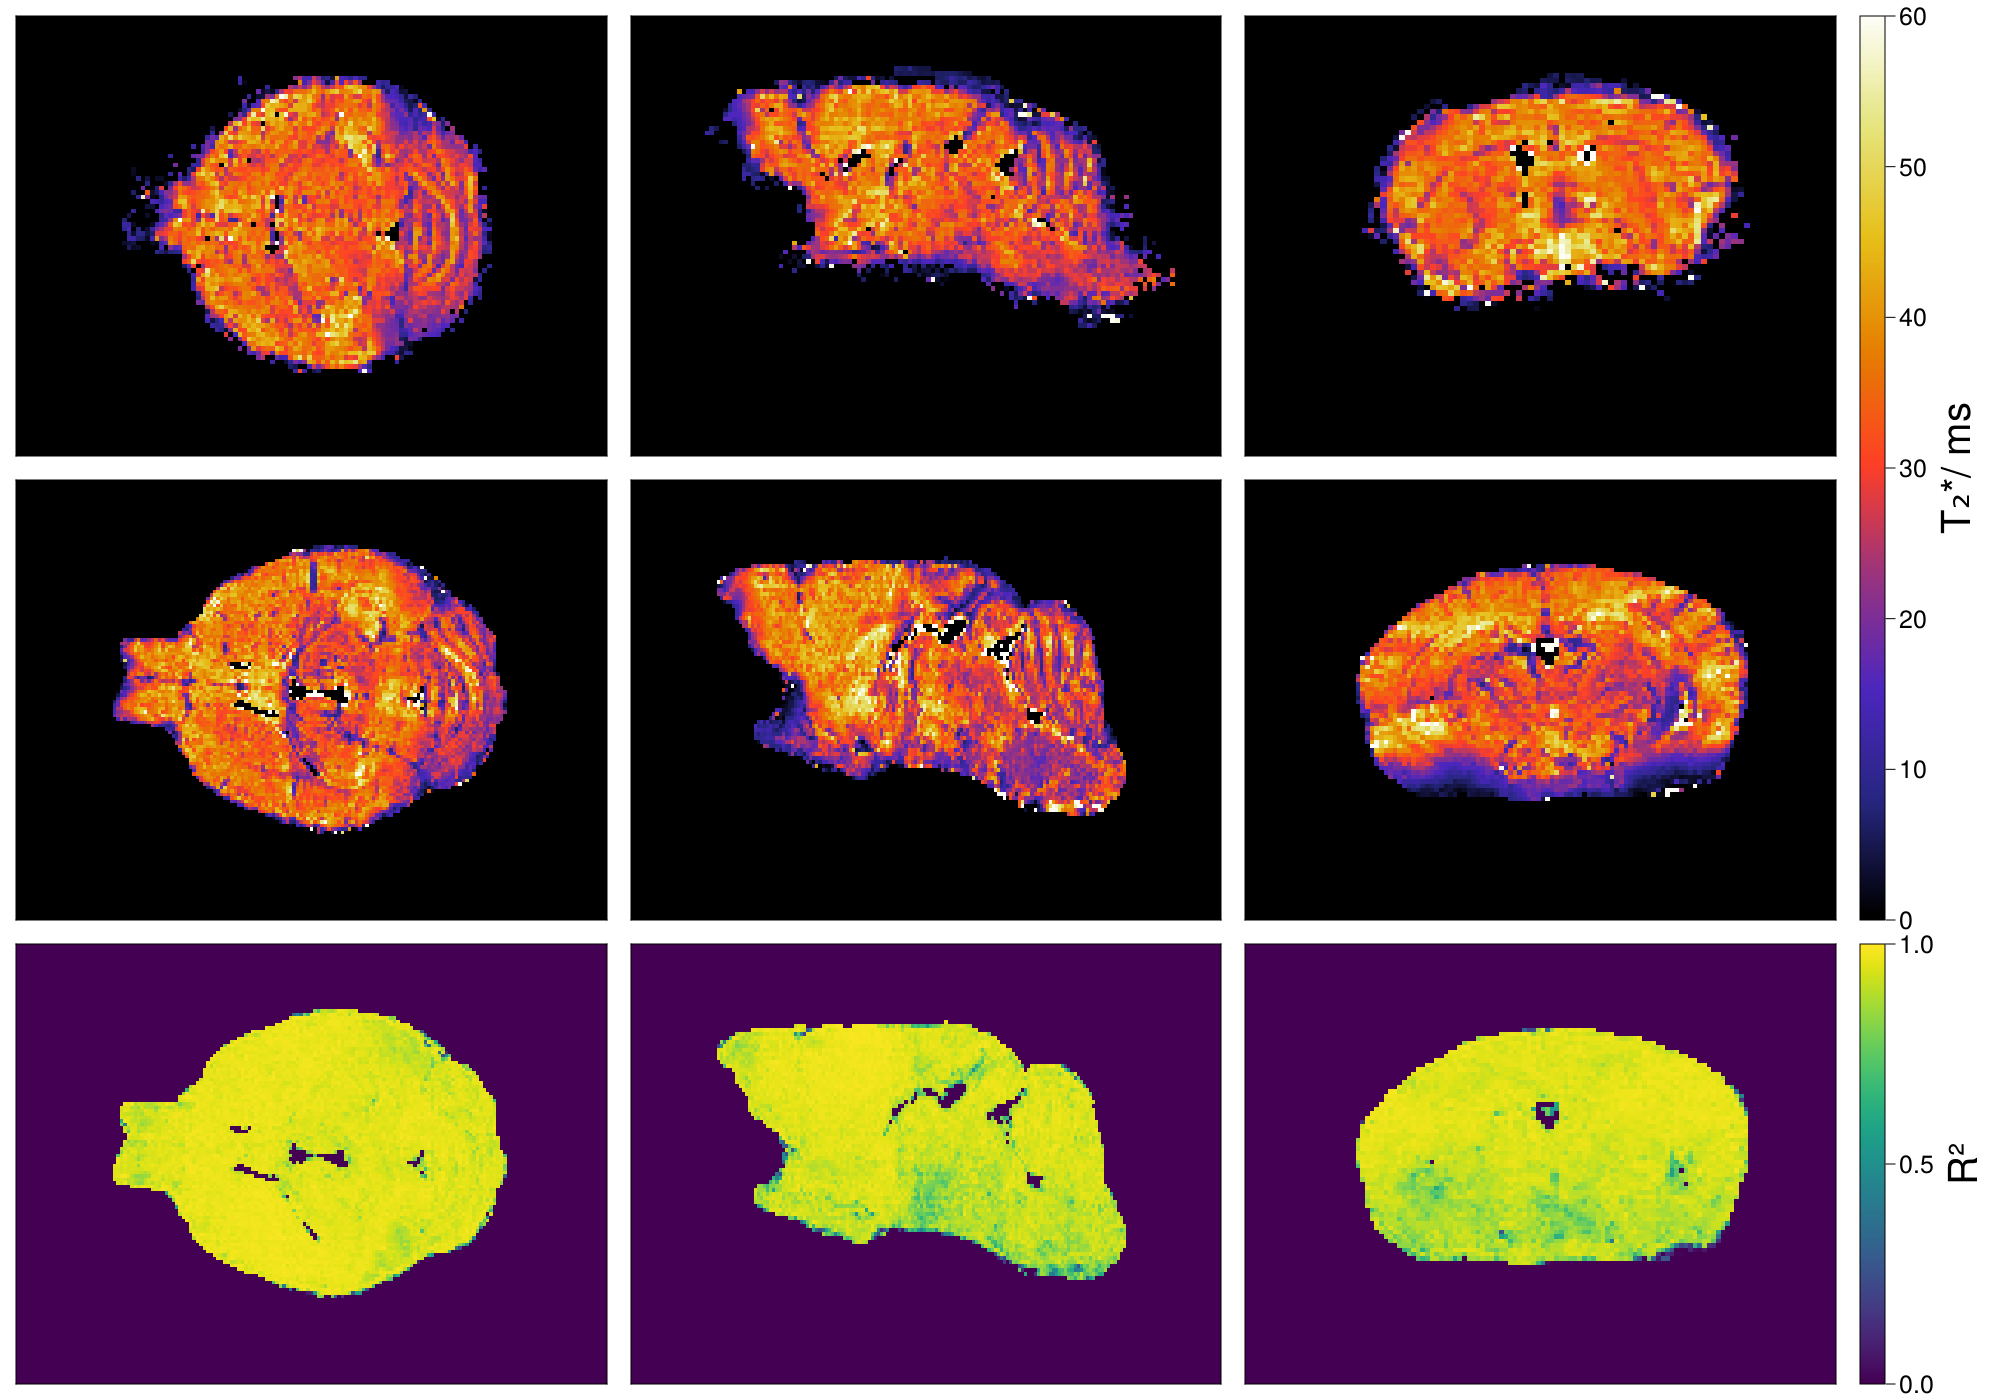
Due to the intensive use of the magnetic field gradients (>75% gradient duty cycle), a frequency drift of the MRI can be observed after less than 5 minutes of acquisition, leading therefore to a displacement of the brain on the images. The use of the Drift Compensation module corrected this issue (Fig. 1).Ex vivo acquisitions were used to compare the 3 fitting models. The M2NCM provides a more robust fitting and a better precision in the values than the two other models.Figure 2 shows the influence of the ETL (Echo Train Length) on the R2 values of the T2* decay fit, and demonstrates that the ETL must be equal at least 1.5 times the T2* measured.High-quality high-resolution 3D maps were obtained ex vivo and in vivo, and T2* values could be measured in each brain area. For example, ex vivo, T2* of the cortex was equal to 23.9±2.6ms and 48.1±3.6ms for brain doped (Fig.3) or not (Fig.1) with Gd-DOTA, respectively. Figure 4 shows a representative T2* maps obtained in vivo at an intermediate (171x156x156µm) spatial resolution in 12min and at 115µm isotropic in 21min. The R2 map is also shown in Fig.4 (last line). In vivo, T2* was equal to 33.1±5.2ms in the cortex and 25.75±6.9ms in the corpus callosum.Conclusion
In conclusion, we developed a 3D T2* mapping method of the mouse brain at 7T. Maps can be obtained in less than 12min with a spatial resolution of 150µm and 22min for 115µm isotropic. The addition of the drift compensation module is mandatory to generate quality maps. The M2NCM method proved to be the most robust for data fitting. These preliminary results show that it is possible to generate 3D T2* mappings of the whole brain of mice at high magnetic fields. However, it will be necessary to test complementary approaches such as motion correction or respiratory synchronization to obtain reproducible maps. This will enable cohorts of animals to be compared with each other.Acknowledgements
No acknowledgement found.References
1. Linck PA, Kuchcinski G, Munsch F, Griffier R, Lopes R, Okubo G, Sagnier S, Renou P, Asselineau J, Perez P, Dousset V, Sibon I, Tourdias T. Neurodegeneration of the Substantia Nigra after Ipsilateral Infarct: MRI R2* Mapping and Relationship to Clinical Outcome. Radiology. 2019 May;291(2):438-448. doi: 10.1148/radiol.2019182126.
2. Knopp T, Grosser M. MRIReco.jl: An MRI reconstruction framework written in Julia. Magn Reson Med. 2021 Sep;86(3):1633-1646. doi: 10.1002/mrm.28792.
3. Feng Y, He T, Gatehouse PD, Li X, Harith Alam M, Pennell DJ, Chen W, Firmin DN. Improved MRI R2* relaxometry of iron-loaded liver with noise correction. Magn Reson Med. 2013 Dec;70(6):1765-74. doi: 10.1002/mrm.24607.
Figures