4903
Measurement of awake rats CSF pulsation using EPI-based resting-state fMRI data1KAIST, Daejeon, Korea, Republic of
Synopsis
Keywords: Neurofluids, Neurofluids
Motivation: This research aims to explore the relationship between CSF dynamics and BOLD signals using EPI-based resting-state fMRI data from an open database of rat models.
Goal(s): Rodents and humans are compared regarding CSF dynamics and the BOLD signal.
Approach: The study computes temporal correlations between CSF pulse, CSF edge, and the BOLD signal.
Results: While in resting state, both CSFpulse and CSFedge indices were correlated with global BOLD, exhibiting a stronger correlation for CSFedge and varying peak correlations at -1s, -10s, and +11s. The temporal correlation between CSF dynamics and global BOLD indicates differences in CSF physiology in humans compared to smaller animals.
Impact: The study results imply differing
correlation coefficients between CSF dynamics and the BOLD signal, suggesting
promising pathways for deeper investigations into brain CSF dynamics in small animal
models and neuroscientific advancements using EPI-based fMRI database.
Introduction
Cerebrospinal fluid plays an important role in clearing wastes from the brain. While CSF flow dynamics have conventionally been studied using phase contrast MRI, recent studies have demonstrated that CSF flow dynamics can be investigated dynamically with echo planar imaging (EPI)-based fMRI1,2. In modern neuroscience, exploring the correlation between CSF and blood oxygen level dependent (BOLD) signals present new perspectives on enhancing our understanding of the intricate interplay between brain activity and blood flow dynamics1,2. While prior investigations predominantly focused on studying CSF dynamics in humans, this research introduces a novel perspective by applying a CSF analysis technique2 to EPI-based fMRI in small animal models like rats in order to investigate the relationship between CSF dynamics and the BOLD without necessitating additional imaging modalities2.Method
This study utilized an open dataset of resting-state functional MRI (fMRI) conducted in awake rats, available from NITRC3. The dataset consisted of 90 adult male Long-Evans rats and was acquired using a 7T Bruker MRI scanner, with nine rats specifically selected for this study. The MRI scanner utilized an interleaved acquisition slice order, suitable for the CSF pulse technique. The scan parameters were pulse sequence of single-shot gradient-echo echo-planar imaging (GE-EPI), repetition time (TR) = 1000 ms, echo time (TE) = 15 ms, matrix size = 64 × 64, field of view (FOV) = 3.2 × 3.2 cm², number of slices = 20, thickness = 1 mm, no gap between slices, flip angle = 60°. The acquired EPI images underwent pre-processing steps similar to a previous study1, involving despiking, registration, and motion correction with the application of SPM12. Un-despiked 120 time series from each image were selected and filtered within the [0.01 - 0.1] Hz temporal bandpass range1.For the measurement of CSF pulsation, a modeling approach involving EPI MR signal simulation and CSF pulsation modeling was employed, as demonstrated in the previous studies1,2. This approach utilized two CSF pulsation indices. One is two interleaved slice pairs encompassing the cerebral aqueduct for CSF pulse measurement2 (CSFpulse) and the other is CSF edge measurements based on the CSF inflow index from edge slices1 (CSFedge).
The ROI for CSF within the cerebral aqueduct and the global BOLD was measured using gray matter referenced and mapped according to the Atlas of the Fischer 344 Rat Brain4. Subsequently, the temporal correlation of global BOLD with CSFpulse, CSFedge signal from the first slice, and global BOLD for each of the nine rats was computed and averaged for analysis.
Results
Firstly, we simulated the signal intensity reaching a steady state in GE-EPI images after a specific number of radiofrequency (RF) pulses and the signal intensity variation following pulsation. In the GE-EPI images, it required 13 RF pulses to reach a steady state. Additionally, the ratio between the steady state cerebrospinal fluid (CSF) signal and the CSF signal after pulsation was determined to be 0.425.Secondly, during the resting state, we examined the temporal Pearson correlation between CSF pulsation and the global BOLD. Both CSFpulse and CSFedge demonstrated correlation with the global BOLD, with the CSFedge displaying a higher correlation coefficient compared to the CSFpulse. The correlation peaks were observed at -1s for the global BOLD and CSFedge, while the global BOLD and CSFpulse exhibited high values at time lags of -10s and +11s.
Discussion and Conclusion
In this study, using GE-EPI images from an open database, we measured CSF pulsation in small animals such as rats through the CSF pulsation models. Our findings demonstrated a higher correlation coefficient between global BOLD and CSFedge compared to CSFpulse, consistent with prior human studies1,2 in terms of general tendency. Notably, the peaks of the global BOLD and CSFpulse coefficients were observed at -10s and 11s, presenting substantially longer time lags than the -2.2s and 2.2s time lags reported in human studies1,2. Conversely, the peak of the global BOLD and CSFedge coefficient was positioned at -1s, indicating a shorter time lag. The CSF edge-BOLD correlation peak at -1s, though notably shorter than in humans, still follows the global BOLD peak. This difference in time lag is attributed to factors such as the higher heart rate in rodents5. Moreover, despite a 10s time lag between CSF pulse and global BOLD, the 95% confidence interval indicates varied CSF physiology between human and small animals' cardiac beat rates.Furthermore, for increased confidence in the CSFpulse and correlation coefficient, future work contemplates measuring CSF pulsation and global BOLD in various other databases. This study holds promise for advancing the simultaneous comparison of brain functional activity and CSF pulsation in animal models, leveraging open databases.
Acknowledgements
No acknowledgement found.References
1. Han F, Chen J, Belkin-Rosen A, Gu Y, Luo L, Buxton OM, Liu X; Alzheimer’s Disease Neuroimaging Initiative. Reduced coupling between cerebrospinal fluid flow and global brain activity is linked to Alzheimer disease-related pathology. PLoS Biol. 2021 Jun 1;19(6):e3001233.
2. Jun-Hee Kim, Jae-Geun Im, and Sung-Hong Park. "Measurement of CSF pulsation from EPI-based human fMRI." NeuroImage 257 (2022): 119293
3. Liu Y, Perez PD, Ma Z, Ma Z, Dopfel D, Cramer S, Tu W, Zhang N. An open database of resting-state fMRI in awake rats. Neuroimage. 2020 Oct 15;220:117094.
4. Dana Goerzen, Caitlin Fowler, Gabriel A. Devenyi, Jurgen Germann, Dan Madularu, M. Mallar Chakravarty, Jamie Near. An MRI-Derived Neuroanatomical Atlas of the Fischer 344 Rat Brain for Automated Anatomical Segmentation. bioRxiv 743583.
5. Milani-Nejad N, Janssen PM. Small and large animal models in cardiac contraction research: advantages and disadvantages. Pharmacol Ther. 2014 Mar;141(3):235-49.
Figures
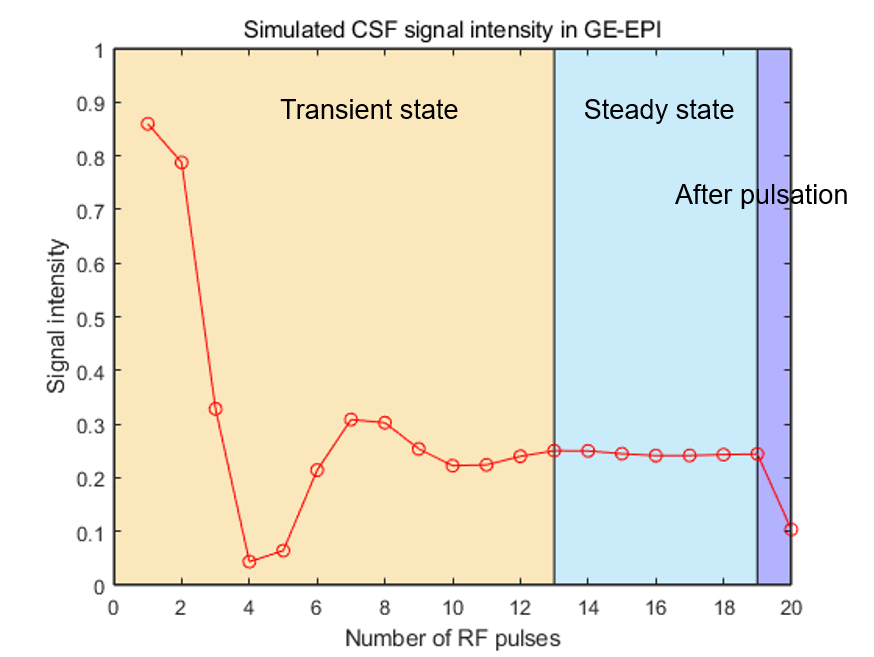
Figure 1. CSF signal intensity simulation in GE-EPI image.
The change in CSF signal intensity in GE-EPI images based on the number of RF pulses. The CSF signal intensity after the final RF pulse represents the signal intensity following pulsation.
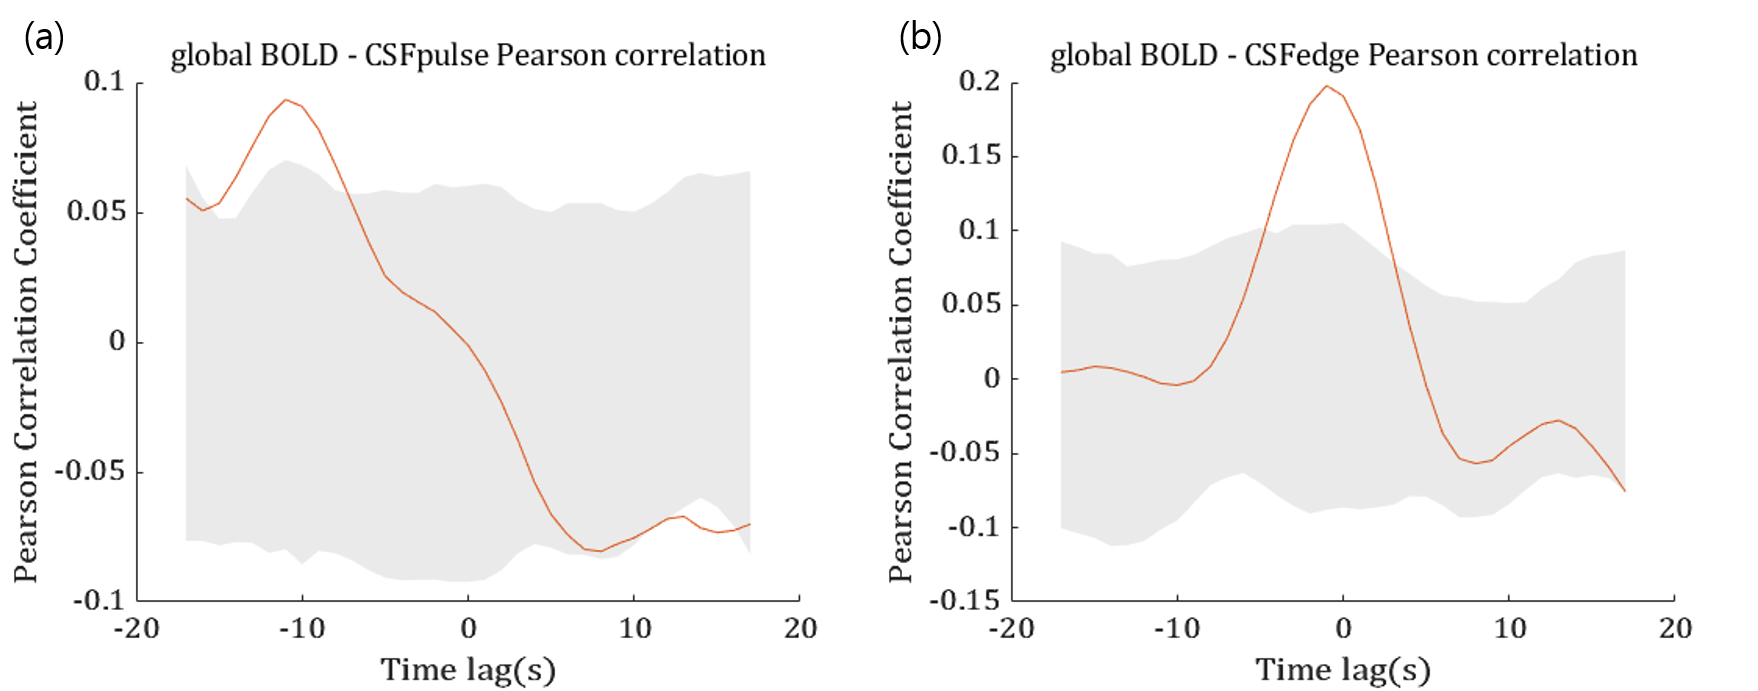
Figure 2. Temporal Pearson correlation between global BOLD and CSF signal.
Computed the temporal Pearson correlation coefficient between global BOLD and CSF pulse across a time lag range of -17s to 17s at 1-second intervals. The shaded area represents the 95% confidence interval obtained from 1000 shuffling data points. (a) Temporal Pearson correlation graph between global BOLD and CSFedge. (b) Temporal Pearson correlation graph between global BOLD and CSFpulse.
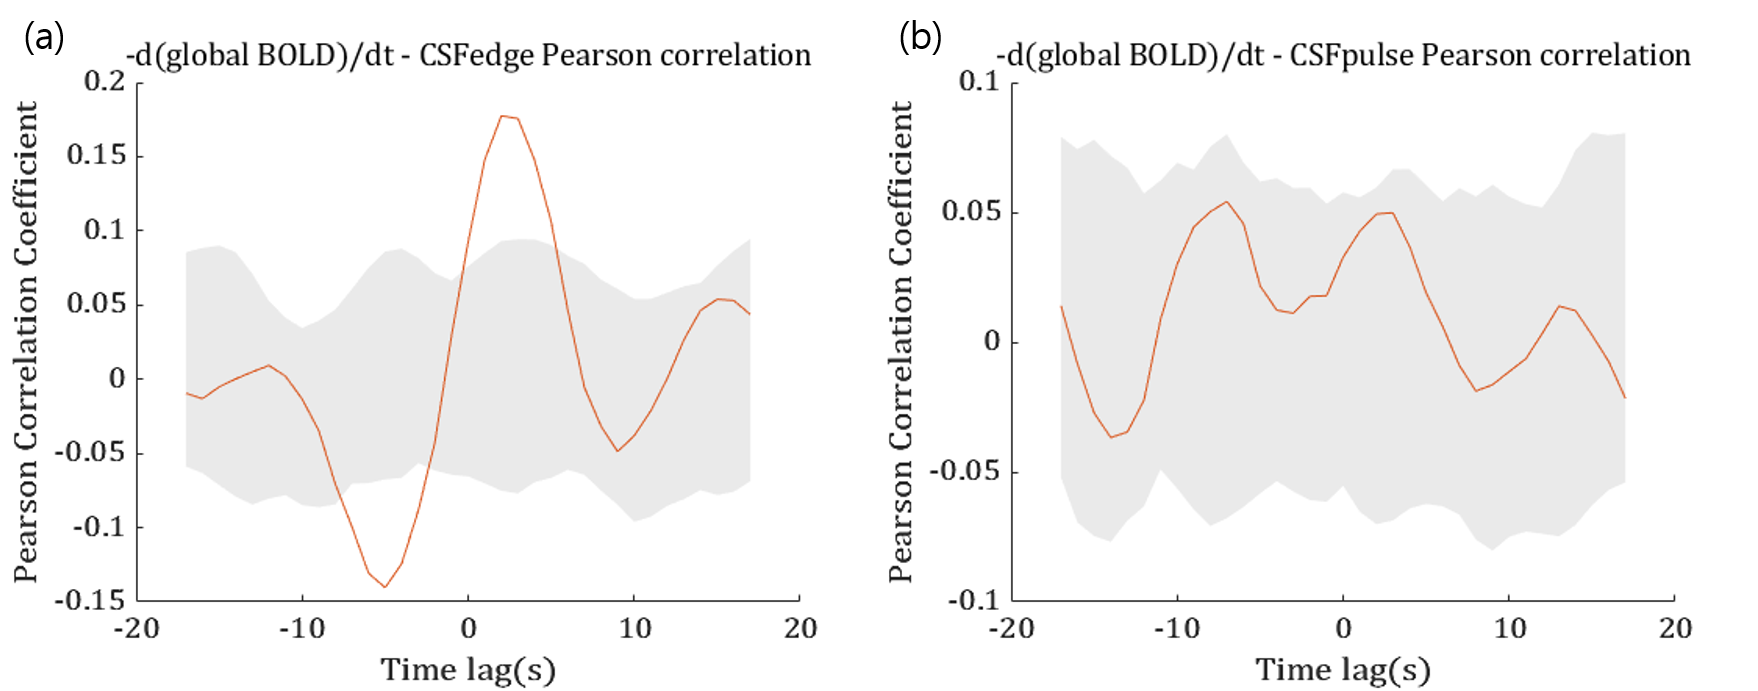
Figure 3. Temporal Pearson correlation between negative time derivative of global BOLD and CSF signal.
Computed the temporal Pearson correlation coefficient between negative time derivative of global BOLD and CSF pulse across a time lag range of -17s to 17s at 1-second intervals. The shaded area represents the 95% confidence interval obtained from 1000 shuffling data points. (a) Temporal Pearson correlation graph between negative time derivative of global BOLD and CSFedge. (b) Temporal Pearson correlation graph between negative time derivative of global BOLD and CSFpulse.
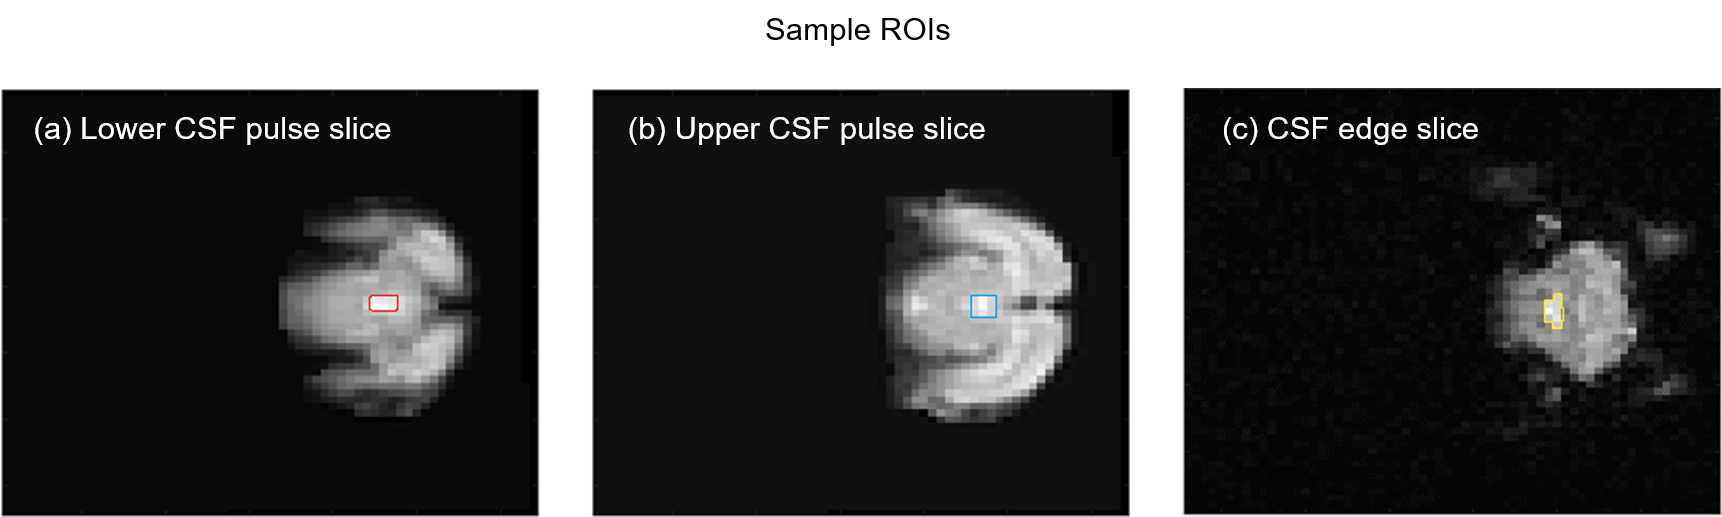
Figure 4. Sample ROIs used in the ROI analysis.
The CSF ROIs were manually drawn. (a) Lower CSF pulse slice (Red) (b) Upper CSF pulse slice (Green) (c) CSF edge slice (Yellow)