4902
Blood brain barrier permeability characterization in the NOD-EAE mouse model of secondary progressive multiple sclerosis using MRI1University of Massachusetts Chan Medical School, Worcester, MA, United States, 2Sanofi, Cambridge, MA, United States
Synopsis
Keywords: Biology, Models, Methods, Multiple Sclerosis, blood brain barrier permeability
Motivation: Blood brain barrier (BBB) dysregulation is one of the earliest signs of multiple sclerosis (MS) and the mechanism underlying BBB breakdown is not completely understood.
Goal(s): We sought to use the non-obese diabetic experimental allergic encephalomyelitis (NOD-EAE) mouse model of secondary progressive MS to understand BBB breakdown in efforts to explore potential MS therapeutics.
Approach: MRI was used to quantify BBB permeability metrics using gadolinium contrast agent.
Results: We quantified the spatial and temporal characterization of BBB permeability in NOD-EAE mice with progressing disease using MRI. These quantifying parameters can potentially be used to test the effect of therapeutic agents on BBB breakdown.
Impact: The NOD-EAE mouse model of secondary progressive multiple sclerosis (SPMS) can potentially be used to assess blood brain barrier characteristics using contrast-enhanced MRI in efforts to test therapeutic agents that can be used in the treatment of SPMS.
Introduction
Multiple sclerosis (MS) is a central nervous system disorder characterized by inflammation and pathologic changes in the brain. Blood brain barrier (BBB) dysregulation and transendothelial migration of activated leukocytes are among the earliest cerebrovascular abnormalities seen in MS in addition to the release of inflammatory cytokines1. The mechanisms behind BBB breakdown in MS are not fully understood. MRI is a non-invasive imaging tool for diagnosing and characterizing MS pathology, capable of measuring BBB permeability. Gadolinium (Gd), an intravascular contrast agent, selectively enters and extravasates in the brain tissue where the BBB is compromised, visible through T1-weighted MRI. This study used a semi-automated analysis process on MRI images to characterize the spatial and temporal profile of BBB permeability in the non-obese diabetic experimental allergic encephalomyelitis (NOD-EAE) mouse model of secondary progressive MS (SPMS). The NOD-EAE model, in combination with MRI, provides a valuable tool for quantifying BBB breakdown in disease, testing potential therapies, and validating therapeutic benefits for clinical translation. Understanding these processes in MS is crucial for developing effective treatments for the condition.Methods
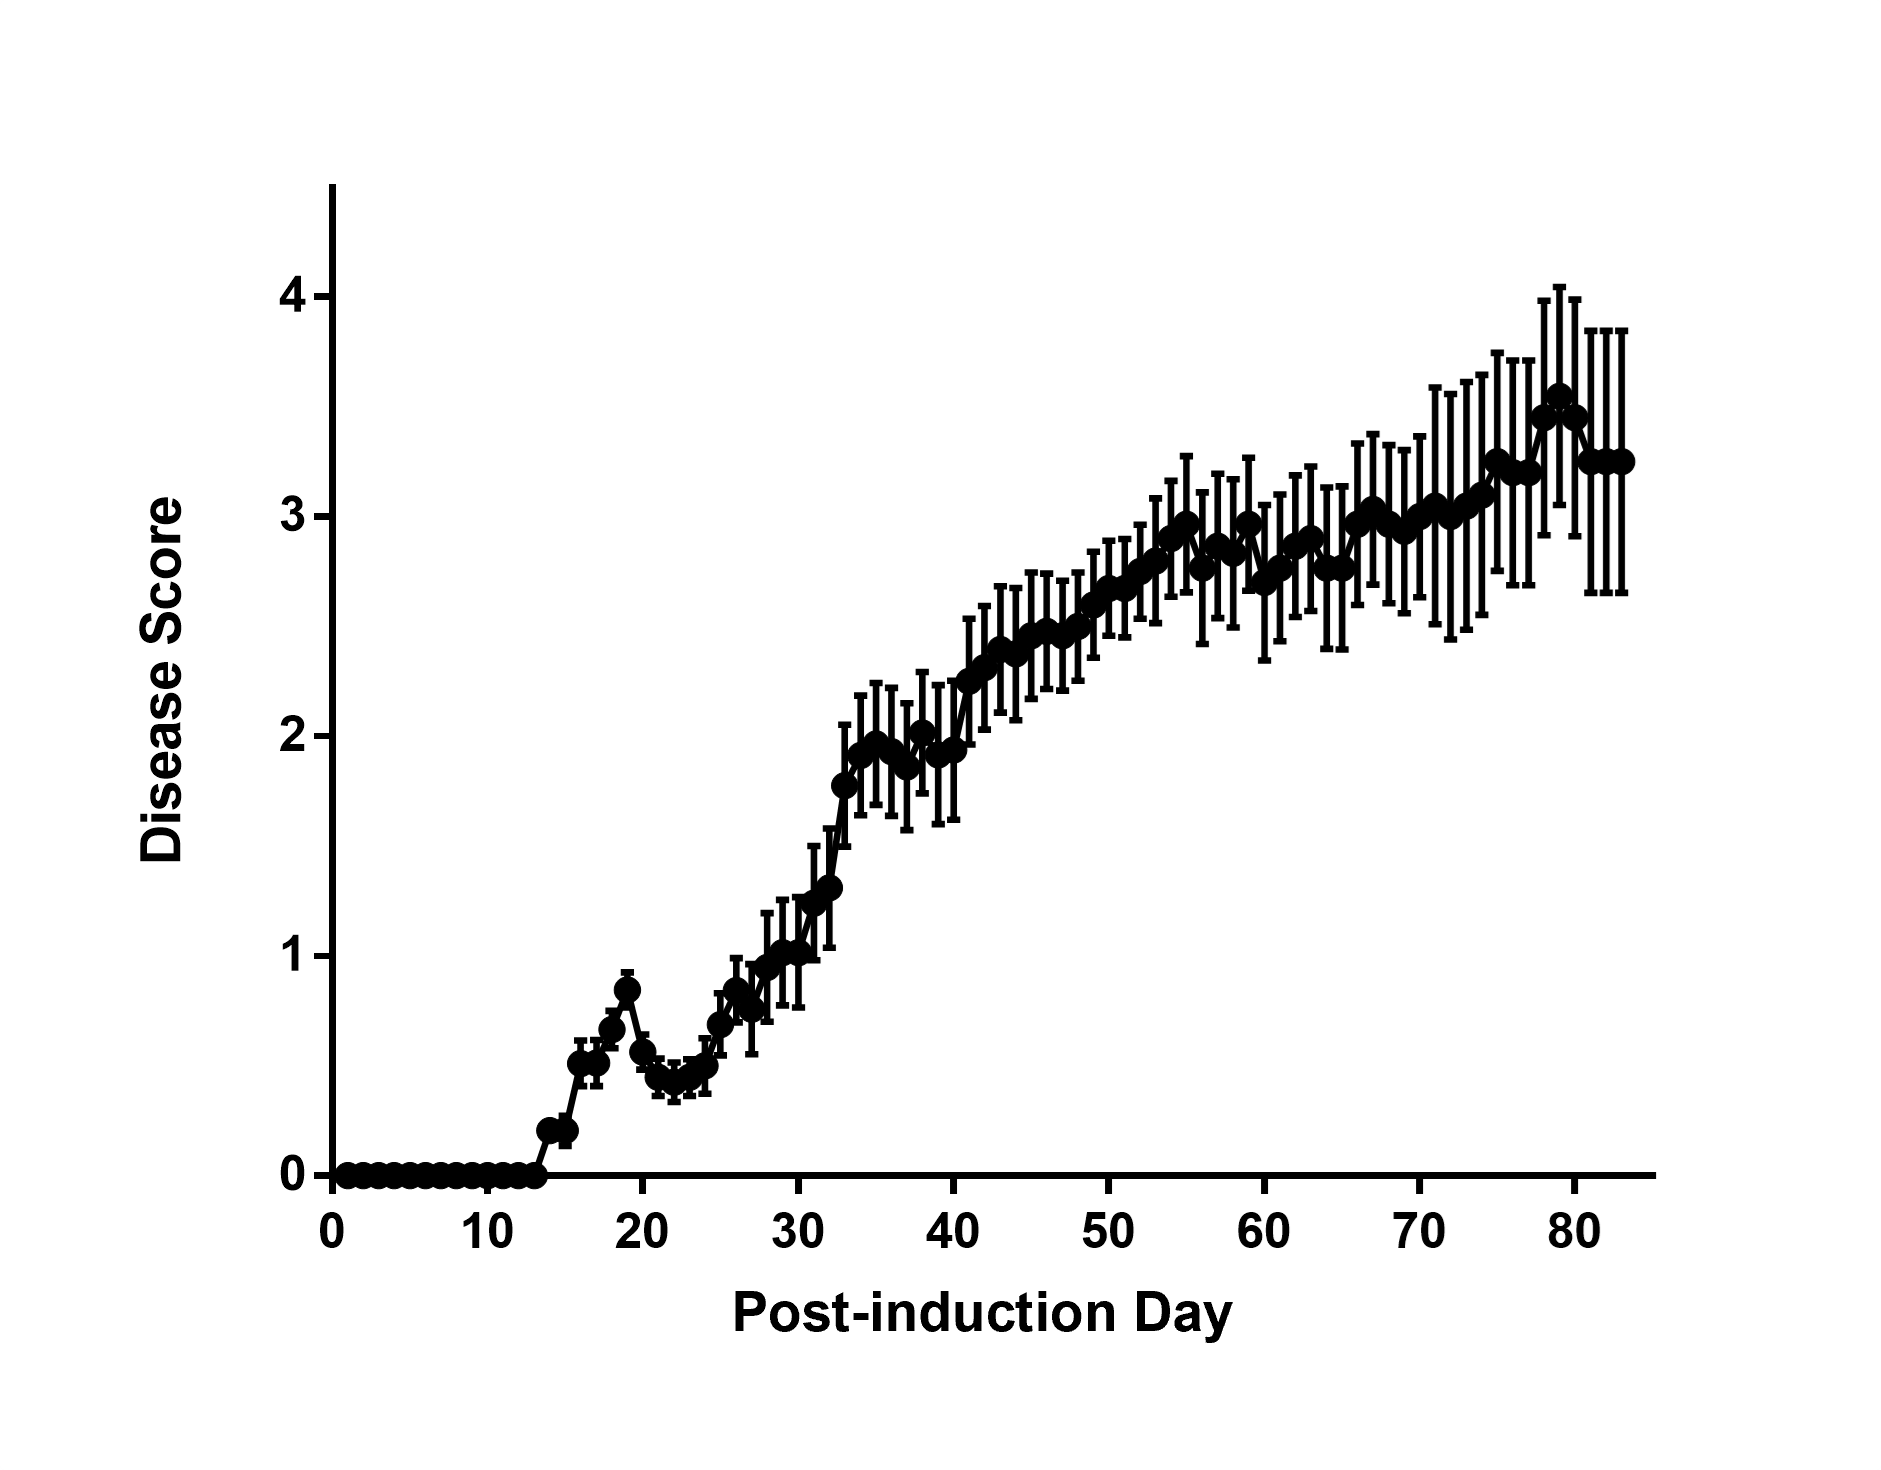
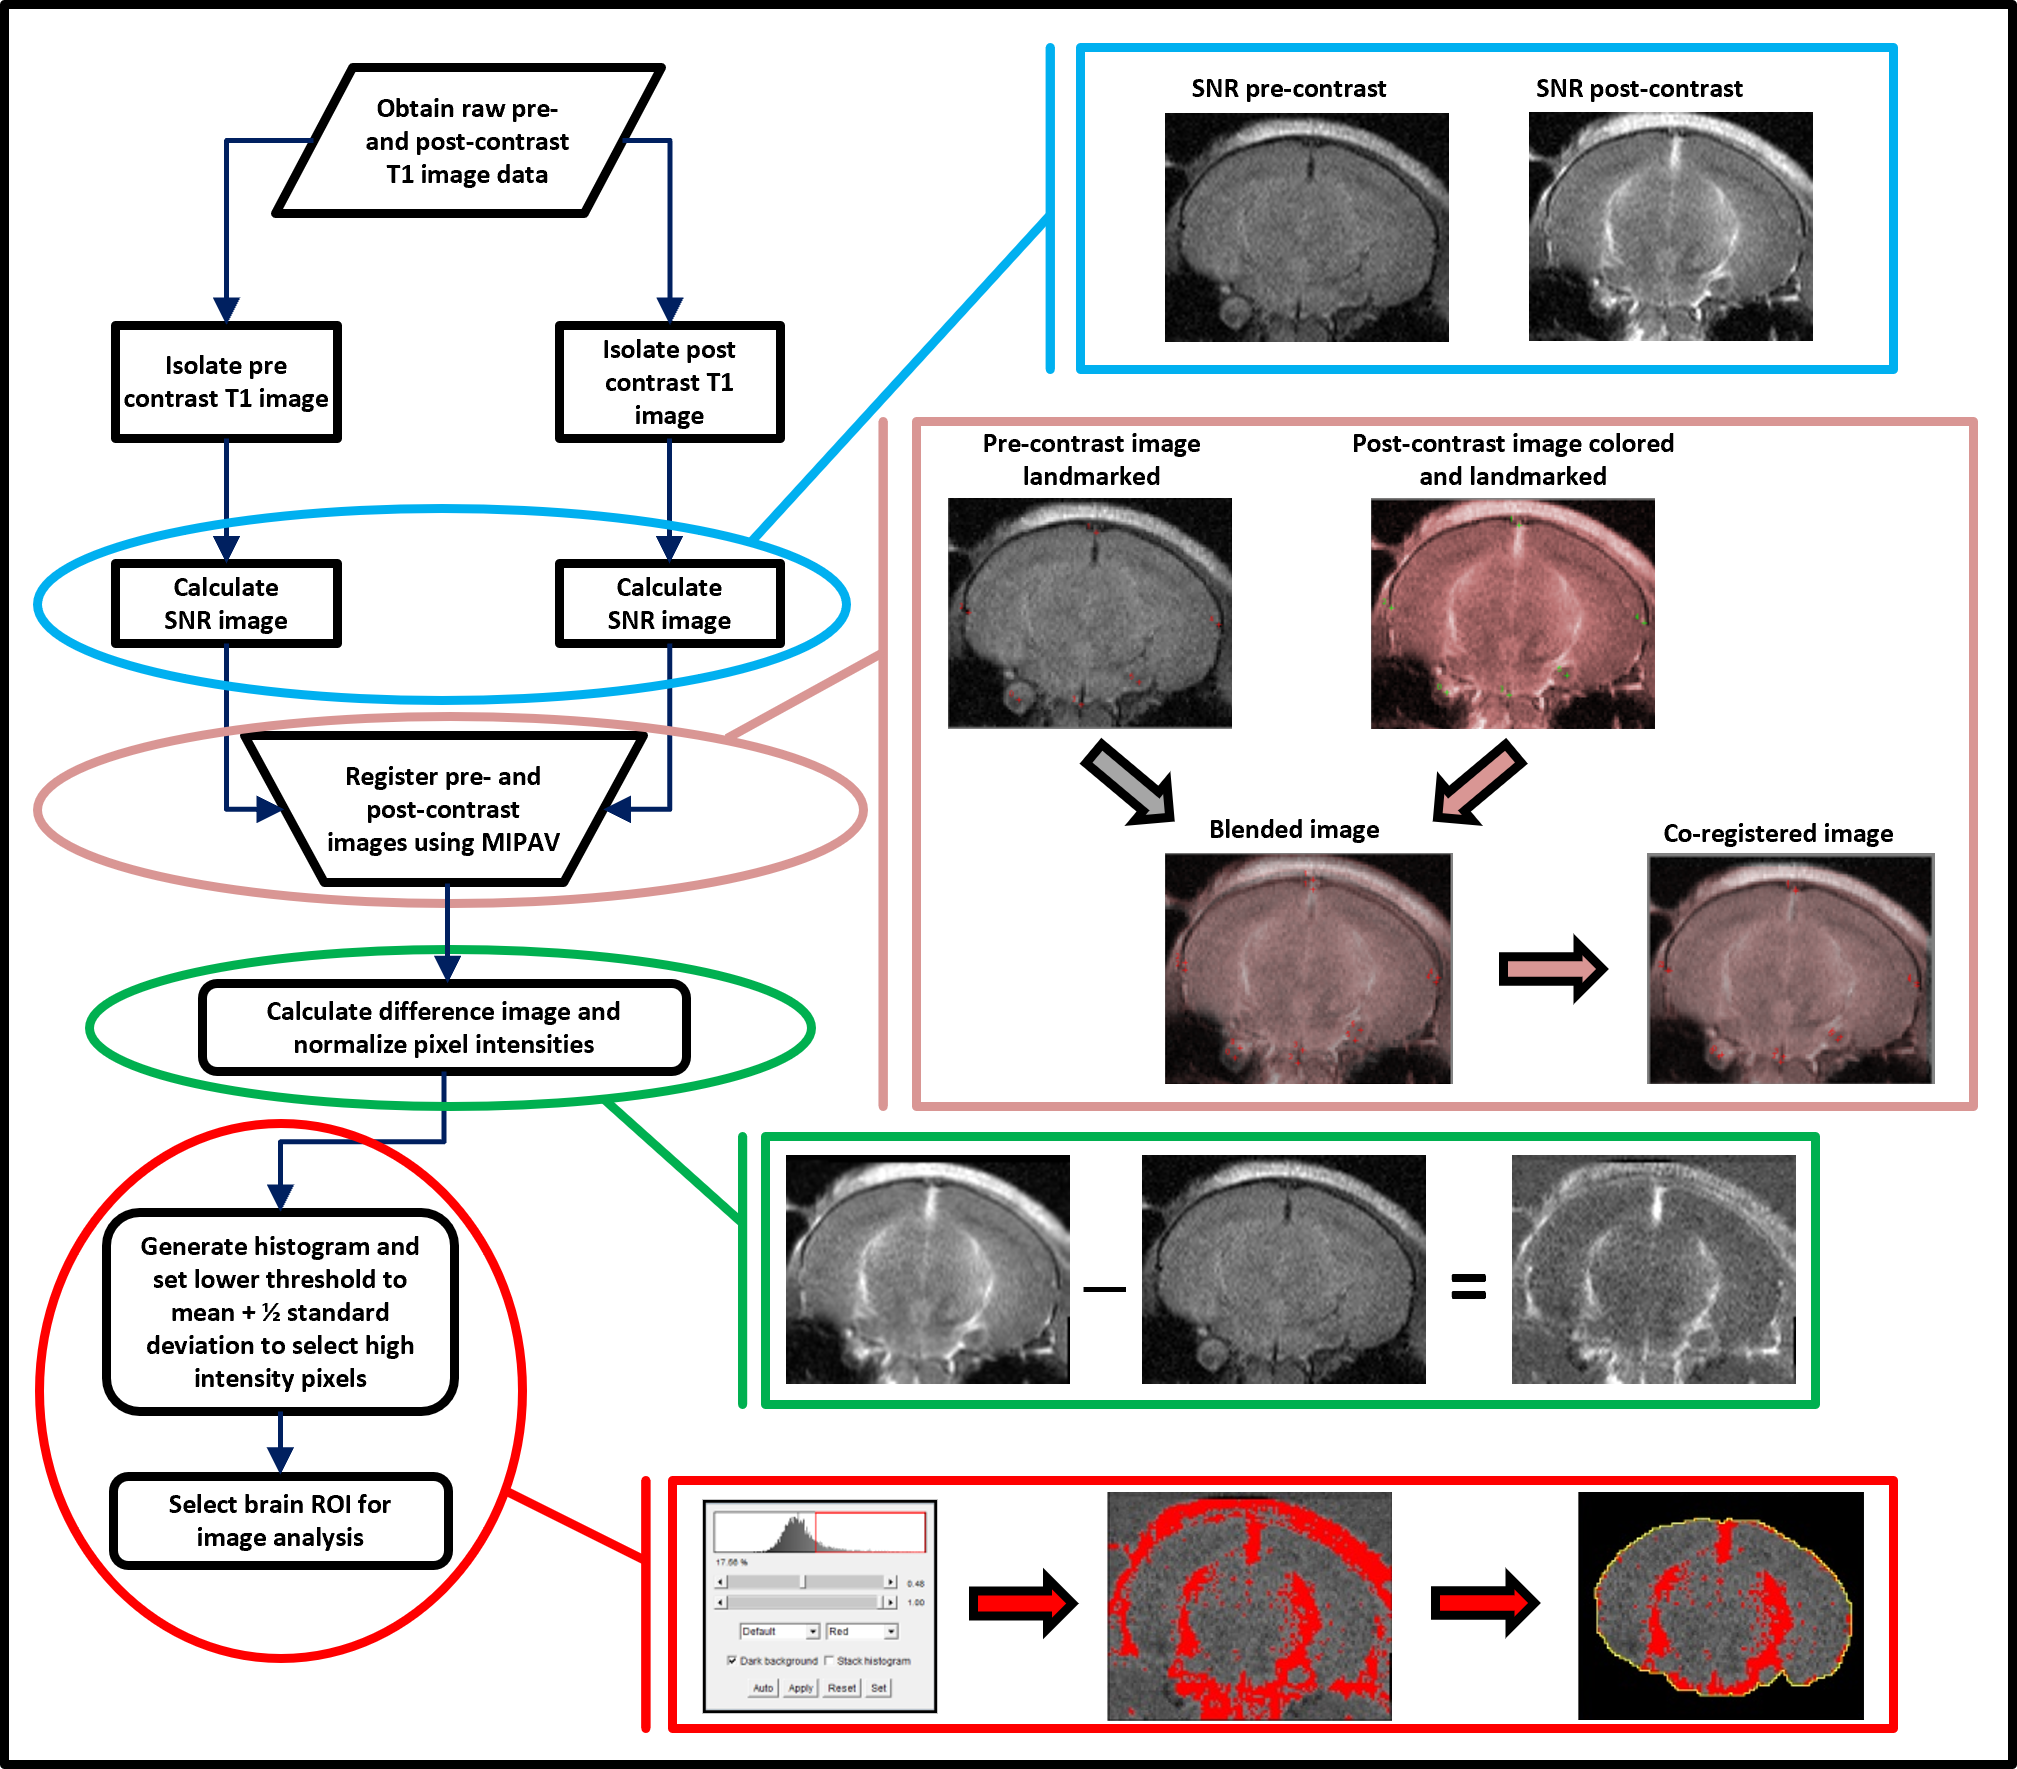
Ten-week-old female NOD/ShlTJ mice were induced with EAE with an emulsion containing MOG35-55 peptide (150µg/mouse) in complete Freund's adjuvant containing 0.6 mg Mycobacterium tuberculosis administered via subcutaneous injection. Additionally, bordetella pertussis toxin was injected intraperitoneally (IP) on both Day 0 and Day 2 at a dose of 150 ng/animal in 200 µL of PBS. After EAE induction, the mice were observed and assessed daily for paralytic symptoms (Fig. 1). MRI was performed using a 7T-Bruker scanner using either a 50-mm volume coil or a 35-mm surface coil at three different time points: 35 days (n=4), 50 days (n=5), and 80 days (n=3) post-induction. Naïve NOD mice (n=4) served as the control group. T1-weighted (T1W) images were acquired before and up to 1 hour after IP injection of Gd contrast agent (0.5 mmol/kg) using the RARE sequence (TR/TE=800/8.5 ms, 10 coronal slices, 0.75 mm thickness, matrix size=256×256, FOV=25 mm). Dextran tracer was also injected via cardiac injection to evaluate BBB functionality through histology. Data analysis focused on the one-hour post-Gd injection period to compare contrast uptake in the brain across all time points due to the longer retention of contrast, particularly in the later stages of the disease. To quantify contrast uptake, pre- and post-contrast brain images were registered, subtracted, and thresholded for analysis based on histogram analysis using MIPAV and ImageJ software (Fig. 2). A difference image was generated and normalized to reflect the signal-to-noise ratio (SNR) changes to account for the different coils used. The selected threshold was used to count high intensity pixels and record cumulative intensity of the pixels both across the different timepoints and the spatial distribution of the brain slices.Results and Discussion
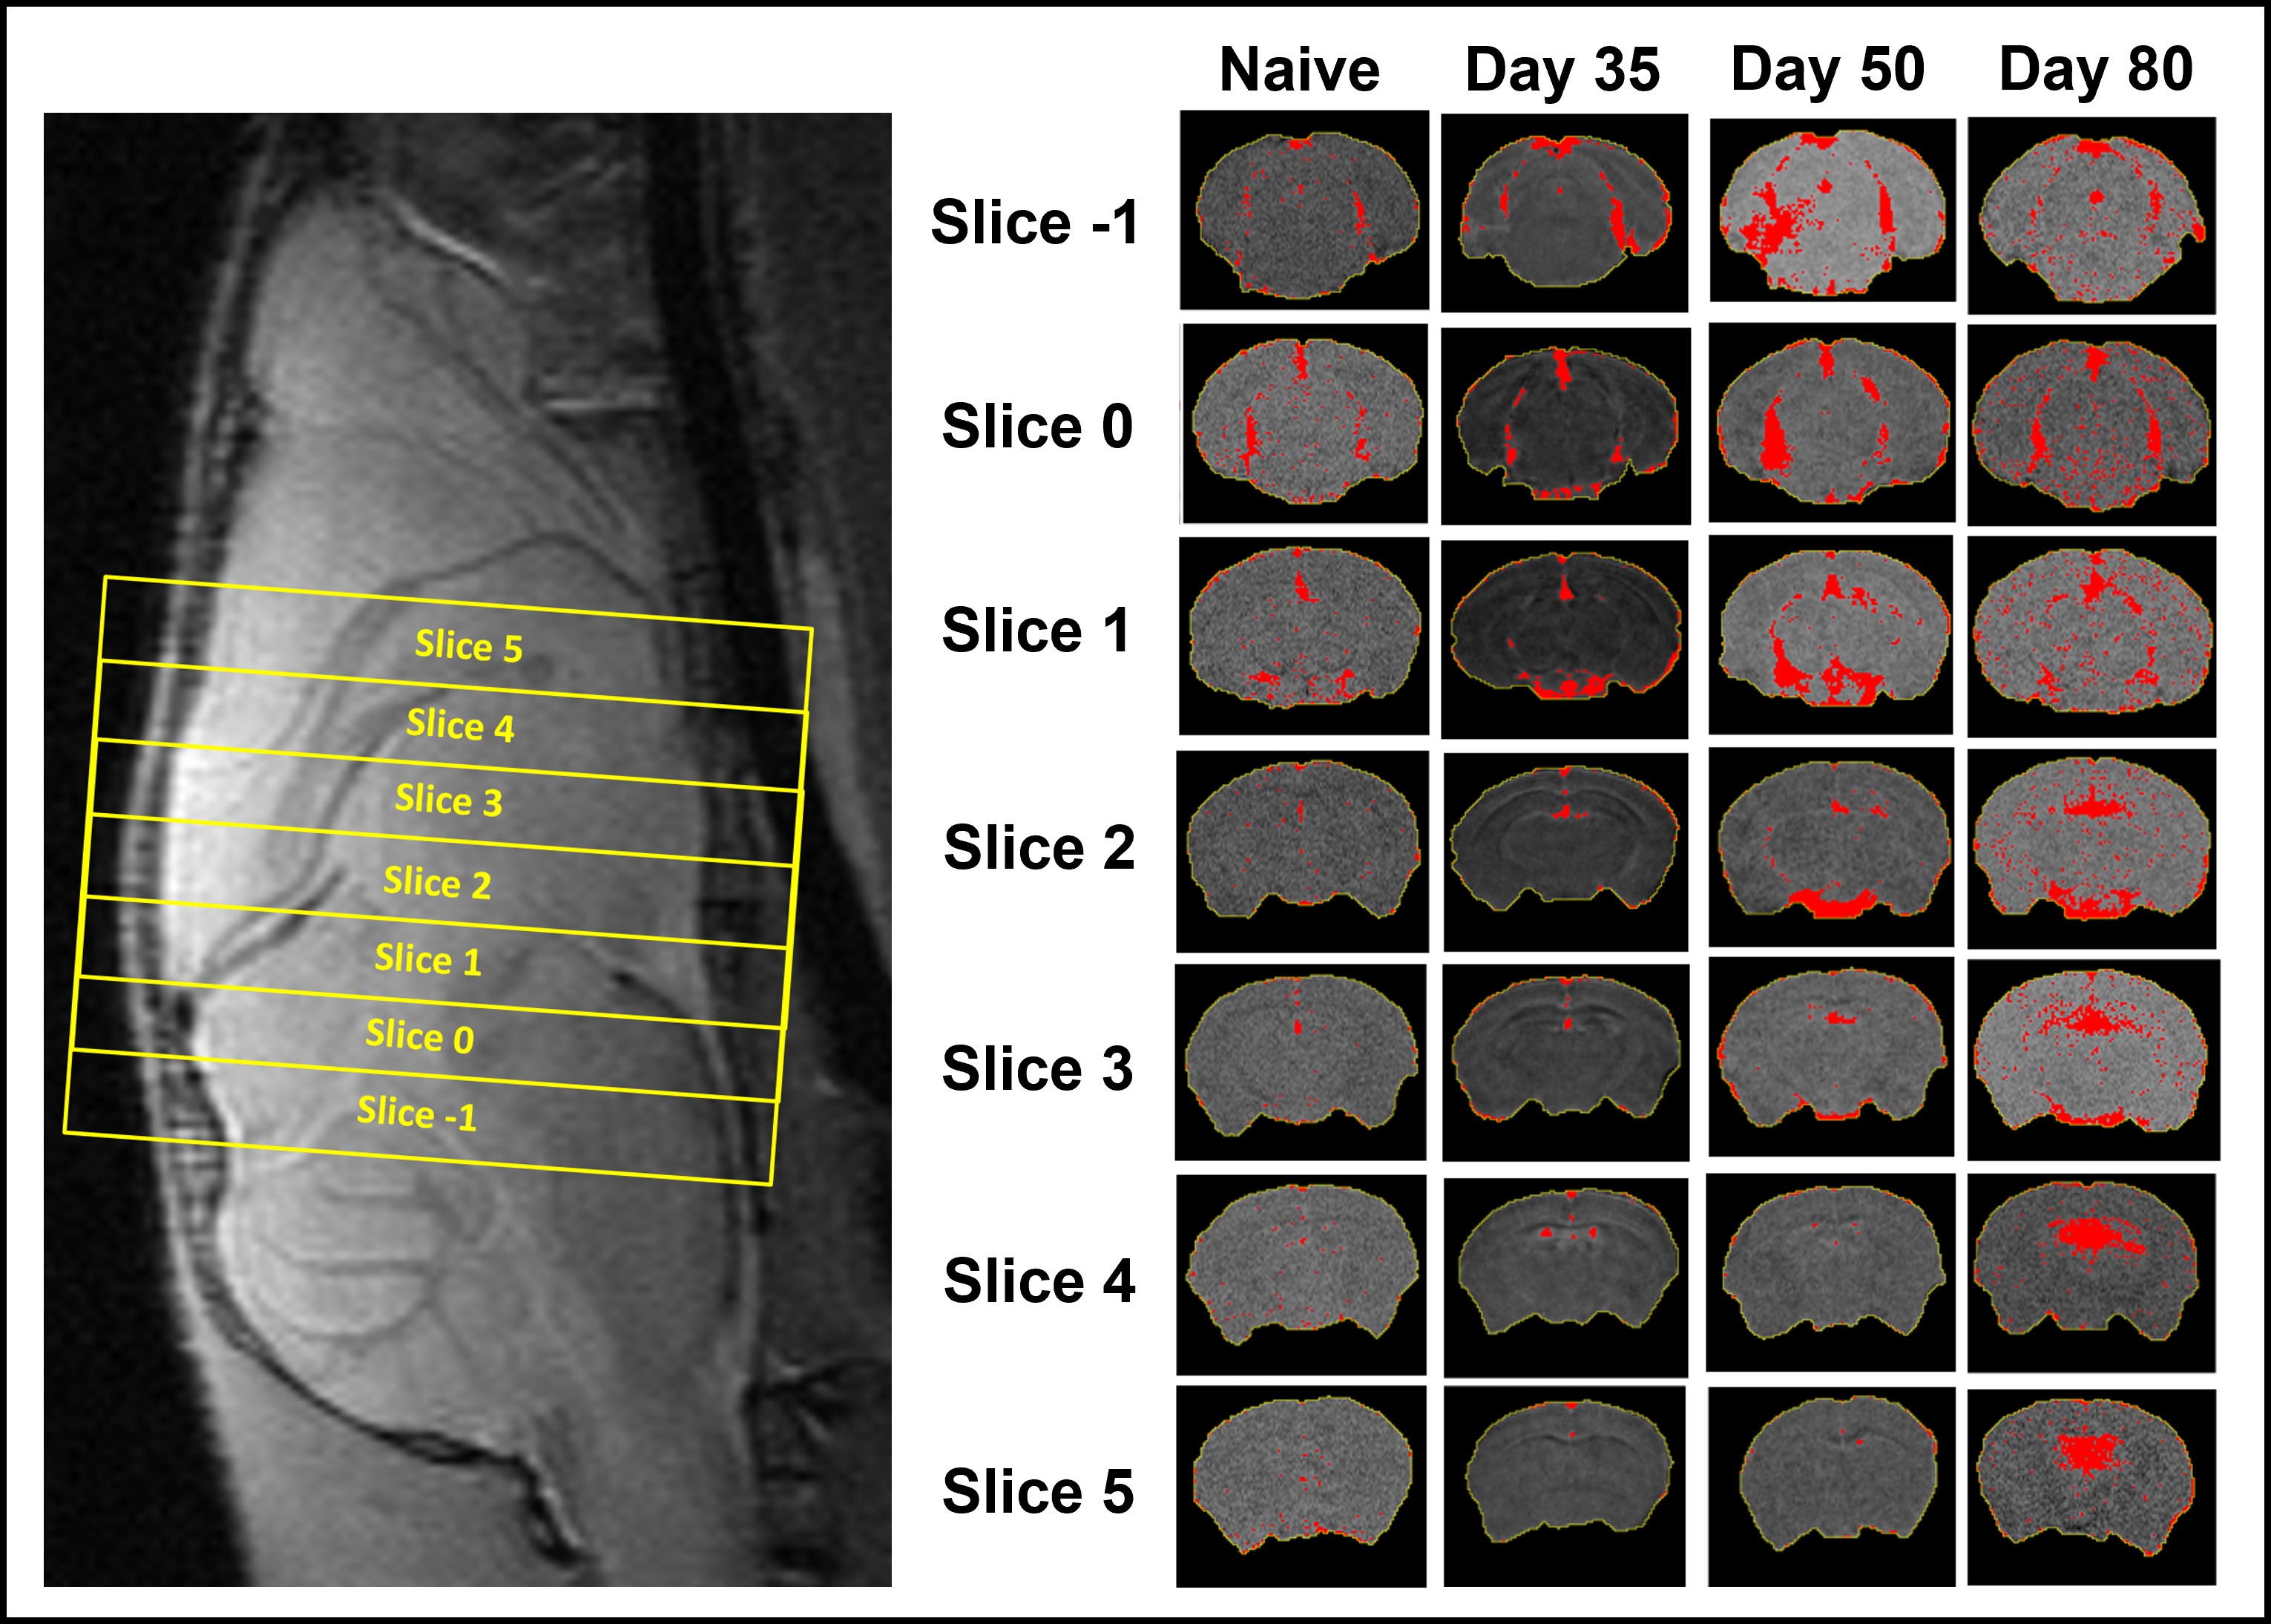
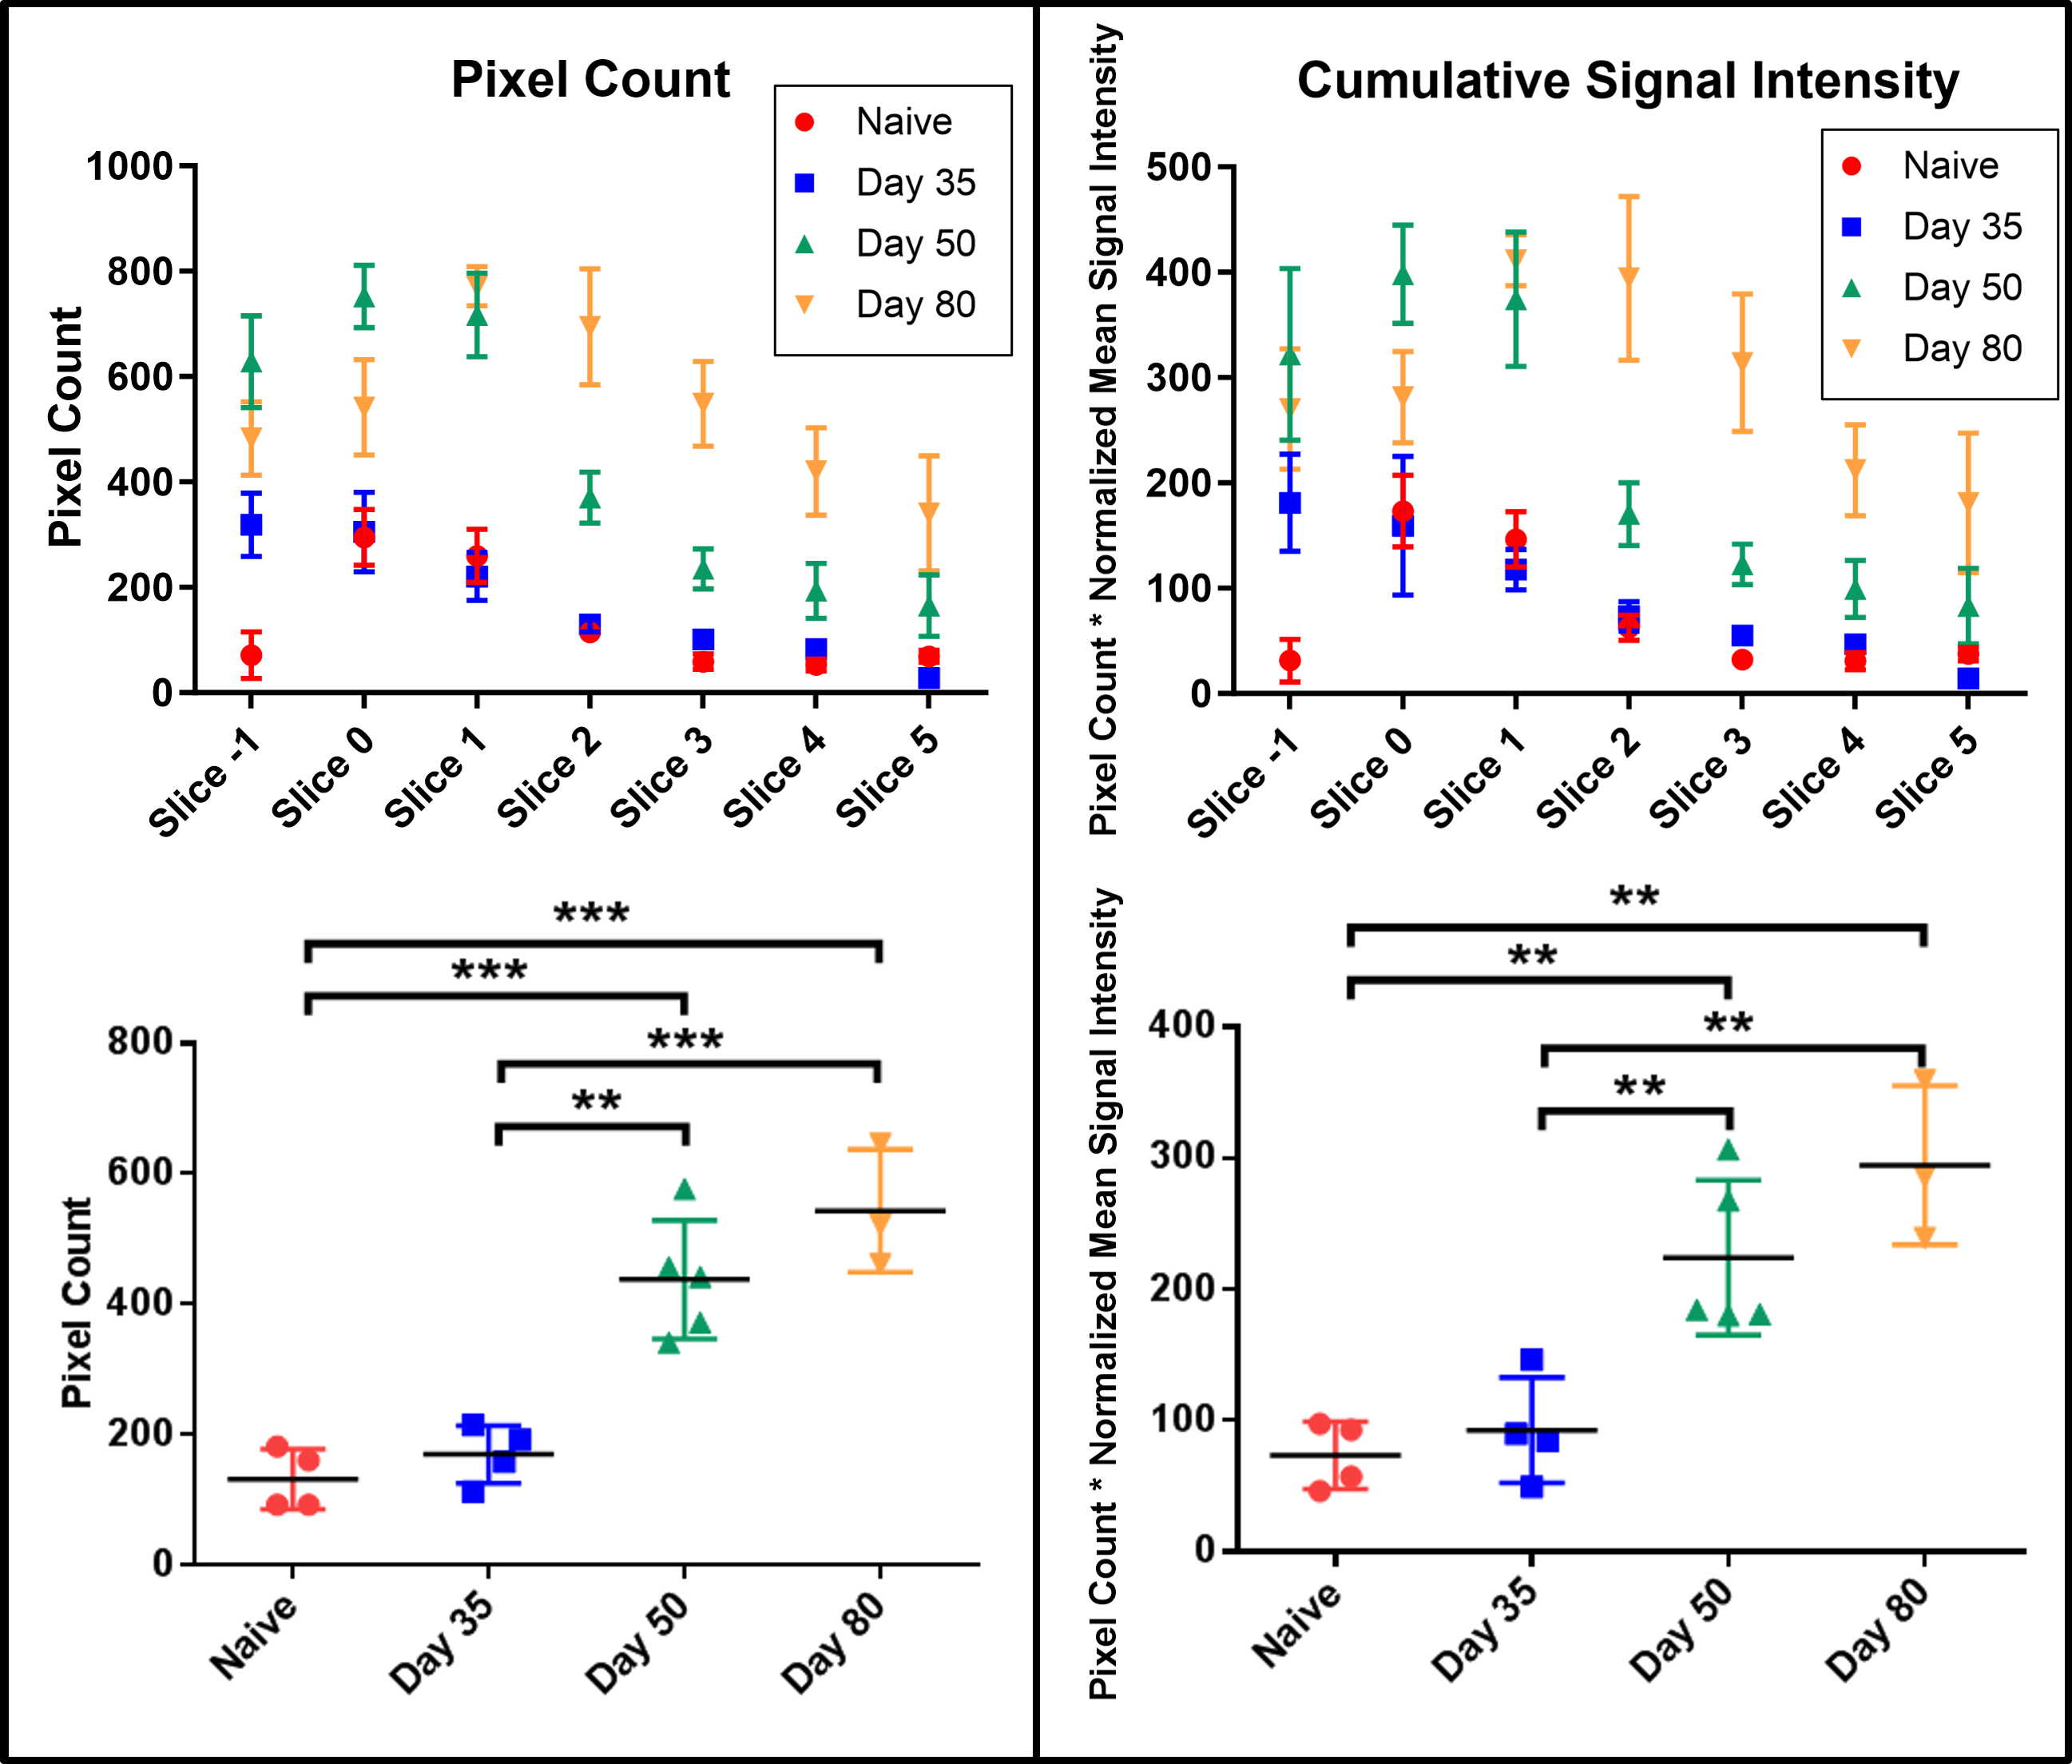
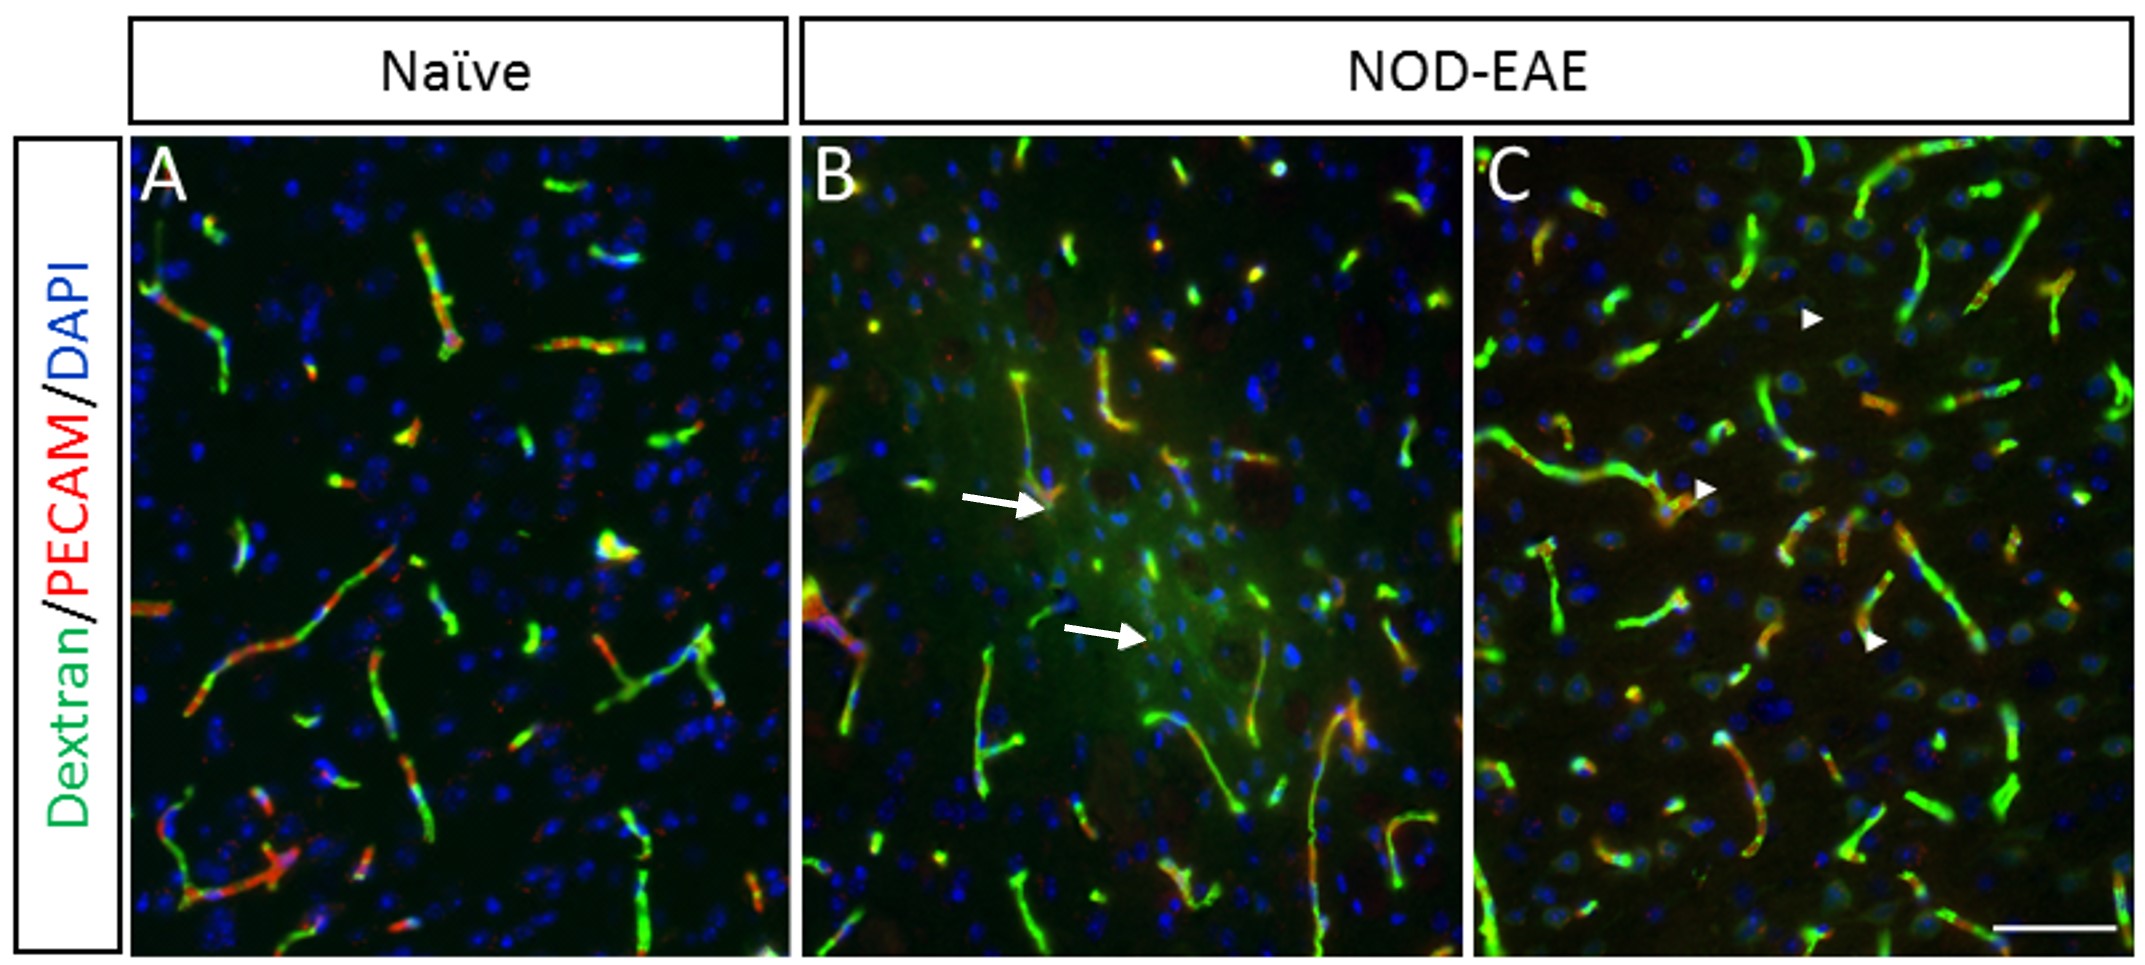
The mean disease scores in the NOD-EAE model of SPMS (Fig. 1) aligned with the expected clinical progression. Following disease induction, NOD-EAE mice exhibited varying levels of Gd uptake into the brain parenchyma at different time points, indicating compromised BBB integrity (Fig. 3). Previous studies have focused on characterizing brain lesions in the NOD-EAE model at specific late disease time-points2-4; however, BBB permeability across disease progression is largely unexplored. We assessed the extent of Gd uptake into the brain parenchyma, spanning from the corpus callosum to the cerebellum. Two-way ANOVA showed a significant effect of slice location, time-point after disease induction, and their interaction on the pixel counts (p<0.0001) and cumulative signal intensity (p<0.01) illustrating a spatial and temporal effect of BBB compromise (Fig. 4). One-way ANOVA revealed a significant effect in the pixel counts (p<0.01) and the cumulative signal intensity (p<0.01) at 1 hour after Gd injection between the later time-points (Days 50 and 80) of post-disease induction and Day 35 post-disease induction and the naïve group (Fig. 4). This demonstrates greater Gd extravasation into the brain parenchyma indicating an increase in the extent of BBB breakdown with time suggesting an increase in either paracellular or transcellular transport. Following MRI, dextran tracer was readily visualized using immunohistochemistry (Fig. 5), demonstrating clear tracer extravasation into the brain parenchyma in NOD-EAE mice, confirming the compromised BBB.Conclusion
The NOD-EAE mouse model showed an increase in extravasation volume of Gd contrast agent across the BBB with progressing disease after EAE induction which correlates with the clinical score pattern. The extent of Gd uptake across the brain regions and time-point after EAE induction clearly demonstrates a difference in the transport mechanism across the BBB. The quantifications presented herein can be used to potentially test the effect of therapeutic agents on BBB breakdown in SPMS.Acknowledgements
No acknowledgement found.References
1. Minagar and Alexander (2003). Blood-brain barrier disruption in multiple sclerosis. Multiple Sclerosis 9: 540-549
2. Levy et al. (2010). Characterization of brain lesions in a mouse model of progressive multiple sclerosis. Experimental Neurology 226: 148-158.
3. Barazany et al. (2014). Brain MRI of nasal MOG therapeutic effect in relapsing-progressive EAE. Experimental Neurology 255: 63-70
4. Hamilton et al. (2019). Central nervous system targeted autoimmunity causes regional atrophy: a 9.4T MRI study of the EAE mouse model of Multiple Sclerosis. Scientific Reports 9: 8488.
Figures