4892
Macromolecular fraction and magnetization exchange rate acquired with UTE-MRI differ in the tibial bone of diabetic rats: a feasibility study1University of California San Diego, San Diego, CA, United States, 2Radiology, University of California San Diego, San Diego, CA, United States, San Diego, CA, United States, 3Radiology service, VA San Diego Healthcare System, San Diego, CA, United States, 4Pathology, University of California San Diego, San Diego, CA, United States, 5VA San Diego Healthcare System, San Diego, CA, United States
Synopsis
Keywords: High-Field MRI, Bone, Diabetes bone, UTE-MRI, MMF, Exchange rate
Motivation: Increased risk of fractures in patients with type-2 diabetes mellitus (T2DM) despite higher average bone mineral density is unexplained with routine diagnostic tools like DEXA and CT.
Goal(s): This study aimed to examine the feasibility of using ultrashort echo time (UTE) magnetization transfer (MT) modeling to detect the potential differences between T2DM and normal rats.
Approach: The macromolecular fraction (MMF) and proton exchange rate (kab) from UTE-MT modeling on the tibial bone of Zucker diabetic fatty (ZDF) and Zucker lean (ZL) rats were compared.
Results: There was a significant difference in MMF and kab measures between the two groups.
Impact: The MMF and kab measures can detect potential bone alternations related to T2DM which may help to better understand the pathogenesis of T2DM bone fractures.
Background
Type 2 diabetes (T2DM) patients who have long-term or poorly controlled diabetes are at greater risk of fractures despite the normal-to-high areal bone mineral density (aBMD) along with delayed bone fracture healing and poorer outcomes after treatment1–4. Most reported studies focused on the mineral compartment of the bone using X-ray-based techniques5,6. The T2DM impact on the organic matrix of bone has not been investigated using non-invasive imaging techniques. Conventional MRI pulse sequences cannot capture signals from cortical bone, which has a short T2 relaxation time, necessitating the use of ultrashort echo time (UTE) sequences 7. UTE-MRI can provide a radiation-free assessment of the organic matrix of bone 8,9. Specifically, magnetization transfer (MT) modeling combined with UTE can measure macromolecular fraction (MMF) and proton exchange rate (kab)) between water and the organic matrix of bone. We conducted an ex vivo study on the tibial bone of rats to investigate the feasibility of UTE-MT in detecting bone abnormalities related to T2DM.Method
The experimental procedures were approved by the Ethics Committee, and all animal study protocols were approved by the Institutional Animal Care and Use Committee of the University of California San Diego.Twenty male rats including 10 ZDF rats (mean weight: 459.40±28.17g) and 10 age-matched Zucker lean (ZL) rats (mean weight: 348.60±14.09g) as controls were studied. The animals were maintained under standard animal laboratory conditions until they were sacrificed at 26 weeks, and the left or right legs were dissected and collected randomly. The trabecular bone from both distal and proximal sides of the tibia was cut, and the bone marrow was removed. The dissected cortical bone specimens with the 3.5 cm length were soaked in phosphate-buffered saline (PBS) for 24 hours before the MR scan. Each sample was put in perfluoropolyether (Fomblin, Ausimont, USA) to minimize dehydration and susceptibility-induced artifacts during MRI scans. All UTE-MRI scans were performed on a 3T Bruker scanner (BioSpec, Maxwell, Germany) using a 1 cm surface coil. The following 3D UTE-MT parameter was used: saturation power=500°, 1000°, 1500°; frequency offset=2, 5, 10, 20, and 50kHz; FA=10°; 13 spokes per MT preparation; TR/TE= 86/0.026ms; bandwidth=100kHz; number of averages=1, FOV=10×10×80mm, acquisition matrix=84×84×84; total scan time=36 min.
Regions of interest (ROIs) cover the entire cortical bone. For each slice, average signal values within the ROI were used for MMF and kab measurements.
Two-pool MT modeling was performed to generate MMF values and exchange rates of different proton pools 10–12. The UTE‐MT analysis was performed in MATLAB (MathWorks, Natick, USA).
The two-sample independent T-test was performed between average MMF and kab measures in two groups after confirming the normality of the data via the Kolmogorov-Smirnov test. Statistical analyses were performed in SPSS. P values below 0.05 were considered significant.
Results
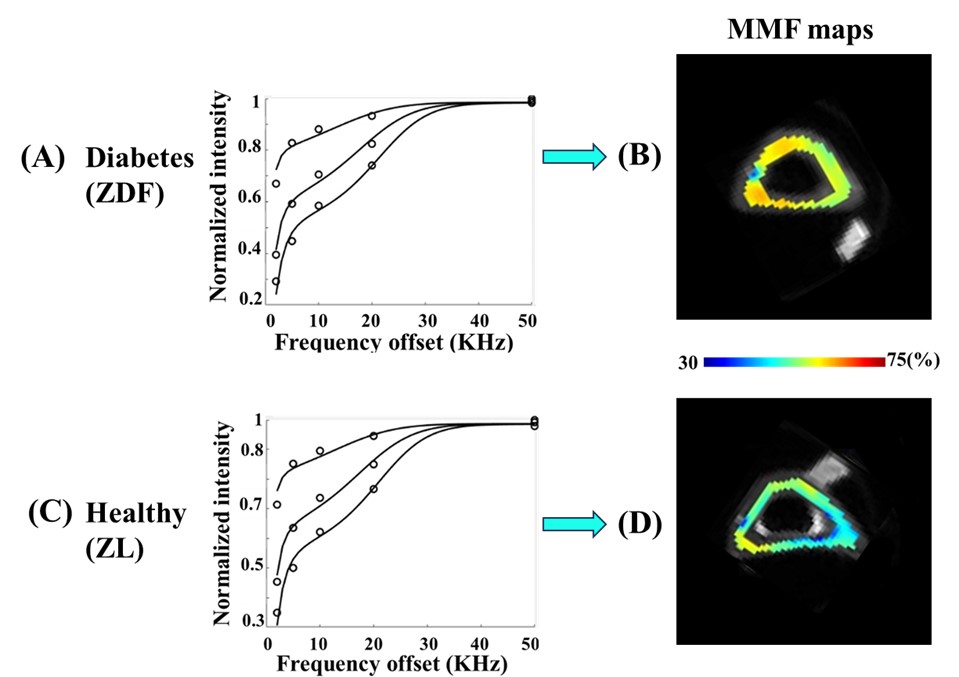
Figure 1 represents the fitting curve of MMF, and its pixel maps overlaid onto the UTE images in (A &B) a tibial bone of a diabetes ZDF rat and (C &D) a healthy ZL rat. A higher mean value of MMF was observed for the ZDF rat (B) compared to the ZL (A) in cortical bone (58.65±23.32% vs. 49.22±11.58%).Table 1 summarizes the mean and standard deviation (SD) of the MMF and kab measures from each group of specimens and their statistical significance (T-test).
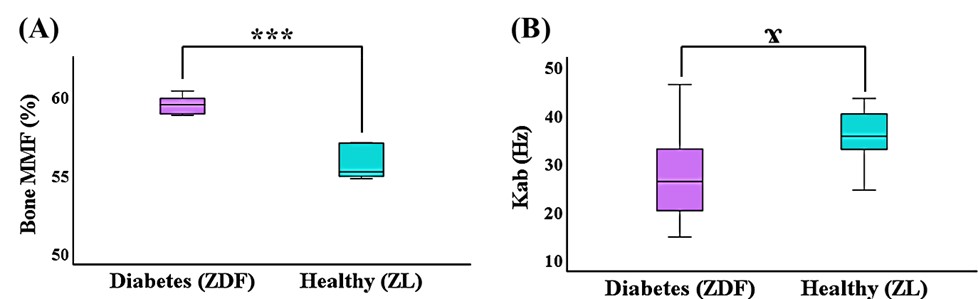
Figure 2 shows a box plot of the tibial cortical bone MMF (%) values comparing diabetes (ZDF) groups and healthy (ZL) (P < 0.001) and a box plot of the tibial cortical bone exchange rate from macromolecular proton to water proton derived from MT modeling (kab) comparing between ZDF groups and ZL (P = 0.1). The tibial cortical bone in ZDF groups showed significantly higher MMF values and a trend of lower kab values compared with the ZL group (59.29±1.07% vs. 55.33±1.67% for MMF, while 28.55±10.75 Hz vs. 35.46±6.35 Hz for Kab).
Higher MMF values in ZDF rats might be related to the higher weight of the ZDF group, as higher BMD in T2DM patients is often attributed to obesity 13. The lower exchange rate (kab) might be related to the changes in the collagen structure of cortical bone induced by glycation-associated crosslinking 14.
Conclusion
Conclusion: A significantly higher MMF and a trend of lower kab measures from UTE-MT modeling were found in diabetic cortical bone. The results show the potential of UTE-MT modeling in evaluating bone microenvironment alterations following diabetes. Further studies are required to demonstrate the causal link between lower water magnetization exchange rate and impaired bone architecture.Acknowledgements
The authors acknowledge grant support from the National Institutes of Health (R01AR062581, R01AR068987, R01AR075825, and R01AR079484), VA Clinical Science and Rehabilitation Research and Development Services (Merit Awards I01CX001388, I01CX002211, and I01BX005952), and GE Healthcare.References
1. Epidemiology of fractures in type 2 diabetes - PubMed. Accessed November 4, 2023. https://pubmed.ncbi.nlm.nih.gov/26027505/2. High bone mineral density and fracture risk in type 2 diabetes as skeletal complications of inadequate glucose control: the Rotterdam Study - PubMed. Accessed November 4, 2023. https://pubmed.ncbi.nlm.nih.gov/23315602/
3. Ma L, Oei L, Jiang L, et al. Association between bone mineral density and type 2 diabetes mellitus: a meta-analysis of observational studies. Eur J Epidemiol. 2012;27(5):319-332. doi:10.1007/s10654-012-9674-x
4. Patient-related risk factors for fracture-healing complications in the United Kingdom General Practice Research Database - PubMed. Accessed November 4, 2023. https://pubmed.ncbi.nlm.nih.gov/23140093/
5. Dhaliwal R, Cibula D, Ghosh C, Weinstock RS, Moses AM. Bone quality assessment in type 2 diabetes mellitus. Osteoporos Int. 2014;25(7):1969-1973. doi:10.1007/s00198-014-2704-7
6. High-resolution peripheral quantitative computed tomographic imaging of cortical and trabecular bone microarchitecture in patients with type 2 diabetes mellitus - PubMed. Accessed November 5, 2023. https://pubmed.ncbi.nlm.nih.gov/20719835/
7. Robson MD, Gatehouse PD, Bydder M, Bydder GM. Magnetic resonance: an introduction to ultrashort TE (UTE) imaging. J Comput Assist Tomogr. 2003;27(6):825-846. doi:10.1097/00004728-200311000-00001
8. Gokalp G, Mutlu FS, Yazici Z, Yildirim N. Evaluation of vertebral bone marrow fat content by chemical-shift MRI in osteoporosis. Skeletal Radiol. 2011;40(5):577-585. doi:10.1007/s00256-010-1048-4
9. Oei L, Koromani F, Rivadeneira F, Zillikens MC, Oei EHG. Quantitative imaging methods in osteoporosis. Quant Imaging Med Surg. 2016;6(6):680-698. doi:10.21037/qims.2016.12.13
10. Ultrashort echo time magnetization transfer (UTE‐MT) imaging and modeling: magic angle independent biomarkers of tissue properties - Ma - 2016 - NMR in Biomedicine - Wiley Online Library. Accessed November 4, 2023. https://analyticalsciencejournals.onlinelibrary.wiley.com/doi/abs/10.1002/nbm.3609
11. Ma YJ, Chang EY, Carl M, Du J. Quantitative Magnetization Transfer Ultrashort Echo Time Imaging Using a Time-Efficient 3D Multispoke Cones Sequence. Magn Reson Med. 2018;79(2):692-700. doi:10.1002/mrm.26716
12. Lattanzio PJ, Marshall KW, Damyanovich AZ, Peemoeller H. Macromolecule and water magnetization exchange modeling in articular cartilage. Magn Reson Med. 2000;44(6):840-851. doi:10.1002/1522-2594(200012)44:6<840::AID-MRM4>3.0.CO;2-K
13. Obesity, Type 2 Diabetes and Bone in Adults - PubMed. Accessed November 5, 2023. https://pubmed.ncbi.nlm.nih.gov/28280846/
14. Saito M, Marumo K. Collagen cross-links as a determinant of bone quality: a possible explanation for bone fragility in aging, osteoporosis, and diabetes mellitus. Osteoporos Int J Establ Result Coop Eur Found Osteoporos Natl Osteoporos Found USA. 2010;21(2):195-214. doi:10.1007/s00198-009-1066-z
Figures
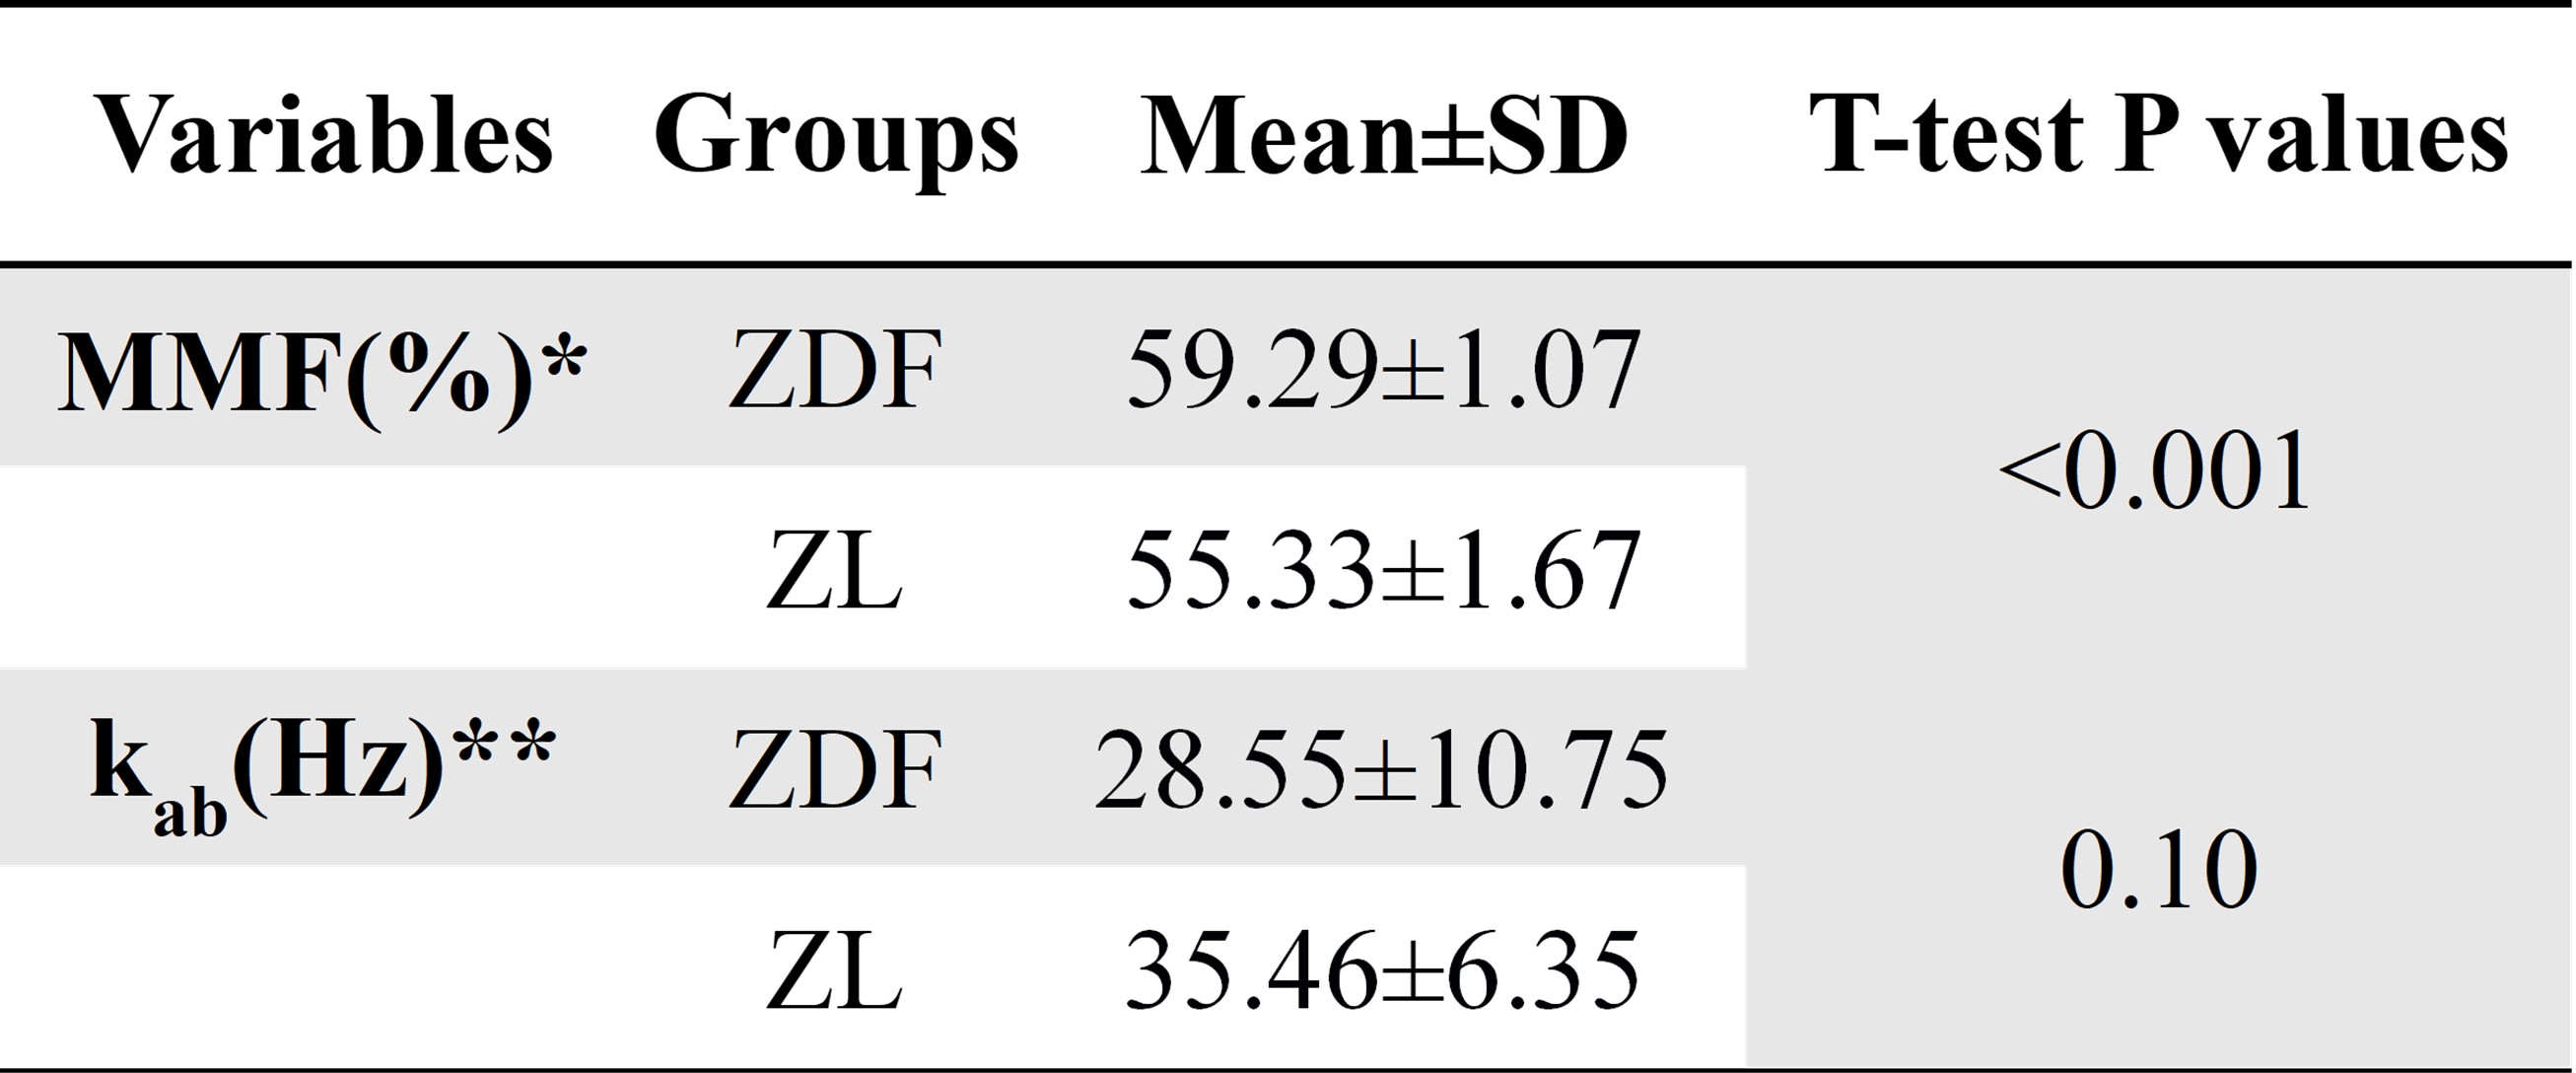
Table 1: The mean and standard deviation (SD) of MMF and kab measures for ZDF rats (n=10) and age-matched ZL rats (n=10) and their statistical significance (T-test).
*MMF: Macromolecular fraction
** kab: exchange rate from macromolecular proton to water proton