4888
Quantifying Spatial Variations of Cardiac-Induced Volumetric Strain Using DENSE MRI: Insight from an Observational Study1Center for Image Sciences, University Medical Center Utrecht, Utrecht, Netherlands, 2Department of Neurology, University Medical Center Utrecht, Utrecht, Netherlands
Synopsis
Keywords: Neurofluids, Brain, Volumetric strain; Brain tissue deformation
Motivation: The heartbeat causes deformations and volumetric strain in the surrounding brain tissue which can be observed using Displacement Encoding with Stimulated Echoes (DENSE) MRI. Local variations in volumetric strain reveal both expansion and compression in individual voxels or regions.
Goal(s): To offer insights into the heterogeneous patterns seen in volumetric strain maps.
Approach: Volumetric strain data of nine subjects was included and clustered (k-means) into four clusters.
Results: Both expanding and compressing clusters were found in all subjects. Compressing clusters were mostly found at the periphery of the brain and possibly reflect structures facilitating fluid movement (sulci and veins).
Impact: Clustering volumetric strain data into individual clusters with similar voxels reveals distinct volumetric strain profiles in DENSE data. Potentially, these clusters can be used to cleanup DENSE data from fluid-related artifacts to make the data specifically reflect brain tissue strains.
Introduction
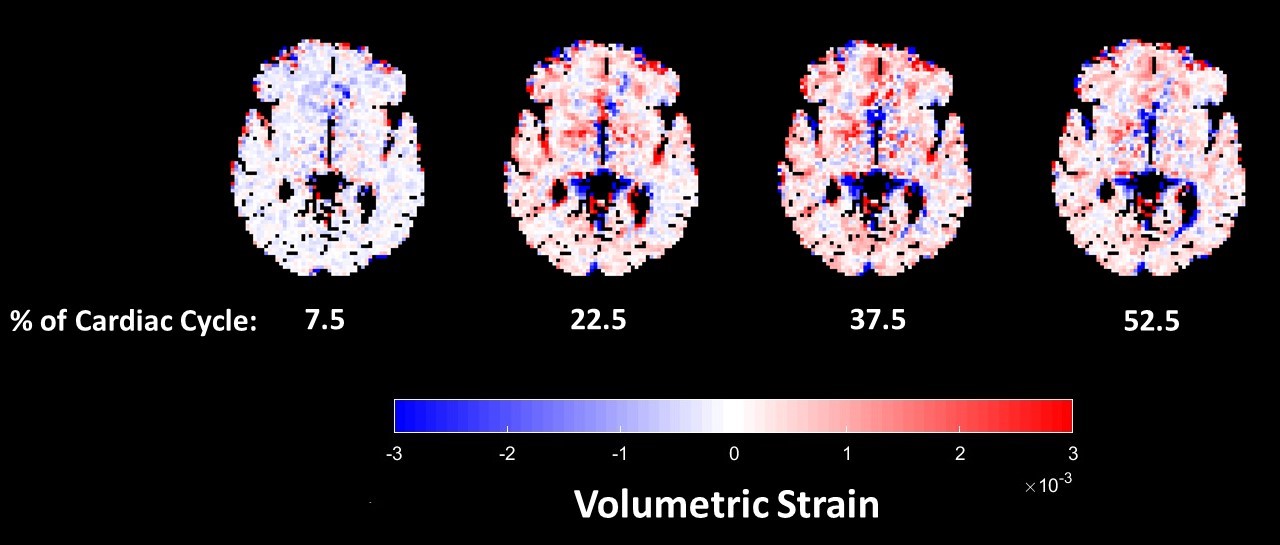
The cardiac cycle induces blood volume changes in the brain’s vasculature, which leads to deformations and volumetric strain in the surrounding tissues. These deformations can be assessed in vivo by using dedicated MRI acquisition methods such as Displacement Encoding with Stimulated Echoes (DENSE) [1,2]. Whole brain expansion of brain tissue during the systolic phase has previously been shown and validated using similar MRI methods. Locally, individual voxels and regions exhibit different behaviors, with some expanding and others apparently compressing during systole (Figure 1). We aimed to shed light on these variations using clustering of similar voxels.Methods
Data from nine healthy volunteers (6 males, aged 30±4) previously acquired with Single shot DENSE [3] was further analyzed. The volumetric strain maps contained 8 time points covering 52.5 percent of the cardiac cycle (Figure 1). A whole brain tissue mask was obtained from T1w images (1mm resolution, gray-/white matter probability>95%). Voxels within the mask formed individual signals containing 8 samples (the heart phases) each. The k-means clustering algorithm provided by MATLAB [MATLAB2018a] was used to cluster these signals into individual groups based on their similarity. The optimal number of clusters was determined by repeating the clustering while varying the number of clusters between 1 and 30. The sum of squared distances (squared Euclidian distance) over all clusters was determined for each run and plotted against the number of clusters. The optimal number of clusters was defined as the intersection point of tangent lines on the lower and higher part of the plot, leading to an optimum of four clusters. To obtain a robust clustering solution when determining the four clusters for each subject, clustering was repeated 30 times using random initial cluster centroid points. The clustering solution with the lowest total sum of squared distances was used for further analysis. The obtained clusters were ranked from highest mean volumetric strain (indicated as Cluster 1) to the lowest (Cluster 4). To assess the behavior of volumetric strain in the deeper brain areas, which contain few large blood vessels or possible partial volume effects with CSF and sulci, a conservative (probability>95%) white matter mask was applied after clustering.Results
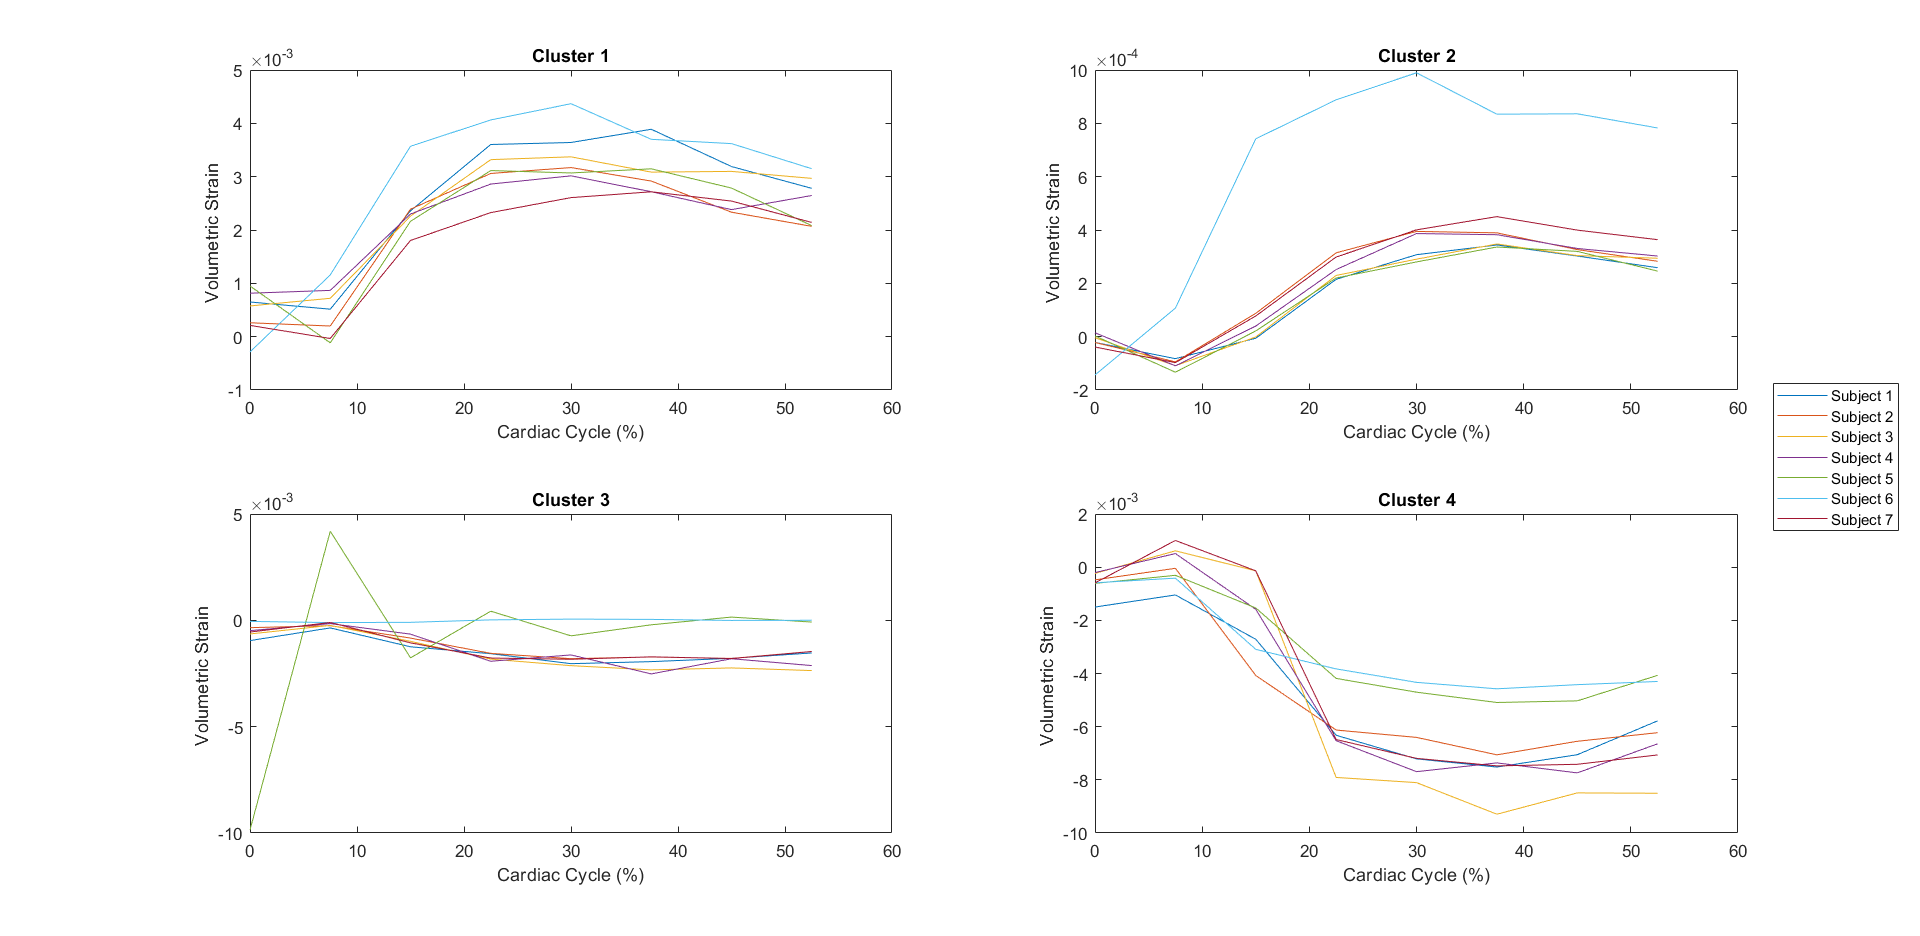
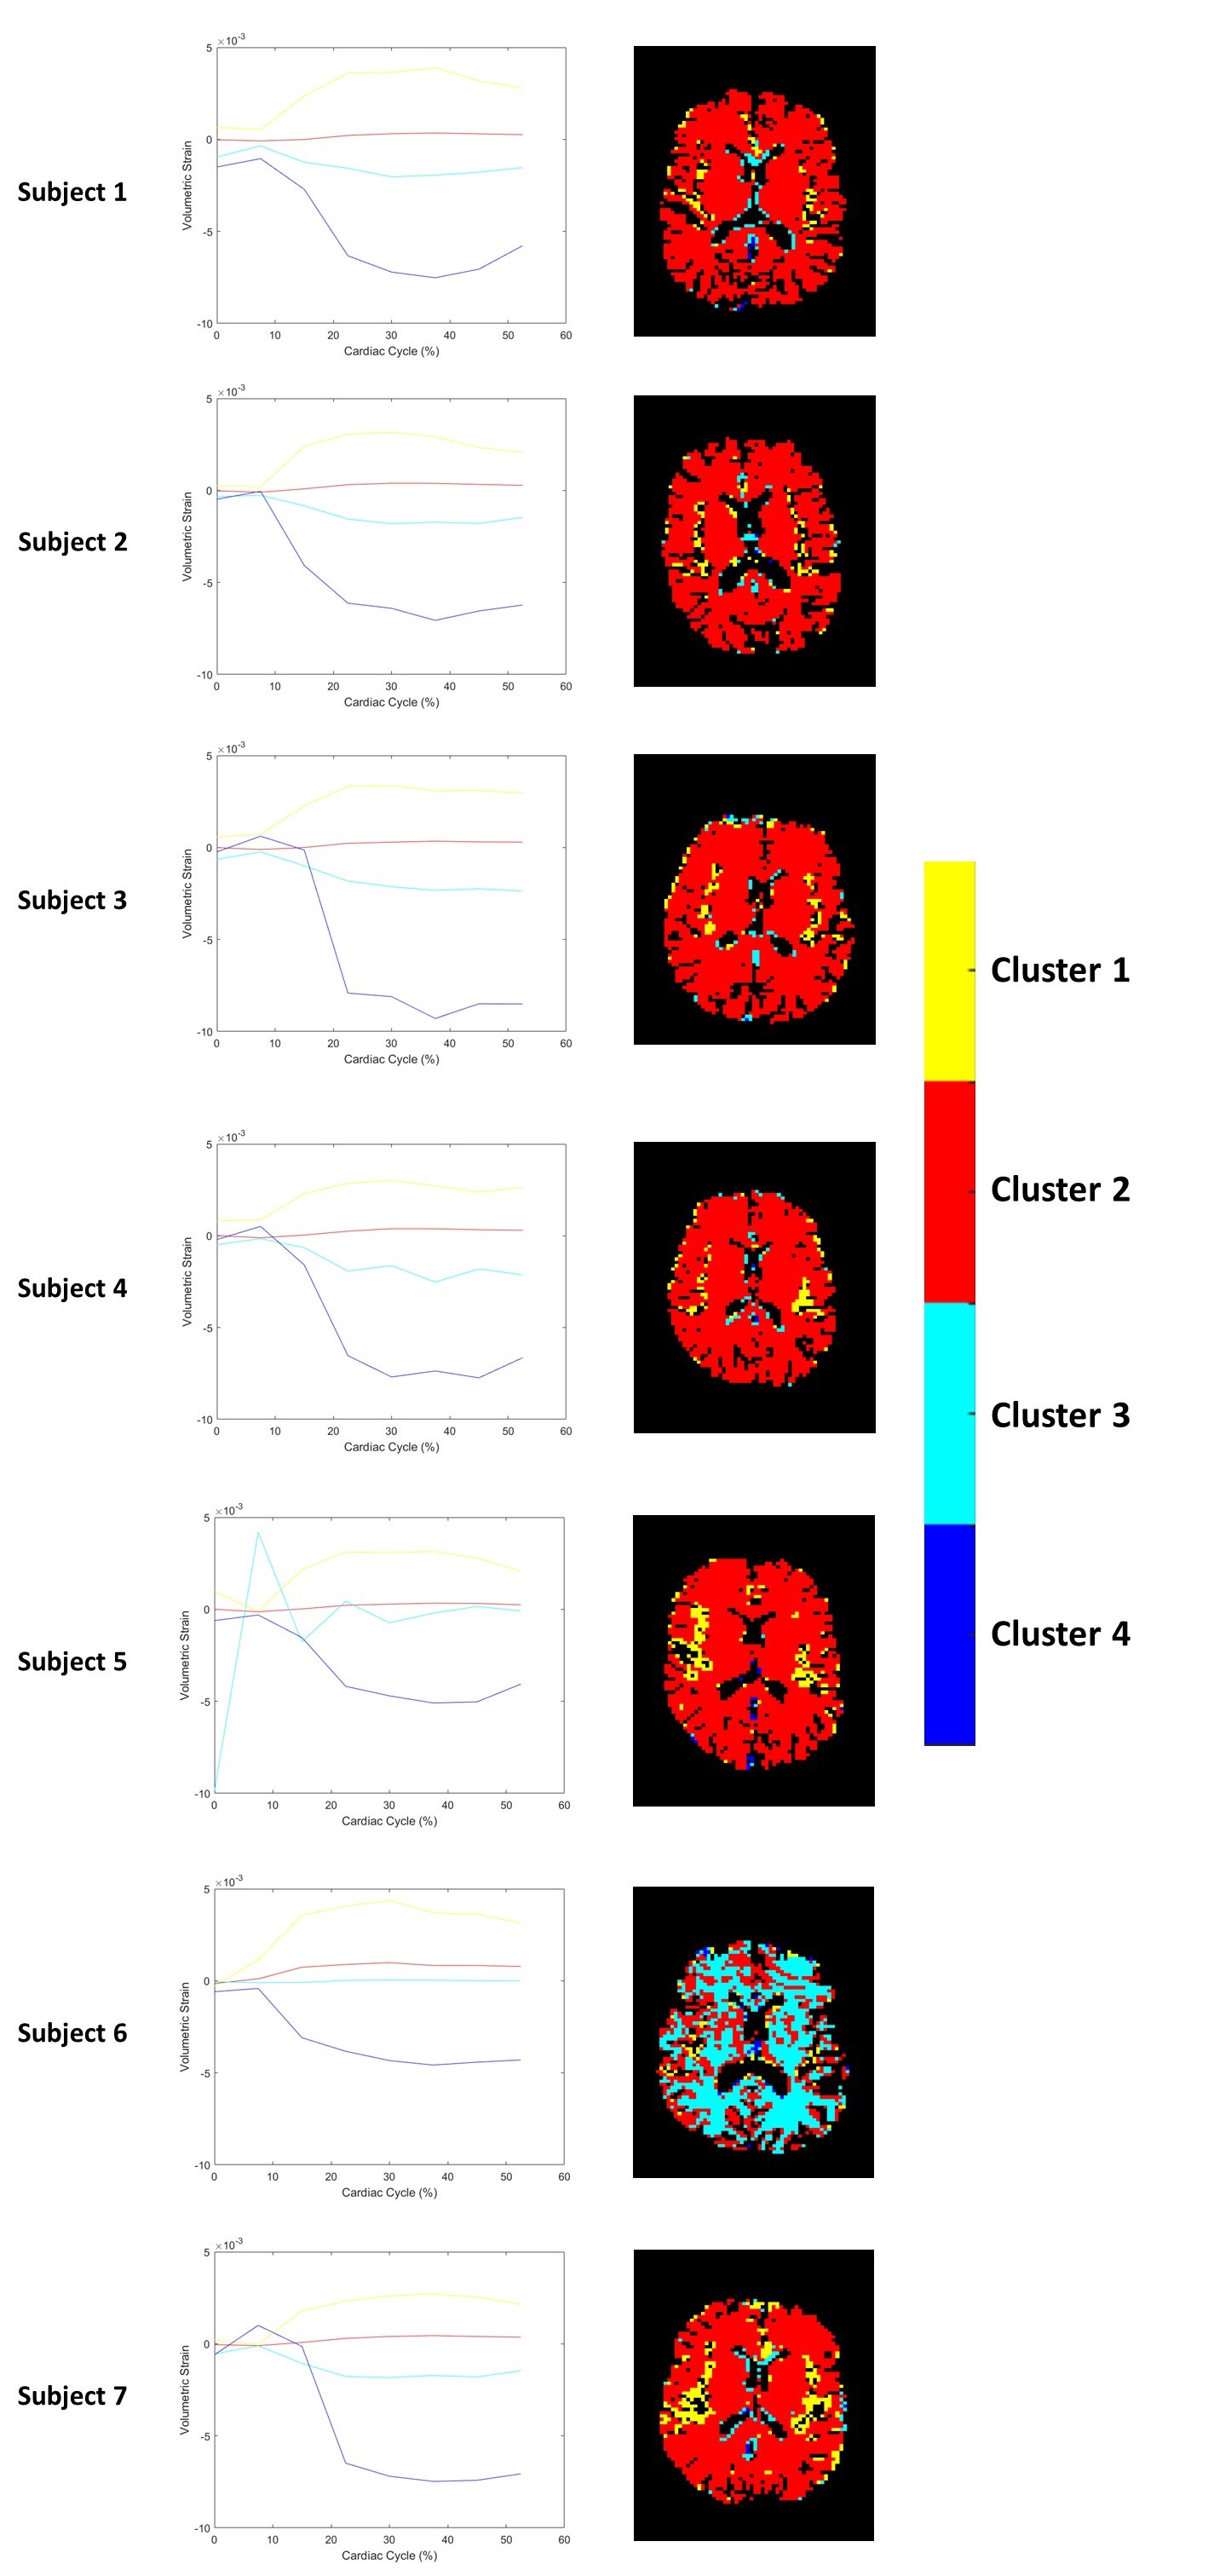
Two subjects showed volumetric strain distributions in some heart phases that laid considerably outside the normal range of volumetric strains and were excluded from further analysis. Figure 2 shows the mean volumetric strain curve within each of the clusters for the seven remaining subjects. In five of the seven subjects two expansion and two compression curves were found, of which cluster 1 and 4 showed considerably larger absolute volumetric strain values. The other two subjects showed largely similar clusters, except for the third cluster, which was deviating around zero rather than showing mild compression. Table 1 shows the volumes of the clusters (relative to whole brain mask volume). Considering the five aforementioned subjects, the expanding clusters (1 and 2 combined) comprised 94.3±0.7% of the brain, whereas the compressing clusters (3 and 4) covered 5.7±0.7% combined. Of the voxels in either two compressing clusters, 20±2% were situated within the white matter mask.Discussion
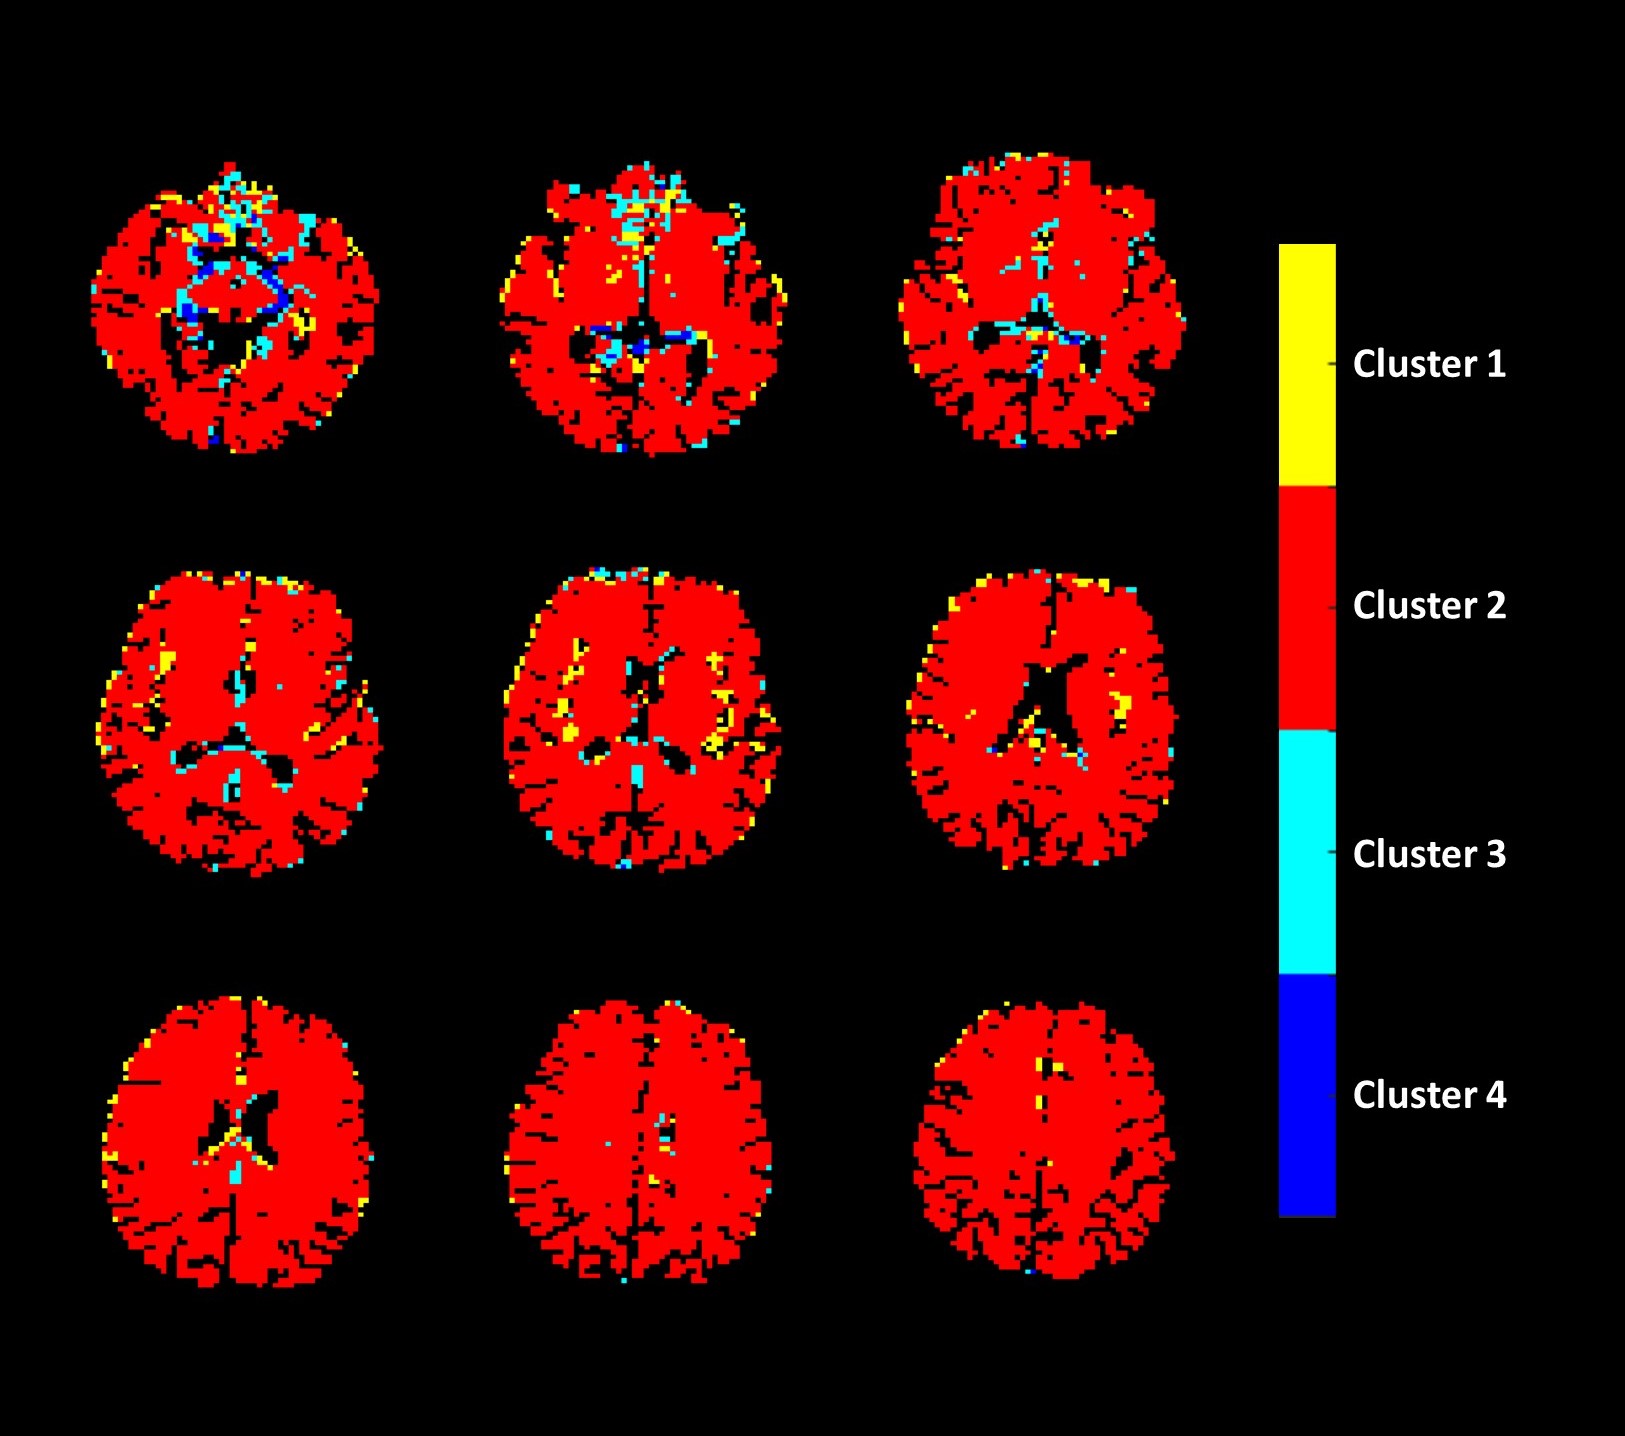
Five of the seven subjects showed consistent volumetric strain patterns: One cluster with large expansion, another with mild expansion, one with mild compression and lastly, one with relatively large compression. Cluster 2 with mild expansion showed volumetric strain that is similar to the whole brain volumetric strains reported before [1]. Cluster 1 with much larger strains is mainly located at the periphery and possibly reflects expansion of larger arteries in these areas. Spatial distribution of the compression clusters showed that compressing voxels are predominantly located around structures that allow compression by the movement of CSF or venous blood. Particularly, the area around the sagittal sinus and the ventricles showed compressing voxels (Figure 3). Therefore, the current clustering method can potentially be used to decontaminate the data from extreme strains due to fluid flow in local vessels or sulci. Additionally, it would be interesting to examine what patterns can be seen in other populations, such as patients.Conclusion
The current analysis provides a first observation on variability in volumetric strains in brain tissue during the systolic phase of the cardiac cycle. The compression clusters were mostly found in areas where compression can be reasonably explained due to the presence of structures that allow movement of fluids, rather than compression of brain tissue itself. However, additional analysis must be performed to establish the exact source of the observed compressions and to determine the appropriate way to use this knowledge in the analysis of volumetric strain data.Acknowledgements
This publication is financed by the Dutch Research Council (NWO), grant #18674References
[1] A. L. Adams, H. J. Kuijf, M. A. Viergever, P. R. Luijten, and J. J. M. Zwanenburg, “Quantifying cardiac-induced brain tissue expansion using DENSE,” NMR Biomed, vol. 32, no. 2, Feb. 2018, doi: 10.1002/nbm.4050.
[2] M. Soellinger, A. K. Rutz, S. Kozerke, and P. Boesiger, “3D cine displacement-encoded MRI of pulsatile brain motion,” Magn Reson Med, vol. 61, no. 1, pp. 153–162, 2009, doi: 10.1002/mrm.21802.
[3] J. J. Sloots, G. J. Biessels, A. de Luca, and J. J. M. Zwanenburg, “Strain Tensor Imaging: Cardiac-induced brain tissue deformation in humans quantified with high-field MRI,” Neuroimage, vol. 236, Aug. 2021, doi: 10.1016/j.neuroimage.2021.118078.
Figures