4885
Fast and High-Resolution Intracranial MR Angiography at 7T using FLEXA1GE HealthCare, Tokyo, Japan, 2GE HealthCare, Menlo Park, CA, United States, 3GE HealthCare, Waukesha, WI, United States, 4GE HealthCare, Hino, Japan
Synopsis
Keywords: High-Field MRI, High-Field MRI, 7T, 3DTOF, Non-contrast MRA, High gradient performance, microvascular
Motivation: Non-contrast 3DTOF demonstrates visualizing the cerebral microvasculature at 7T MRI, but the scan time is too long, typically about 10 minutes due to requiring high spatial resolution.
Goal(s): Our goal was to reduce the acquisition time by a factor of 2.
Approach: We utilize FLEXA on the high gradient performance system at 7T.
Results: Comparable image quality to 3DTOF was obtained with FLEXA technique with a factor of 2 decrease in acquisition time.
Impact: The improvement in acquisition speed through FLEXA comes from the strategy of short TR with thin slab and opens new standard for scan protocol optimization at 7T MRA.
Introduction
3D time-of-flight (TOF) MR angiography (MRA) benefits from ultra-high-field MRI due to improved contrast and increased signal-to-noise ratio, showing the promise to improve visualization of the microvasculature1,2. However, high-resolution TOF MRA at 7T requires longer acquisition time, 10 minutes, and is proportion to the number of phase and slice encodings. FLEXA3,4 is a fast 3D Two-point Dixon MRA technique with short TR and MOTSA. It provides an opportunity for reduced scan time in high-resolution scans while Two-point Dixon method with bipolar gradient readout acquisition can calculate the water-fat separation both in highly inhomogeneous areas and long TEs that can happen in a high-resolution MRA scan at 7T. In this work, we explore the feasibility of leveraging FLEXA in a 7T MRI with high gradient performance (113 mT/m, 260 T/m/s) and improve image quality with a Deep Learning reconstruction5. A volunteer study was performed to compare to conventional 3DTOF.Methods
Bloch-simulations were performed to understand arterial blood signal for inflow saturation effect at 7T where FLEXA uses short TR and thin slab acquisition, and 3DTOF uses long TR and thick slab acquisition. Scan parameters such as TR, slab thickness, flip angle and flow velocity in blood T1 value of 2087 ms6 were changed with Matlab R2023a (MathWorks Inc., Natick, MA). FLEXA used TR 8ms and slab thickness 15 mm. 3DTOF used TR 30ms and slab thickness 40 mm in the simulation.The Dixon reconstruction uses FLEX7 to separate water (W) and fat (F) images from in-phase (IP) and out-of-phase (OP) images. A composite image for MRA is calculated by p⋅W+q⋅ OP +r⋅ IP ,∣p∣+∣q∣+∣r∣=1 to compensate for Water-Fat swap that is the incorrect assignment of water and fat components where blood flow is subject to B0 inhomogeneity and strong susceptibility.
The 3D DL Recon used in our study (AIR Recon DL, GE Healthcare) is a deep convolutional residual encoder network trained to reconstruct images from MR data with reduced noise, reduced Gibbs ringing, and enhanced resolution. The convolutional network is embedded in the image reconstruction.
For volunteer scan, FLEXA used 10, 15 and 20 degree of flip angles for protocol optimization. And FLEXA scanned with the protocols that have low resolution of 0.8x0.8x0.6mm3 at 4:41 and high spatial resolution of 0.5x0.5x0.6mm3 at 8:58. These were compared to 3DTOF of spatial resolution 0.4x0.5x0.6mm3 at 11:08. A volunteer was scanned with a 32-channel receive, 2-channel transmit coil (Nova Medical, Wilmington, MA, U.S.A) and a high-performance gradient (G=113mT/m and G=260T/m/s) on GE SIGNA 7.0T MRI (GE Healthcare, Waukesha, WI, U.S.A.) scanner following in-house IRB approval. The detailed scan protocol is listed in Table1.
Results
Figure.1 shows the simulation results for inflow saturation effects. FLEXA gives increased arterial signal with higher flip angle in 200 and 500 mm/s of flow velocity. The use of flip angle 20 degree tends to reduce blood signal in slow flow of 100 mm/s. For comparison with 3DTOF, FLEXA shows lower signal intensity than 3DTOF in flow velocity of 200 and 500 mm/s. They are at parity at 100 mm/s. Notice that FLEXA signal intensity was calculated with only a single echo in simulation. Actually, two echoes of in-phase TE and out-of-phase TE are combined to give sqrt(2) increase of the signal in ideal case that ignores TE effect.Figure.2 shows that representative MIP images for flip angle optimization in FLEXA. Flip angle 20 degree was best in terms of image contrast between arterial and white matter signal. Vessel depictions were comparable in all three images.
Figure.3 shows that representative MIP images for FLEXA and 3DTOF comparison. FLEXA depicted more arterial vessels with increased spatial resolution. Surprisingly, FLEXA with low resolution of 0.8x0.8x0.6mm3 had more arterial vessels than 3DTOF of 0.4x0.5x0.6mm3 .
Figure.4 shows DL reconstructed source and MIP MRA images, demonstrating improved background noise suppression with DL.
Discussions and conclusion
FLEXA acquisition has demonstrated that the strategy of short TR with thin slab acquisition achieved both shortening scan time by about 20% for the high-resolution scan and for about 58% for the low-resolution scan, and improving small vessel delineation at the same time compared to 3DTOF. High gradient performance made it possible to scan with high spatial resolution of 0.5x0.5x0.6mm3 using bipolar readout gradient which acquires two echoes efficiently to process with Two-point Dixon for separating water and fat components and outputting the composite MRA that is immune to water-fat swap artifacts. FLEXA could reduce further scan time with under-sampling acquisition because this full sampling FLEXA scan shows high arterial blood signal in the image and the simulation results support this.Acknowledgements
No acknowledgement found.References
1. Wardlaw JM, Smith C, Dichgans M. Small vessel disease: mechanisms and clinical implications. Lancet Neurol. 2019 Jul;18(7):684-696. doi: 10.1016/S1474-4422(19)30079-1.
2. Park CA, Kang CK, Kim YB, Cho ZH. Advances in MR angiography with 7T MRI: From microvascular imaging to functional angiography. Neuroimage. 2018 Mar;168:269-278.
3. Amemiya S, Takei N, Ueyama T, Fujii K, Takao H, Yasaka K, Watanabe Y, Kamiya K, Abe O. Accelerated Two-Point Dixon MR Angiography Improves Diagnostic Performance for Cervical Artery Diseases. J Magn Reson Imaging. 2022 Sep;56(3):929-941.
4. Takei N, Amemiya S et al. FLEXA 3DTOF: Fast 3D TOF MR Angiography using Thin-slab Two-Point Dixon Acquisition. In Proceedings of the Joint annual meeting of the ISMRM-ESBRMB 4130 (2022).
5. Lebel RM. Performance characterization of a novel deep learning-based MR image reconstruction pipeline. 2020. arXiv preprint, arXiv:2008.06559.
6. Wright PJ, Mougin OE, Totman JJ, Peters AM, Brookes MJ, Coxon R, Morris PE, Clemence M, Francis ST, Bowtell RW, Gowland PA. Water proton T1 measurements in brain tissue at 7, 3, and 1.5 T using IR-EPI, IR-TSE, and MPRAGE: results and optimization. MAGMA. 2008 Mar;21(1-2):121-30.
7. Ma J. Breath-hold water and fat imaging using a dual-echo two- point Dixon technique with an efficient and robust phase-correction algorithm. Magn Reson Med 2004;52:415–419.
Figures
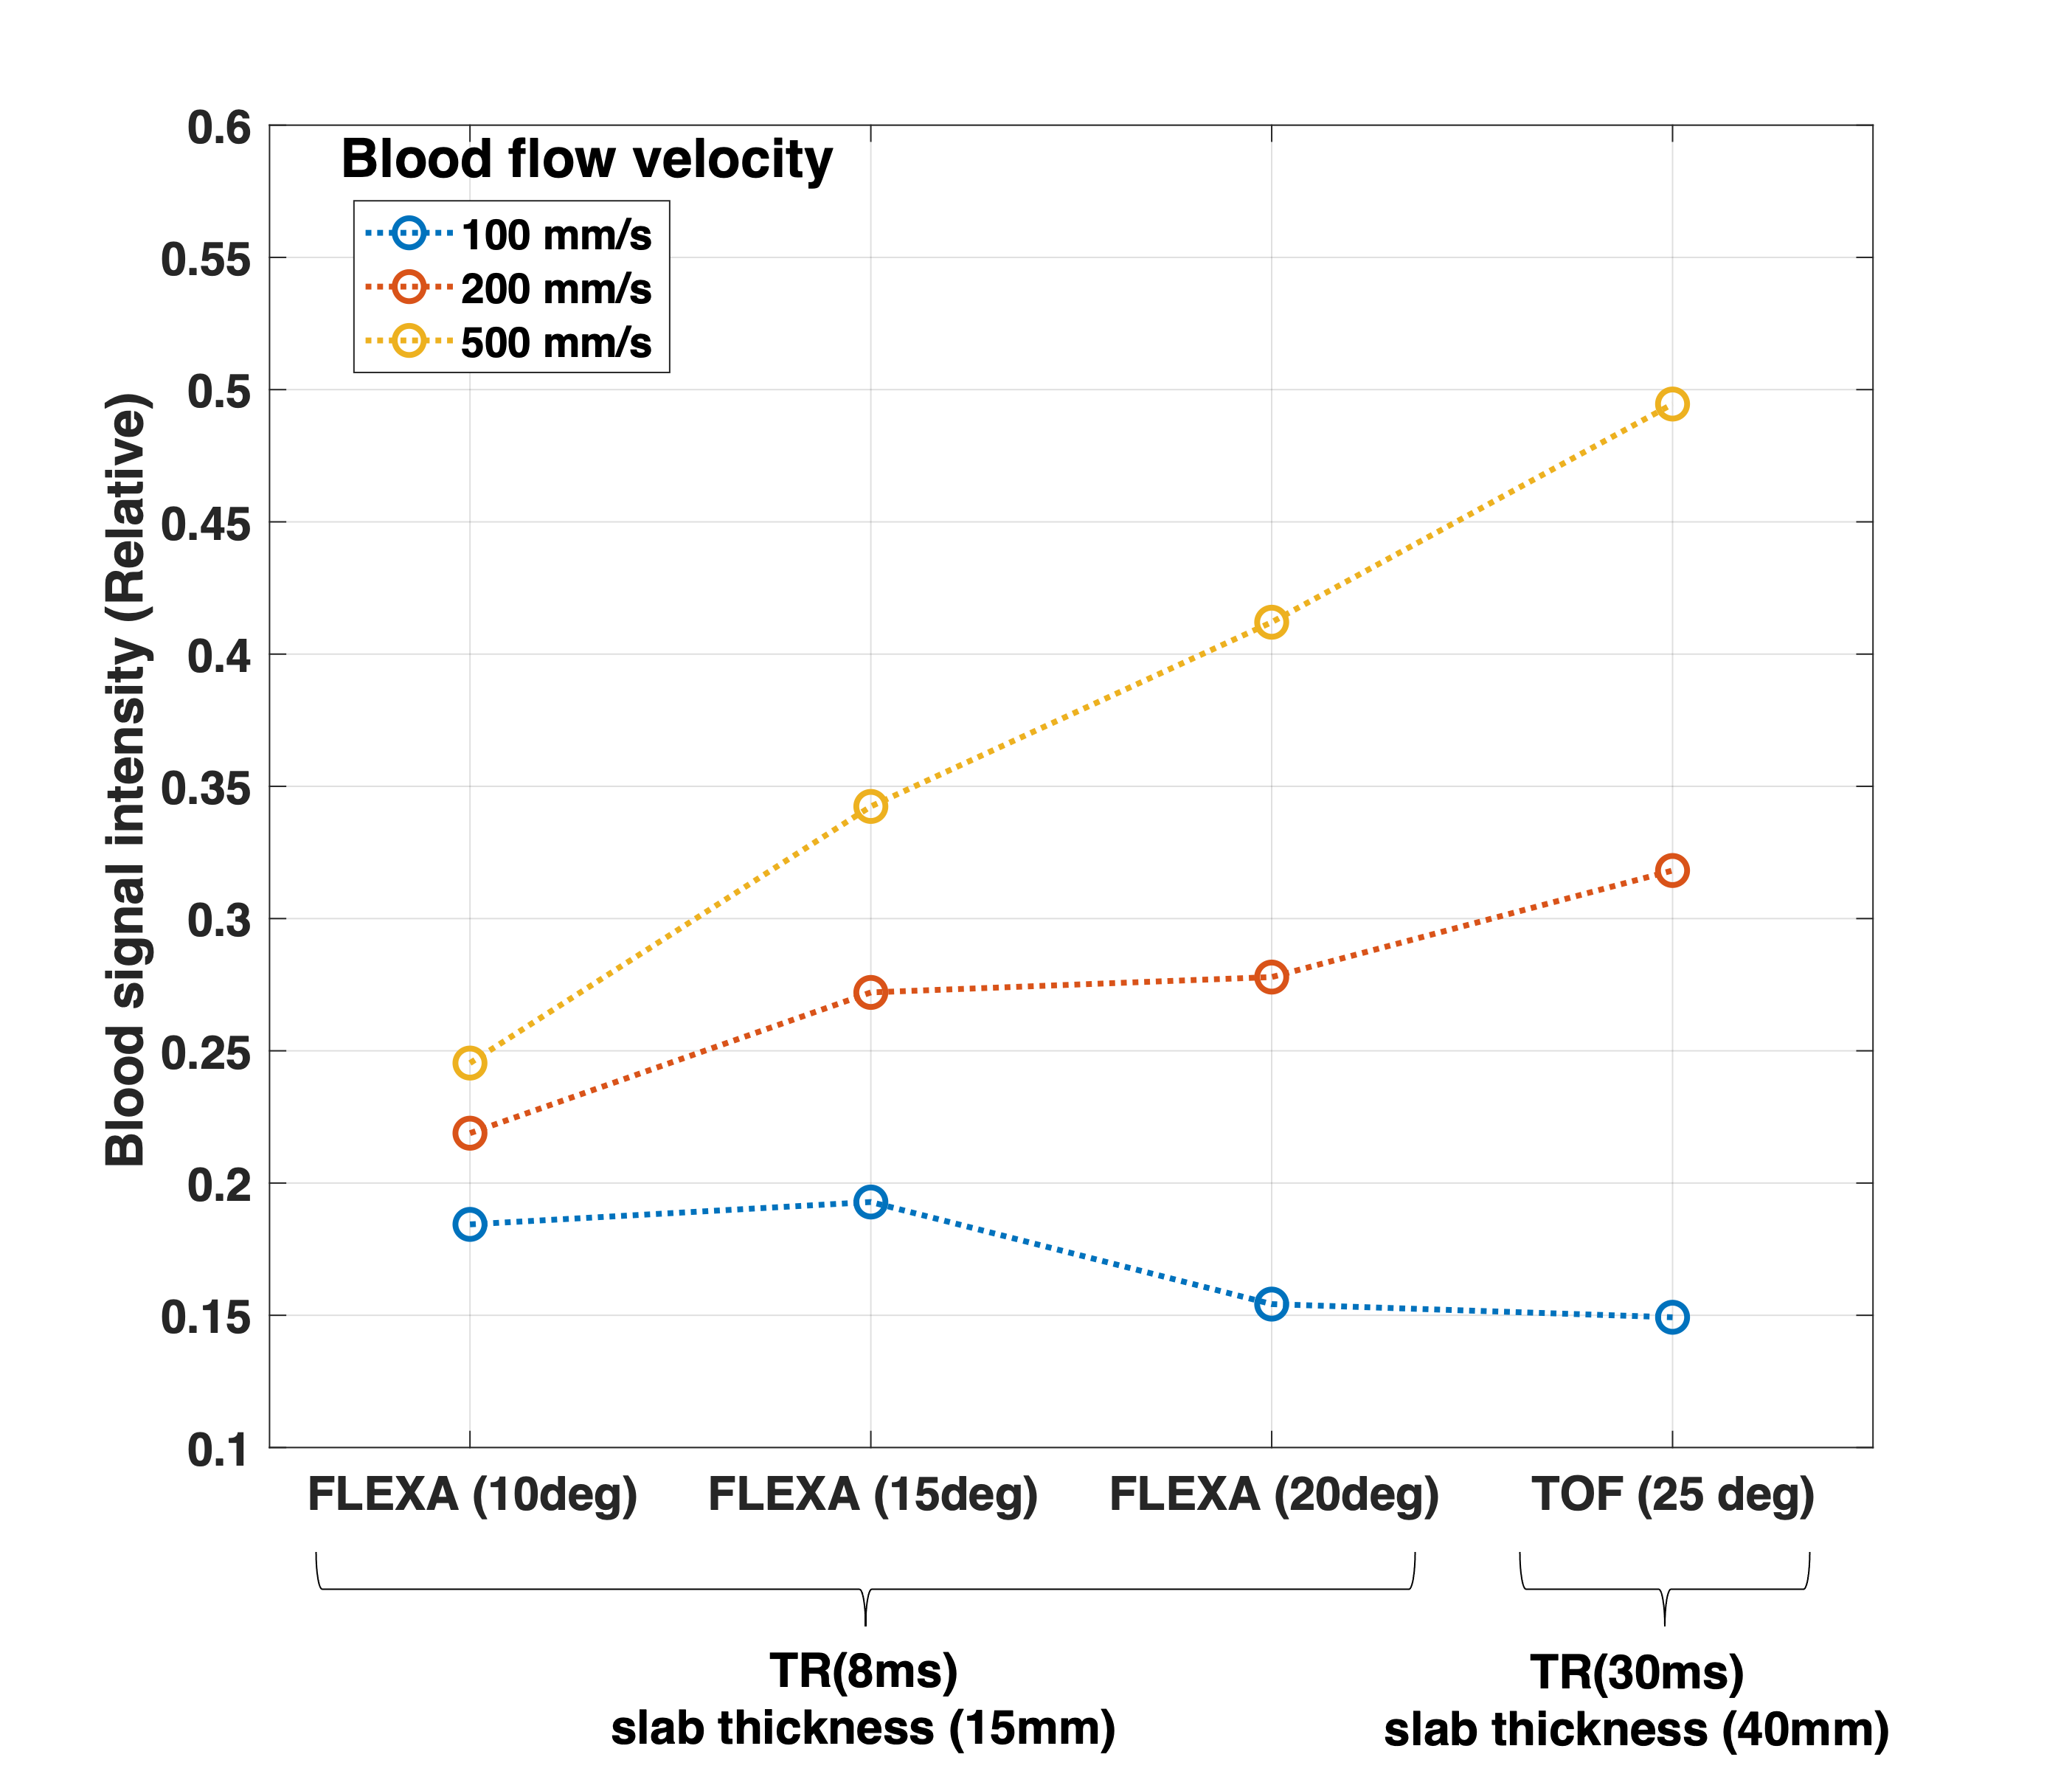
Figure.1. A simulation result was shown to understand arterial signal for blood saturation effect at 7T. FLEXA used short TR and thin slab thickness and 3DTOF uses long TR and thick slab thickness. Even with the use of short TR 8 ms, FLEXA showed comparable signal intensity, especially at slow flow of 100 mm/s. Notice that blood signal intensity of FLEXA calculated only single echo from multi-echoes for simplicity.
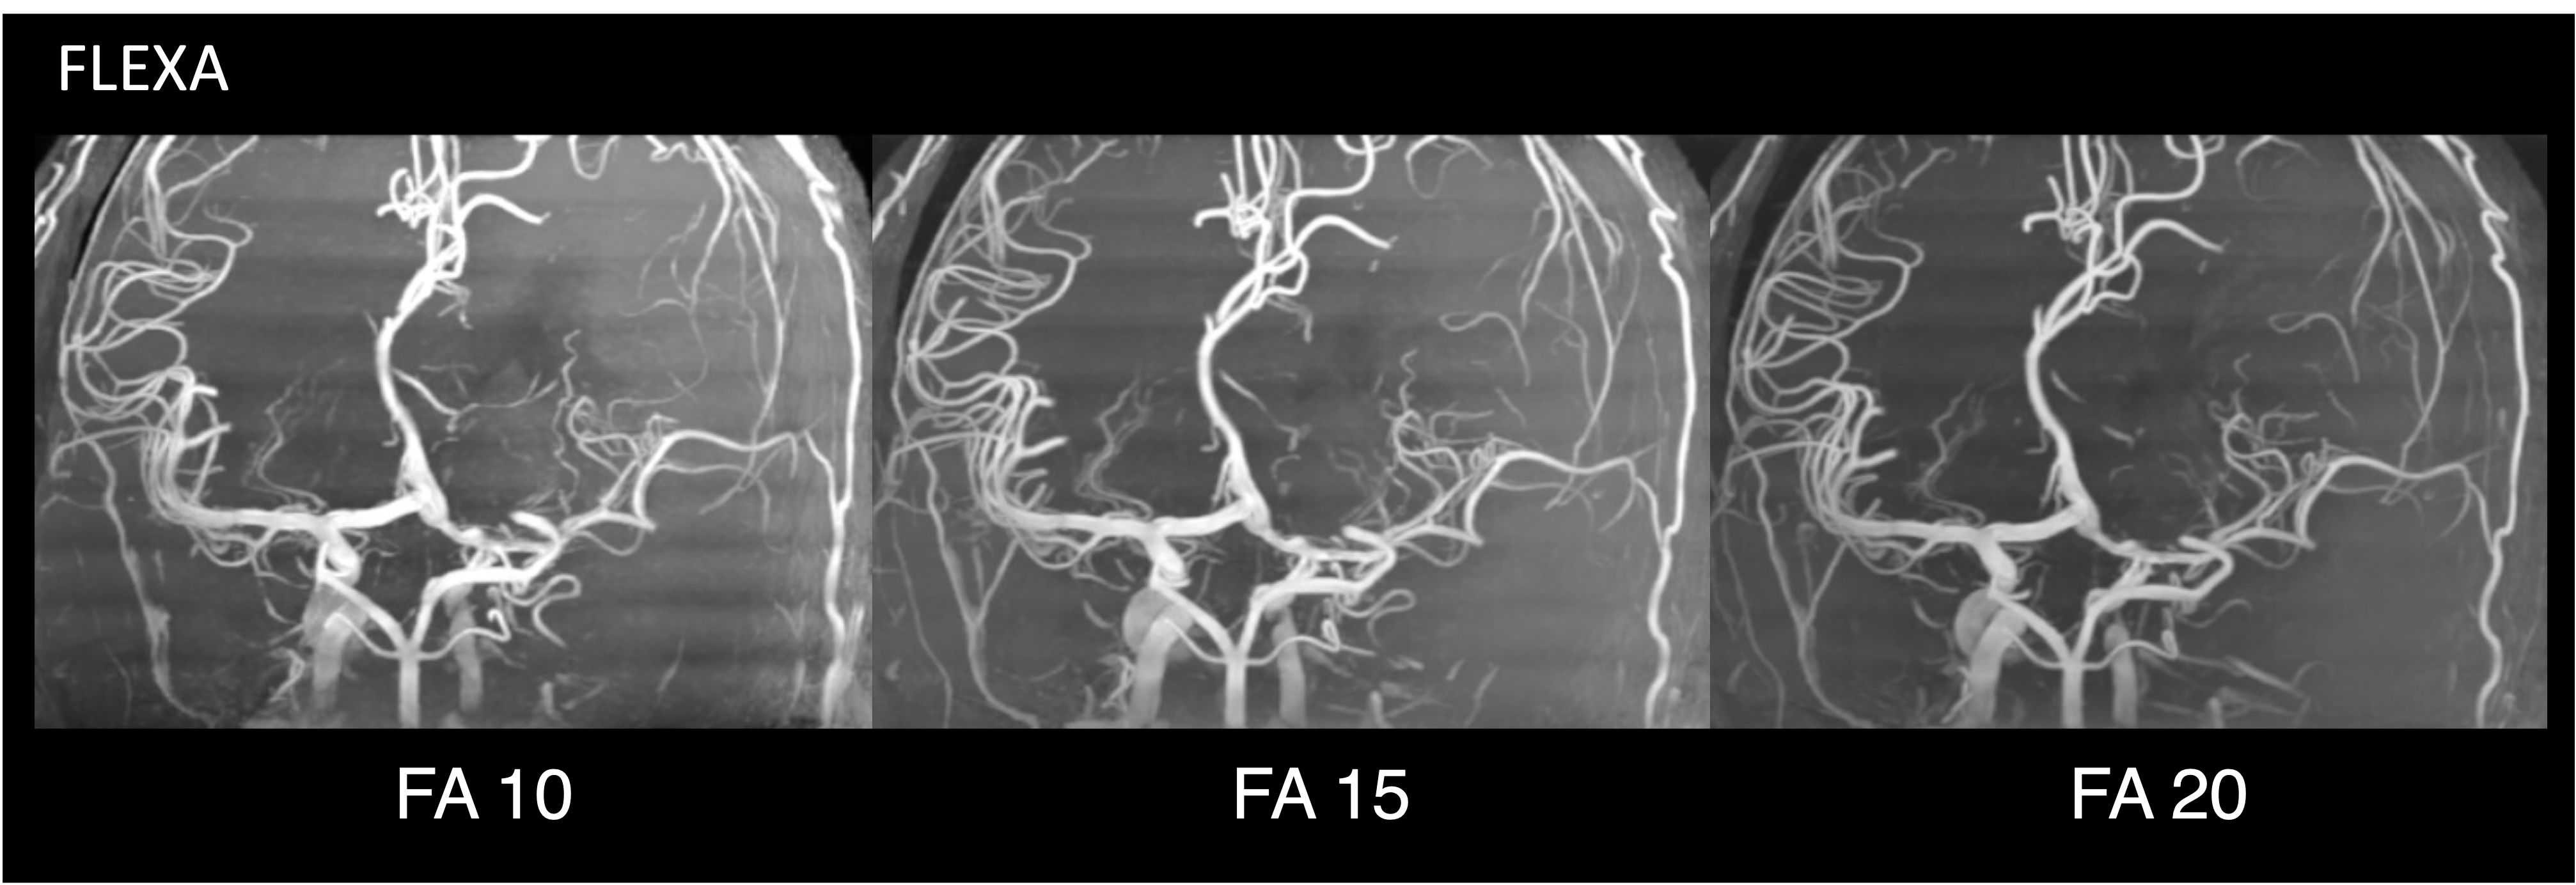
Figure.2. FLEXA MIP images to optimize flip angle. The left image: flip angle 10 degree. The middle image: flip angle 15 degree. The right image: flip angle 20 degree. The FA 20 shows highest image contrast. The comparable vessel depictions were obtained in all the three. The same window level and width were used.
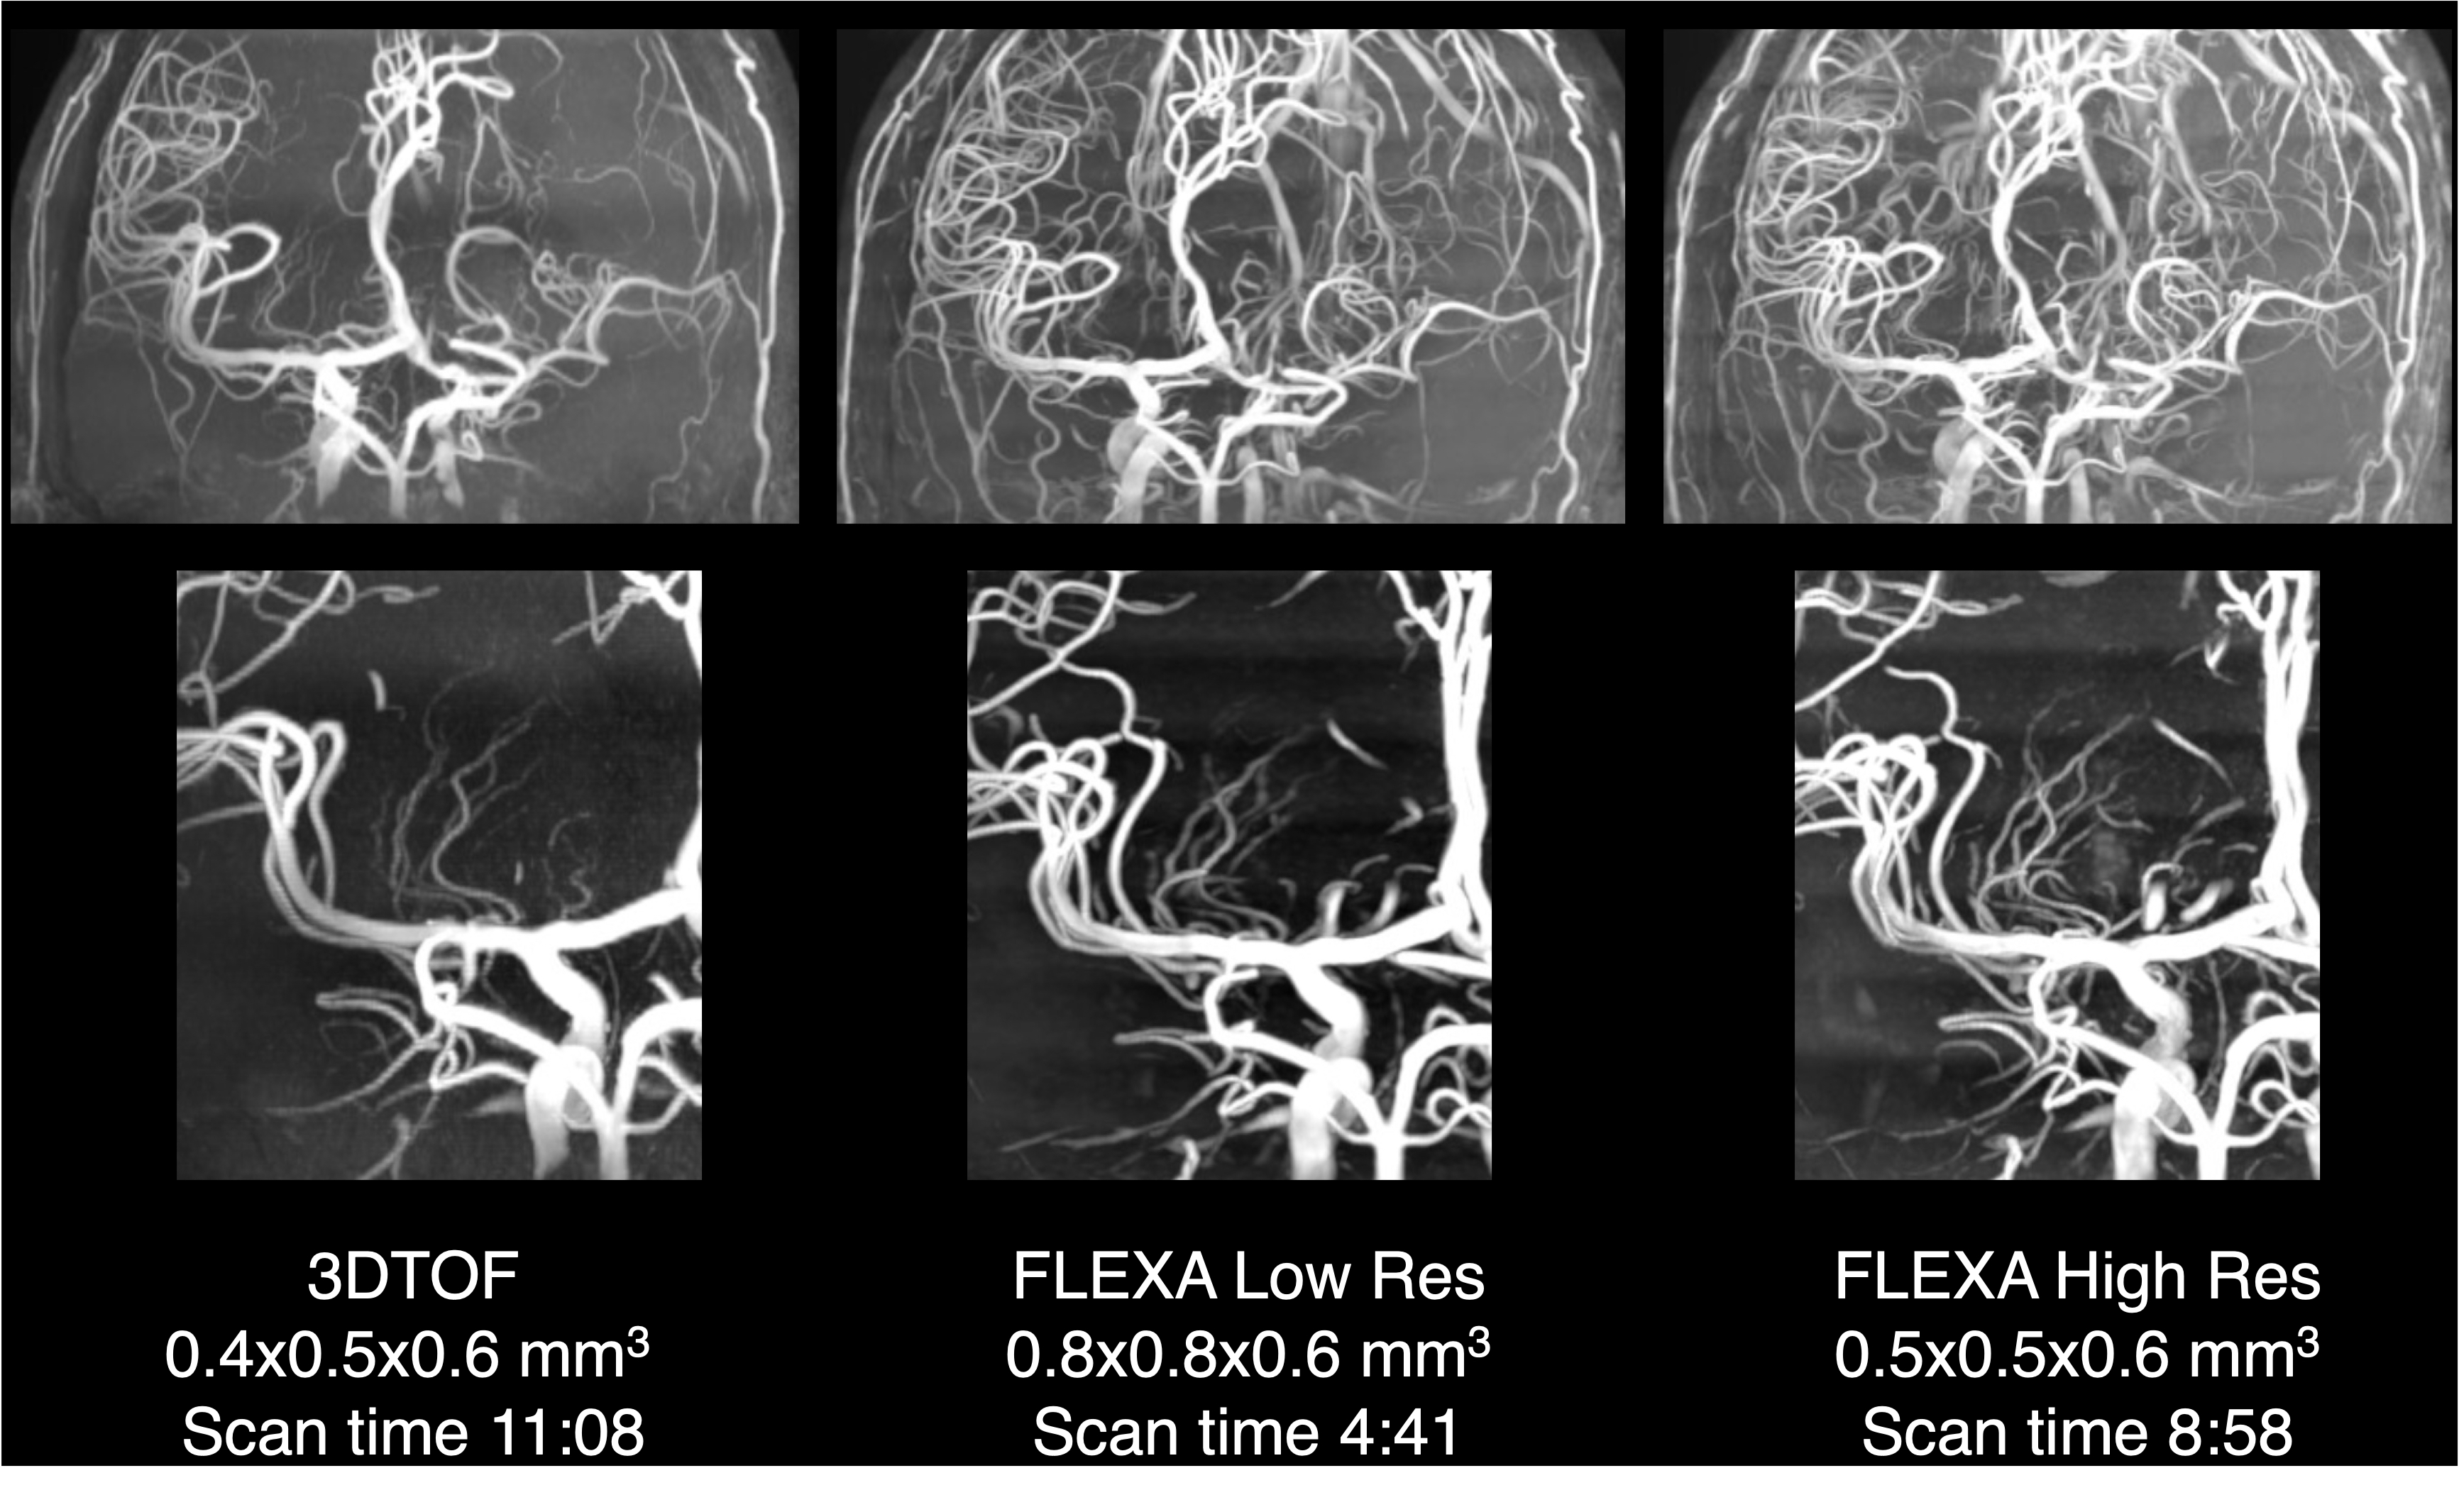
Figure.3. Comparison to 3DTOF on the left MIP image. FLEXA achieved both reduced scan time and better vessel delineation than 3DTOF at the same time. The upper images: Coronal MIP images. The lower images: Perforating artery images.
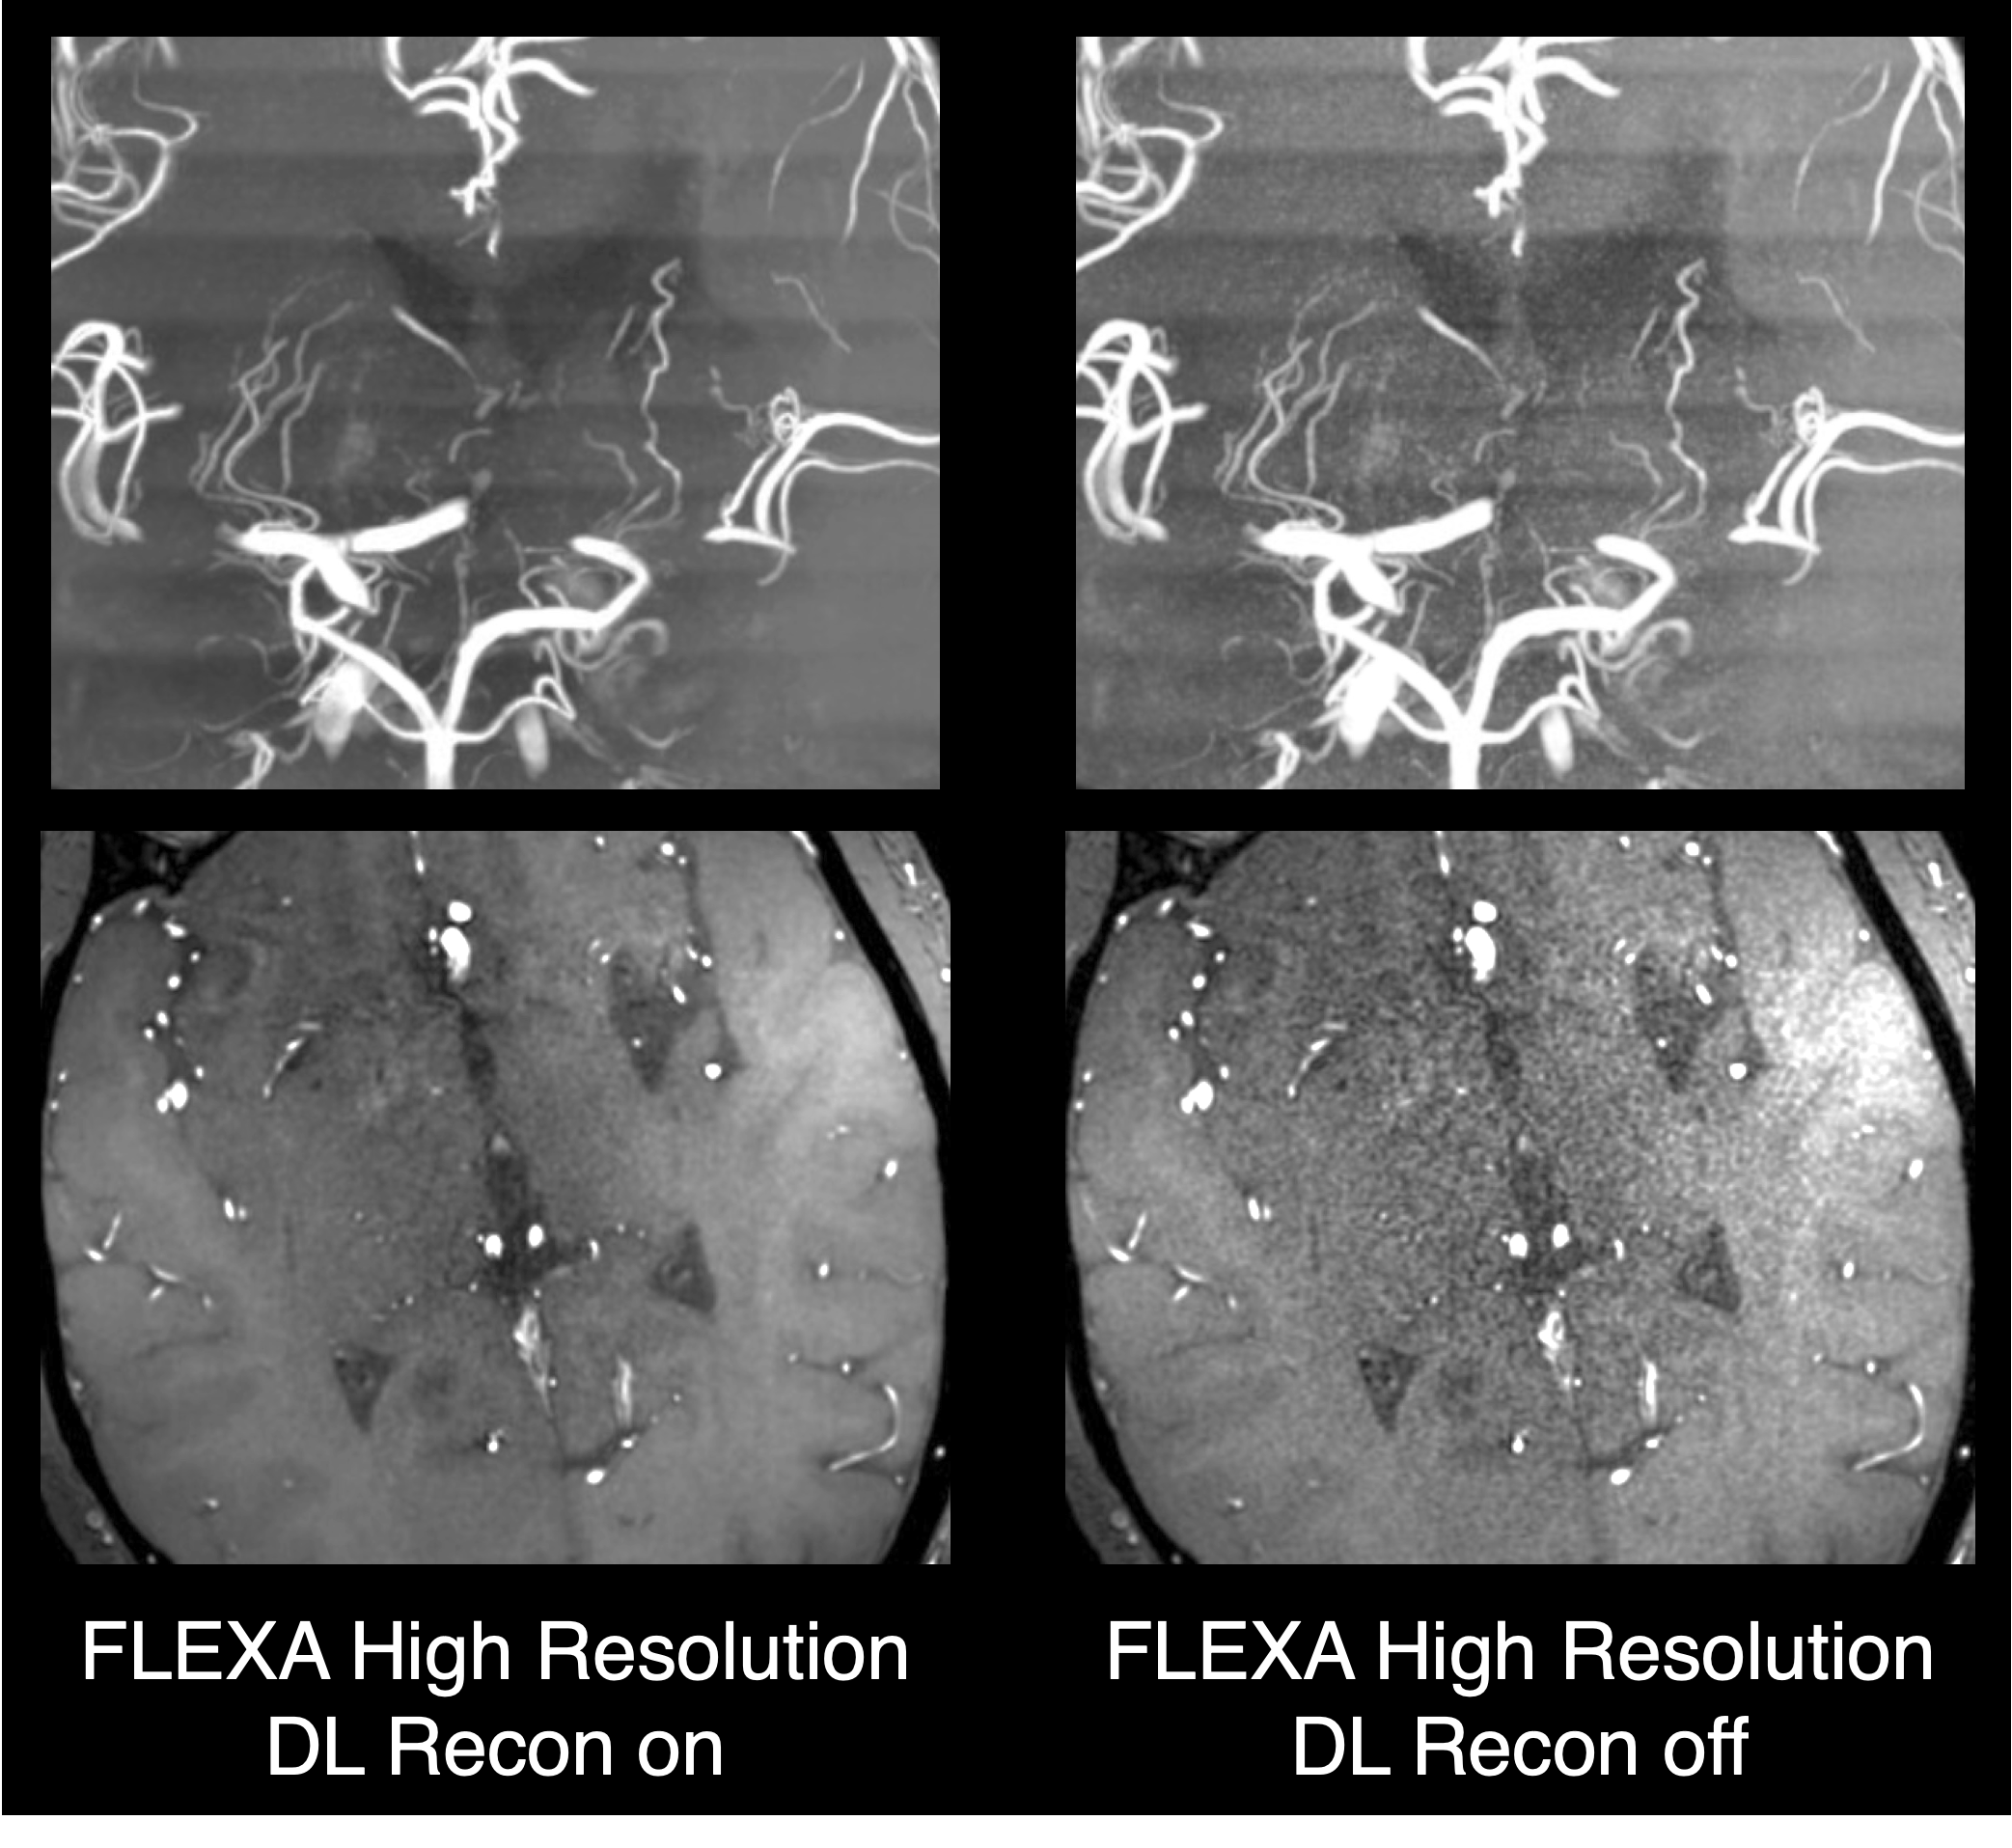
Figure.4. Representative FLEXA images to compare DL recon on and off. The upper images: MIP image. The lower images: source images.
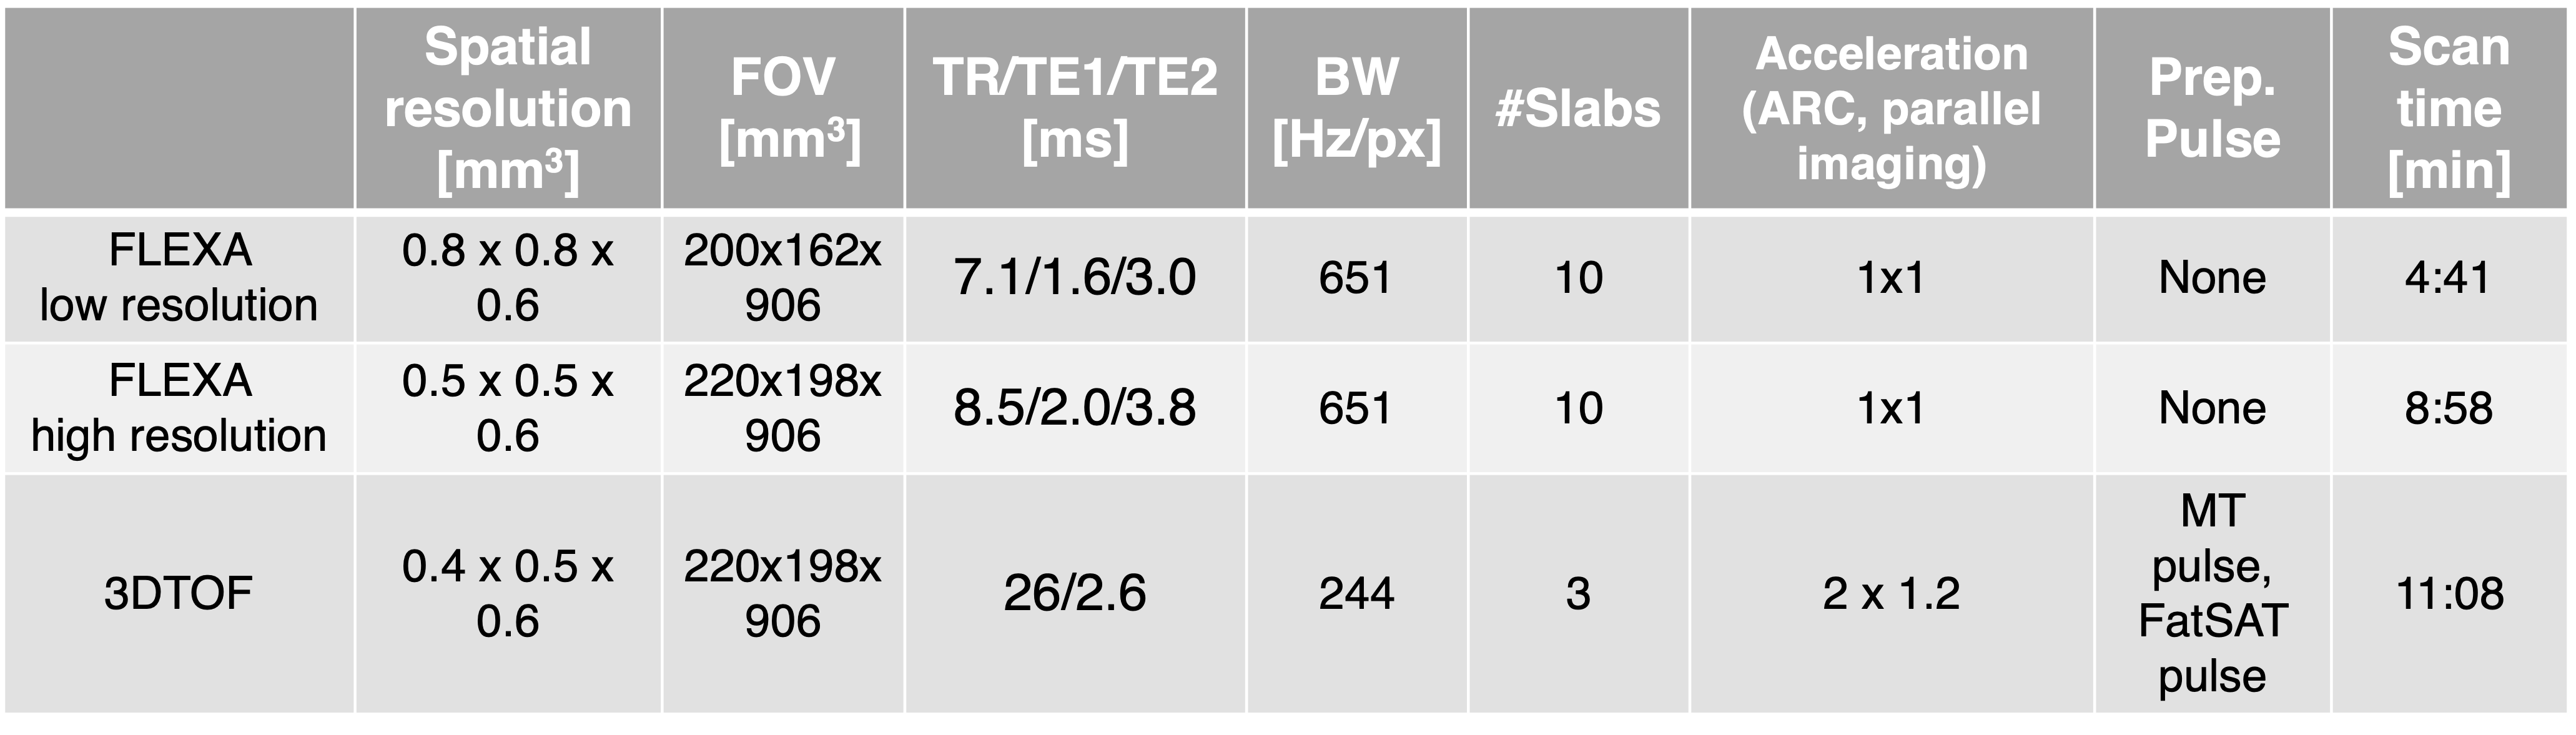
Table.1. Scan parameters for low spatial resolution FLEXA, high spatial resolution FLEXA and conventional 3DTOF