4883
A 36 month assessment of ASL reproducibility using a commercial perfusion phantom1Gold Standard Phantoms Limited, Sheffield, United Kingdom, 2NMR Research Unit, UCL Queen Square Institute of Neurology, London, United Kingdom, 3Brain Repair and Rehabilitation, UCL Queen Square Institute of Neurology, London, United Kingdom
Synopsis
Keywords: Phantoms, Phantoms, ASL, perfusion
Motivation: During longitudinal studies it is important to ensure quality assurance of MRI data. Here we use a commercially available perfusion phantom for QA of ASL in a 40-patient placebo-control study.
Goal(s): The goal of this study was to assess the utility of a perfusion phantom for QA of ASL MRI in a clinical trial setting.
Approach: Inversion recovery T1 measurements and pseudo-continuous ASL at 3 different phantom flow rates were scanned periodically on a 3T MRI system over a 36 month period.
Results: Once data due to errant phantom behaviour was discounted, the QA metric of labelling efficiency was in a reasonable range.
Impact: By acquiring independent T1 measures of the phantom’s perfusate, then computing ASL perfusion maps and comparing against the phantom’s pump flow rate, a useful QA metric can be established that can provide confidence in acquired subject ASL data.
Introduction
In this work, we present the use of a commercially available perfusion phantom for quality assurance (QA) measurements throughout the course of a 40-patient placebo-control study. Here, the phantom was used to establish a baseline of how reproducible MRI systems’ ASL perfusion measurements are.Methods
Study DesignA commercially available perfusion phantom[1], [2] was scanned as part of the QA protocol in a 40-patient clinical trial. Phantom scans corresponded with subject scans: 39 datasets acquired over 36 months (2019 - 2022).
MRI Protocol
Data were acquired on a 3T MRI system (Achieva dStream, Philips Healthcare):
- pCASL: labelling duration 1.8s, post-labelling delay 1.8s, background-suppressed 3D-GRASE acquisition, acquisition matrix 80x80x30, 3mm isotropic resolution. Two M0 volumes (without background suppression), followed by three control-label pairs. Repeated for 3 nominal flow rates: 200, 275 and 350 ml/min.
- Single-slice inversion recovery for assessing T1 with the pump off, turbo spin echo acquisition,TE 87.79ms, acquisition matrix 256x256, 0.86 mm in-plane resolution, 3mm slice thickness, TI 0.1, 0.3, 0.5, 1.0, 2.0, 3.0s, TR=TI + 2s.
Data was analysed using custom python software. For each dataset:
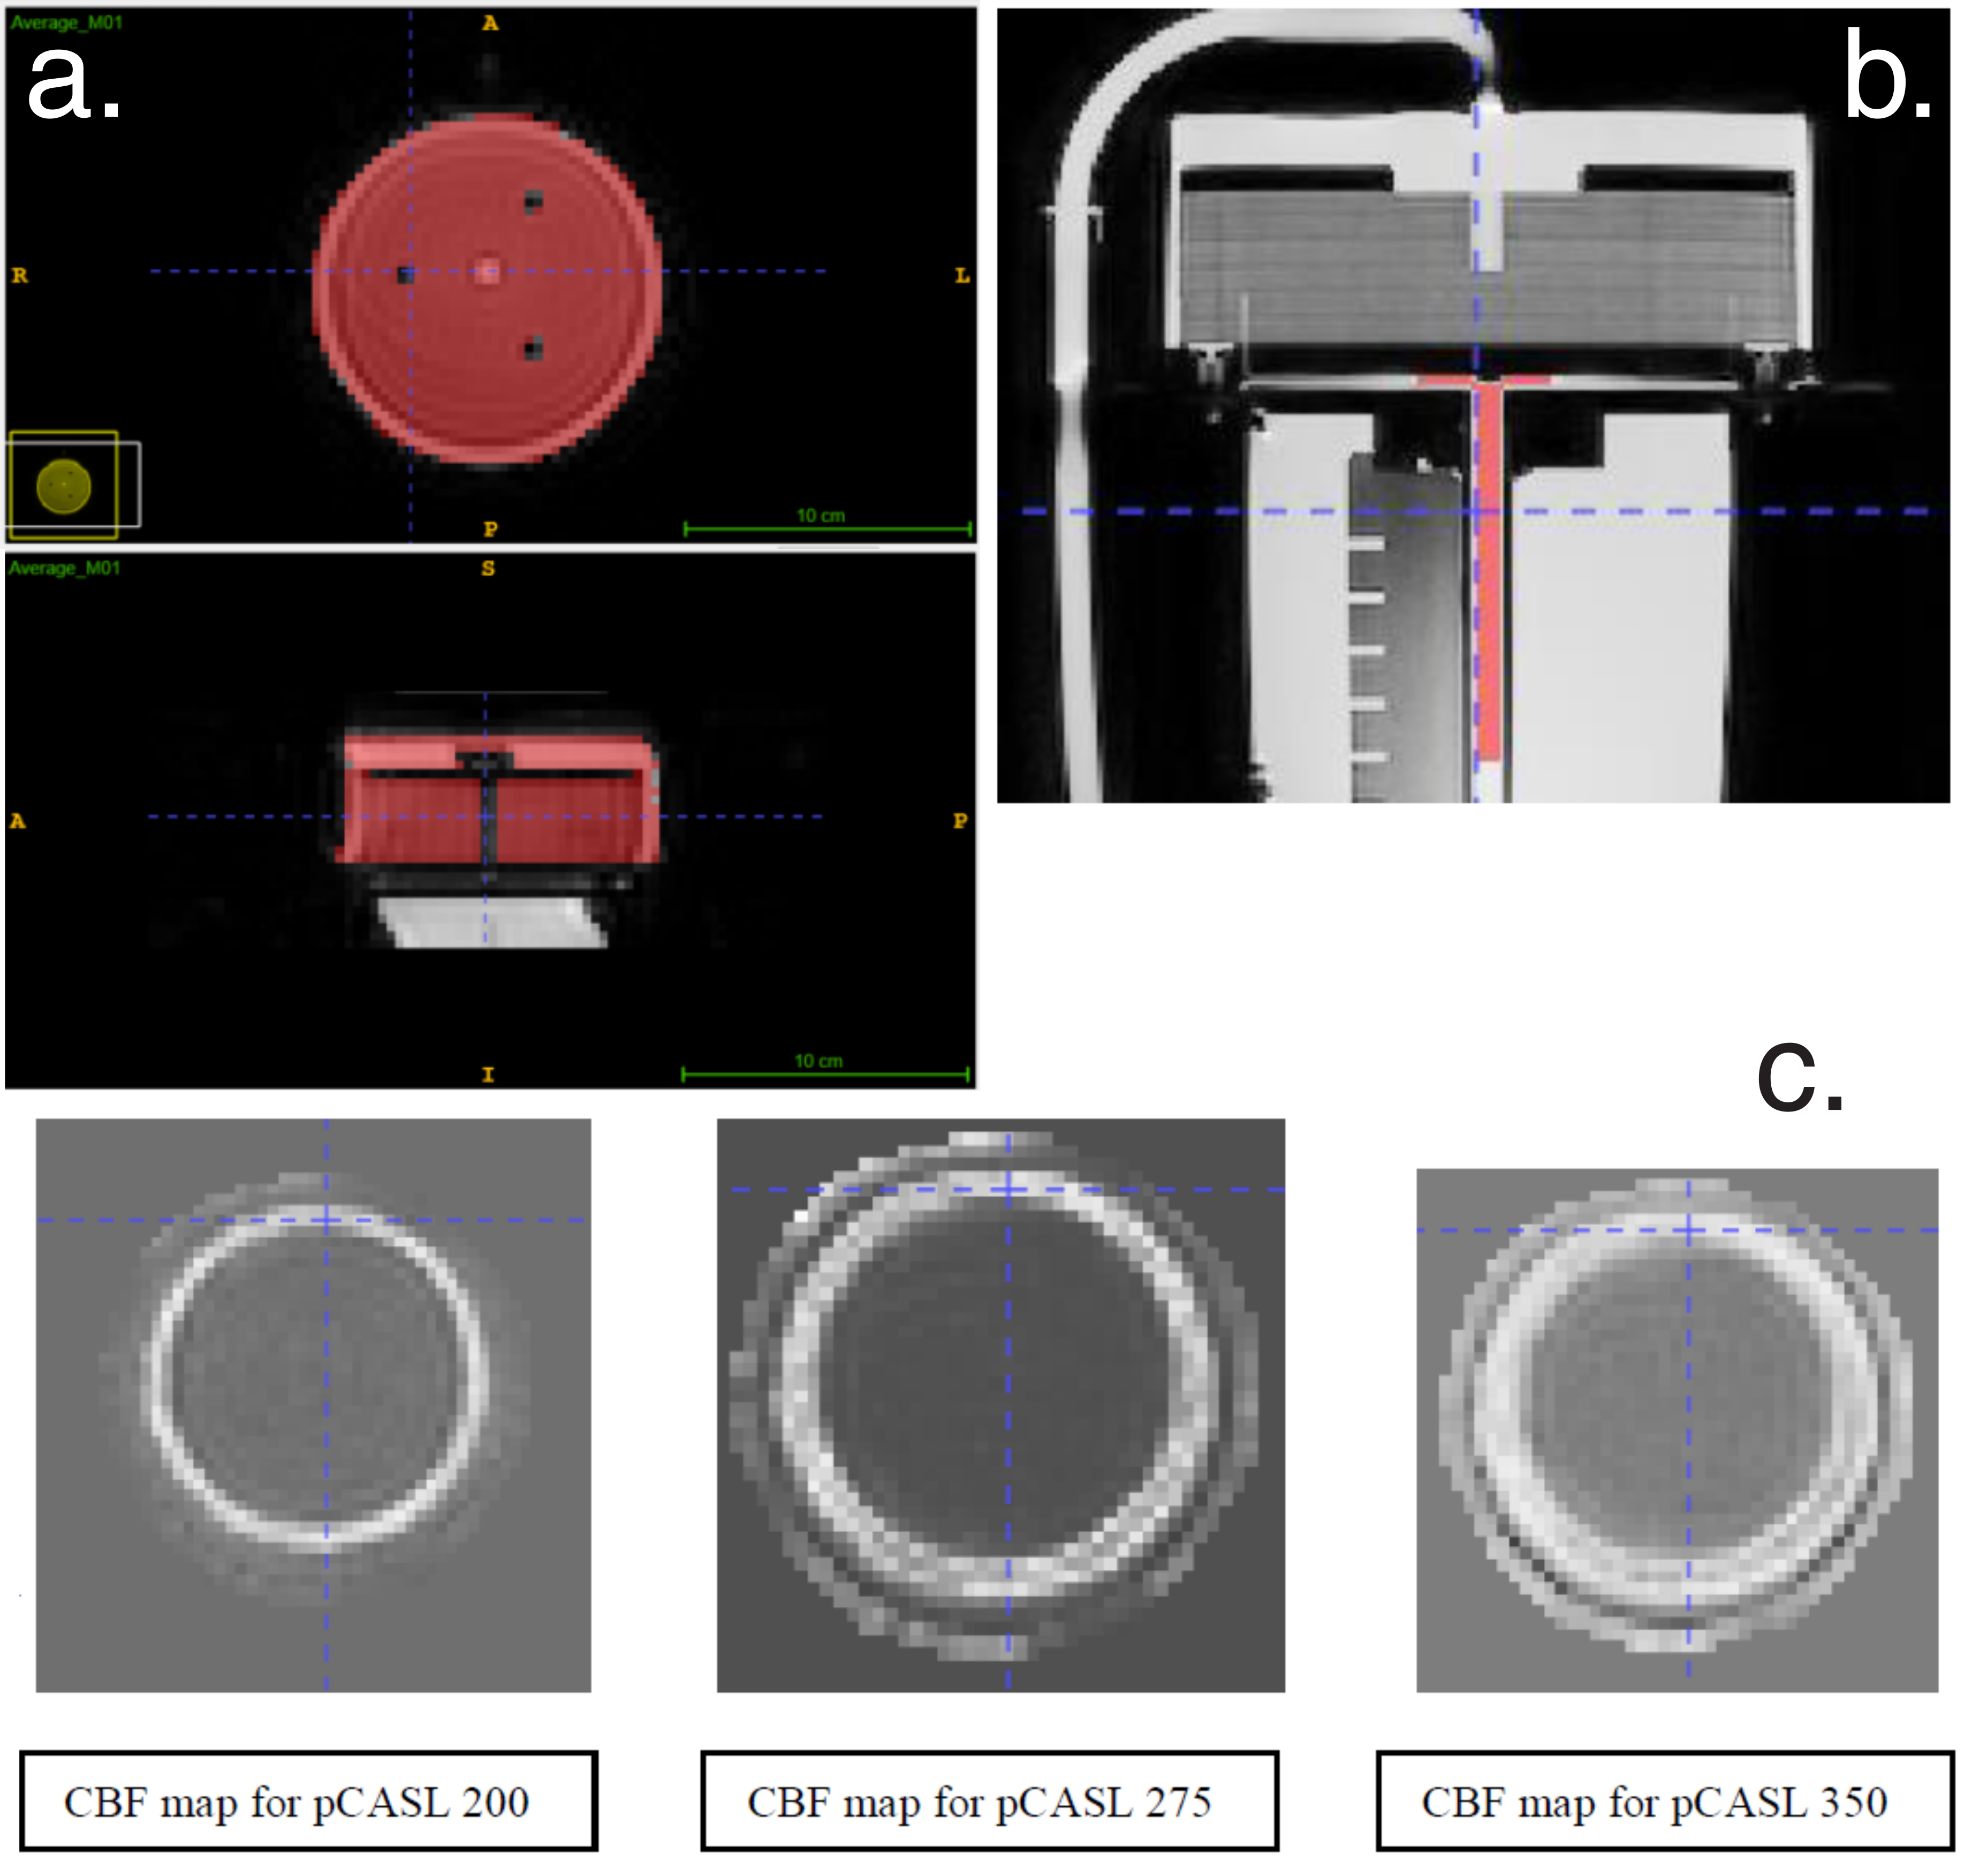
- Masks were manually drawn using ITK-SNAP of the labelling tube (IR data), and the entire perfusion chamber (ASL data)
- The perfusate T1 was estimated from the IR data using a 1000 iteration Monte Carlo method[3]: in each iteration signal values for each TI were randomly drawn from the distribution of voxel values in the ROI, then fitted to the inversion recovery signal equation $$$S=S_0(1-2 \eta e^{-\frac{TI}{T1}}+e^{-\frac{TR}{T1}})$$$ . The mean and standard deviation of the resultant T1 probability density function (PDF) were then calculated.
- CBF maps were calculated voxel-wise according to the single-subtraction “whitepaper” equation[4], using the IR data estimate for T1, partition coefficient =0.32[5], assuming perfect labelling efficiency.
- The mean CBF value within the perfusion chamber, and the mass of the perfusion chamber (418g) were used to compute the flow rate. Then, using the ratio of the two flow rates the labelling efficiency was calculated.
Results
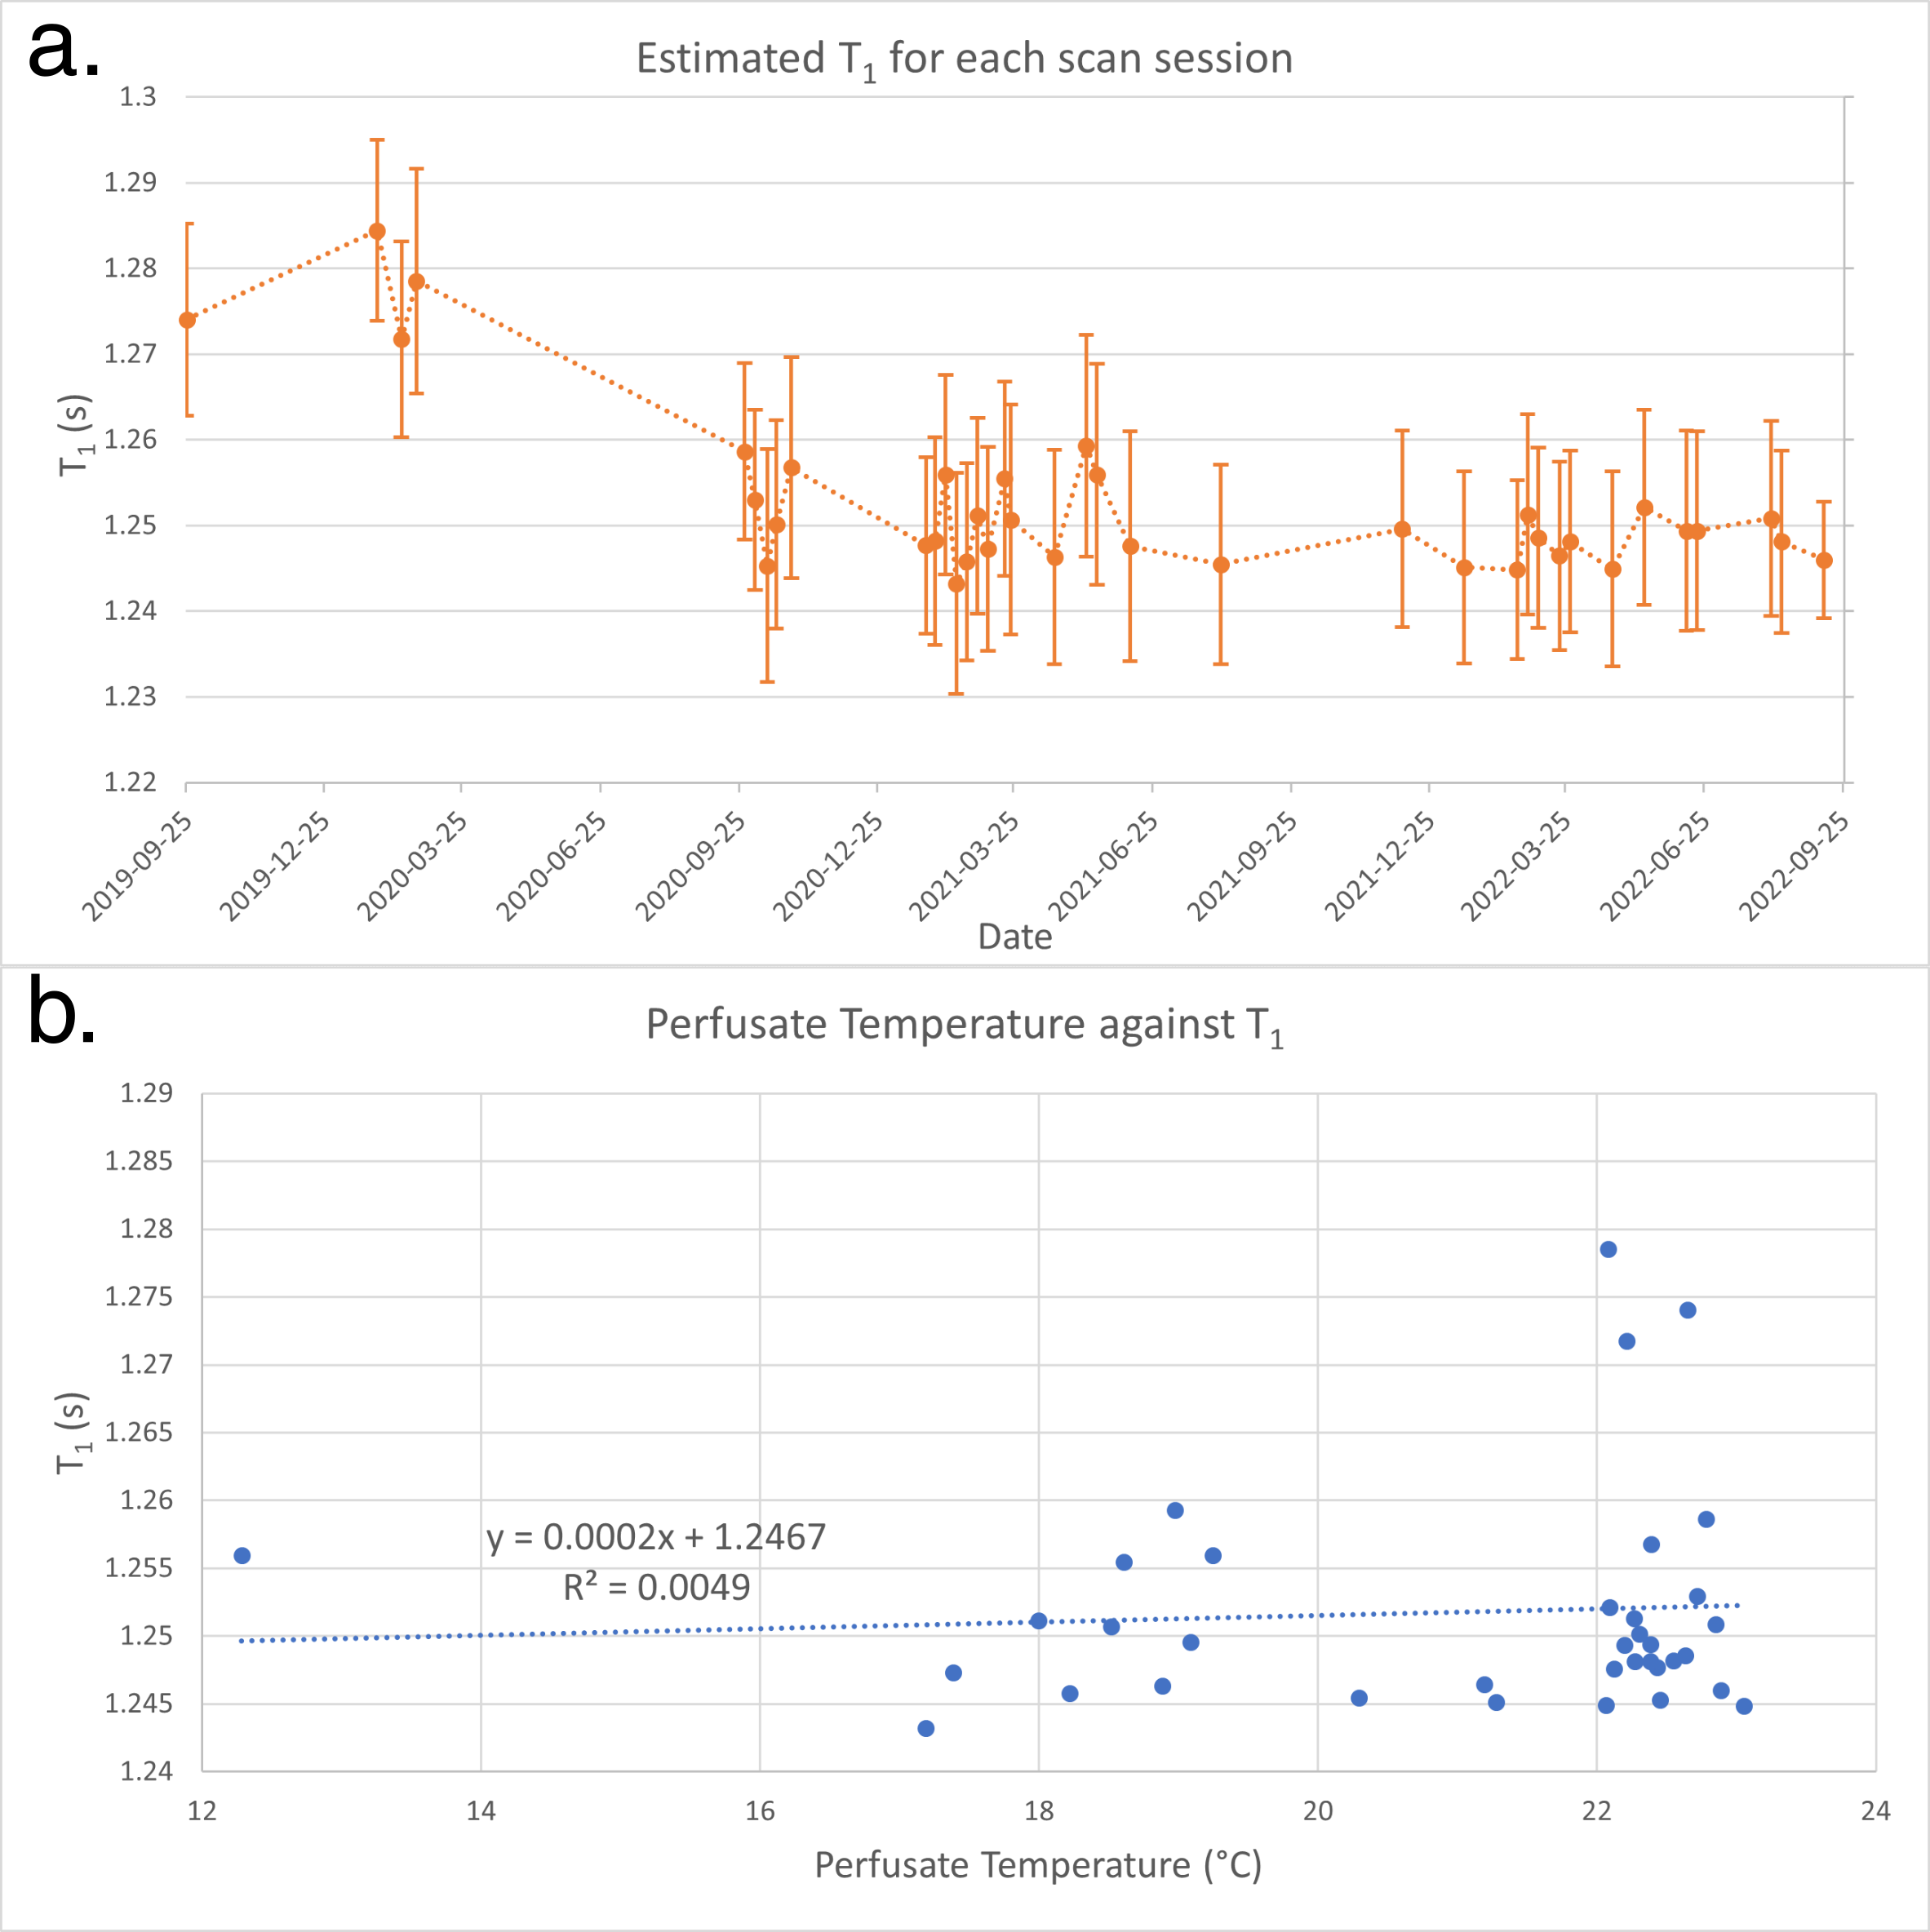
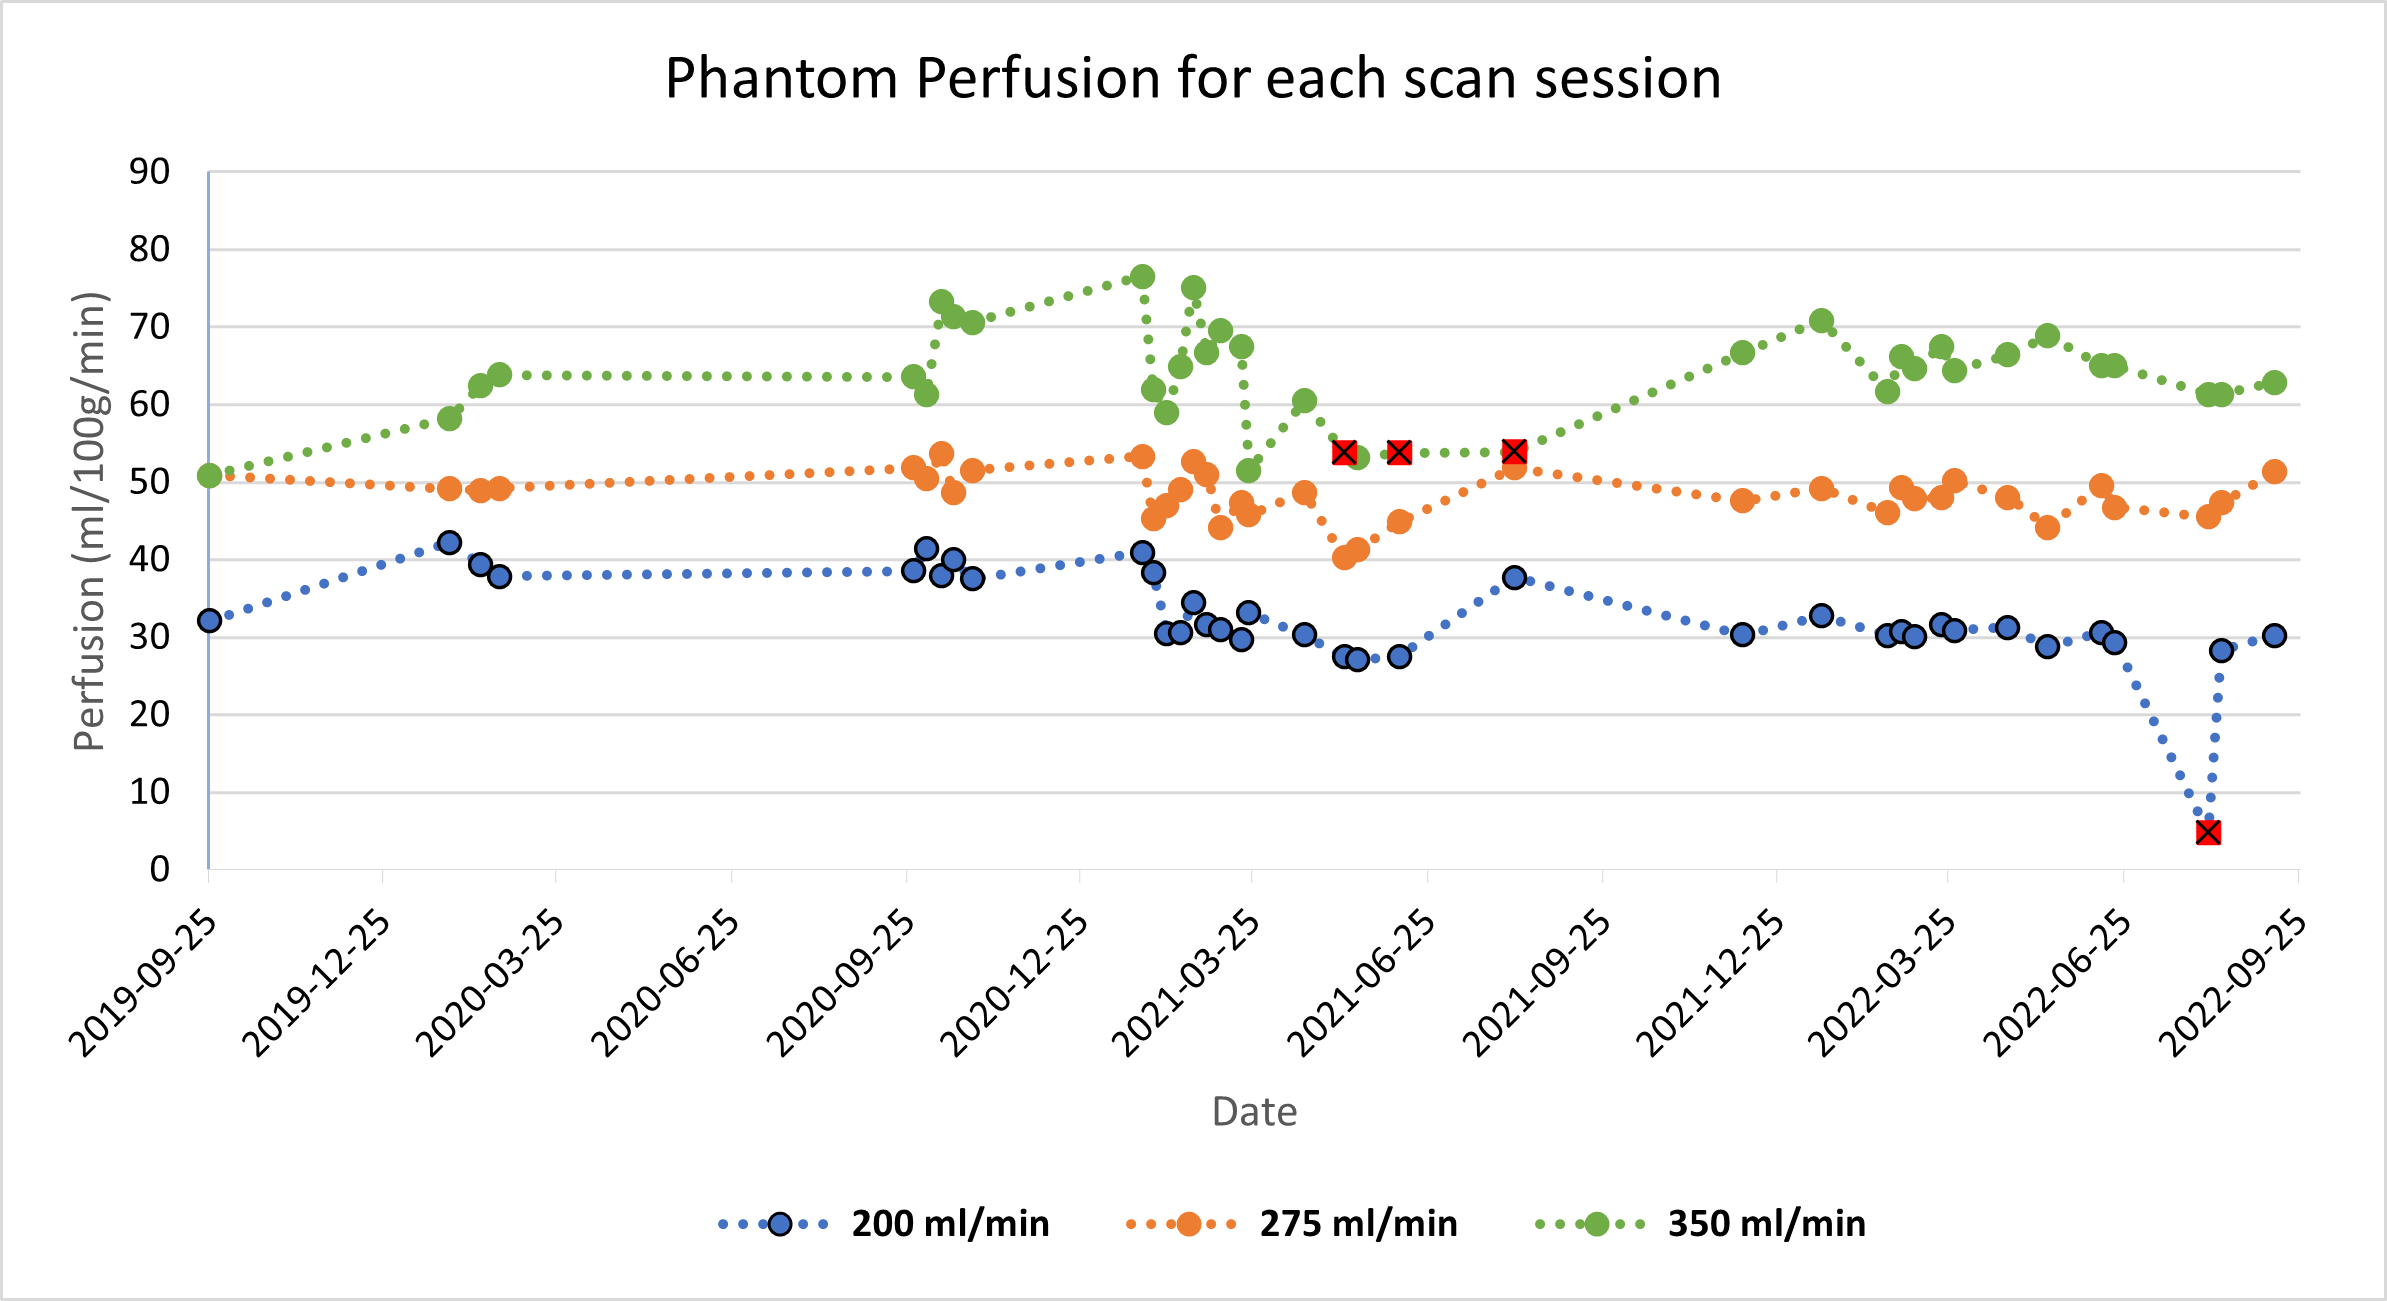
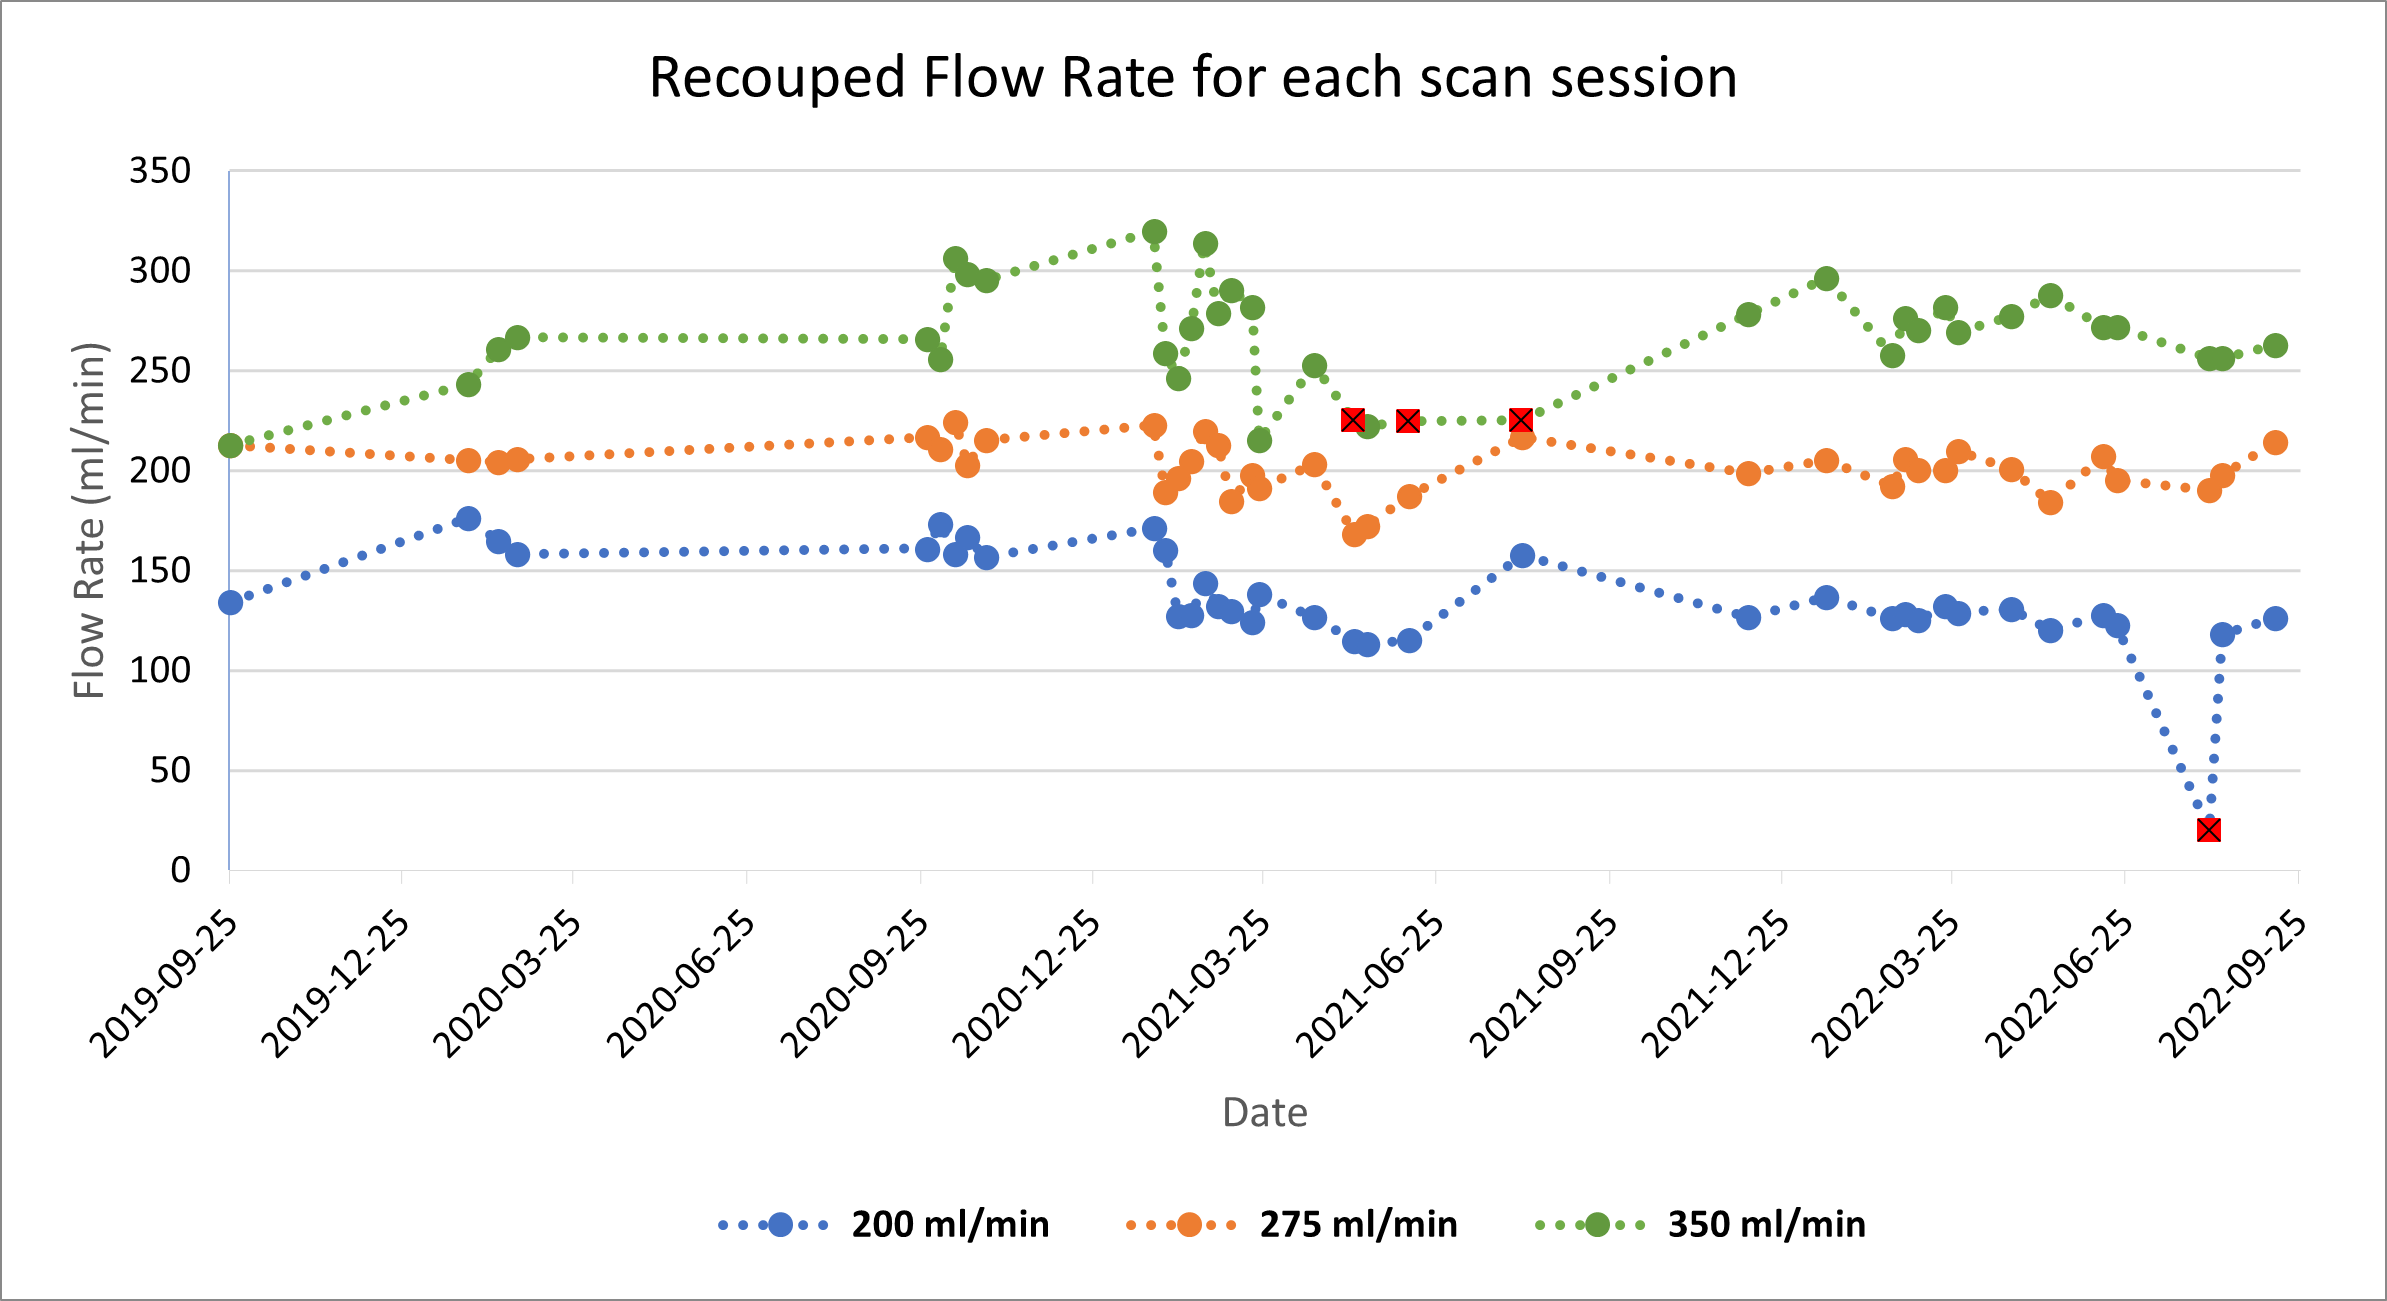
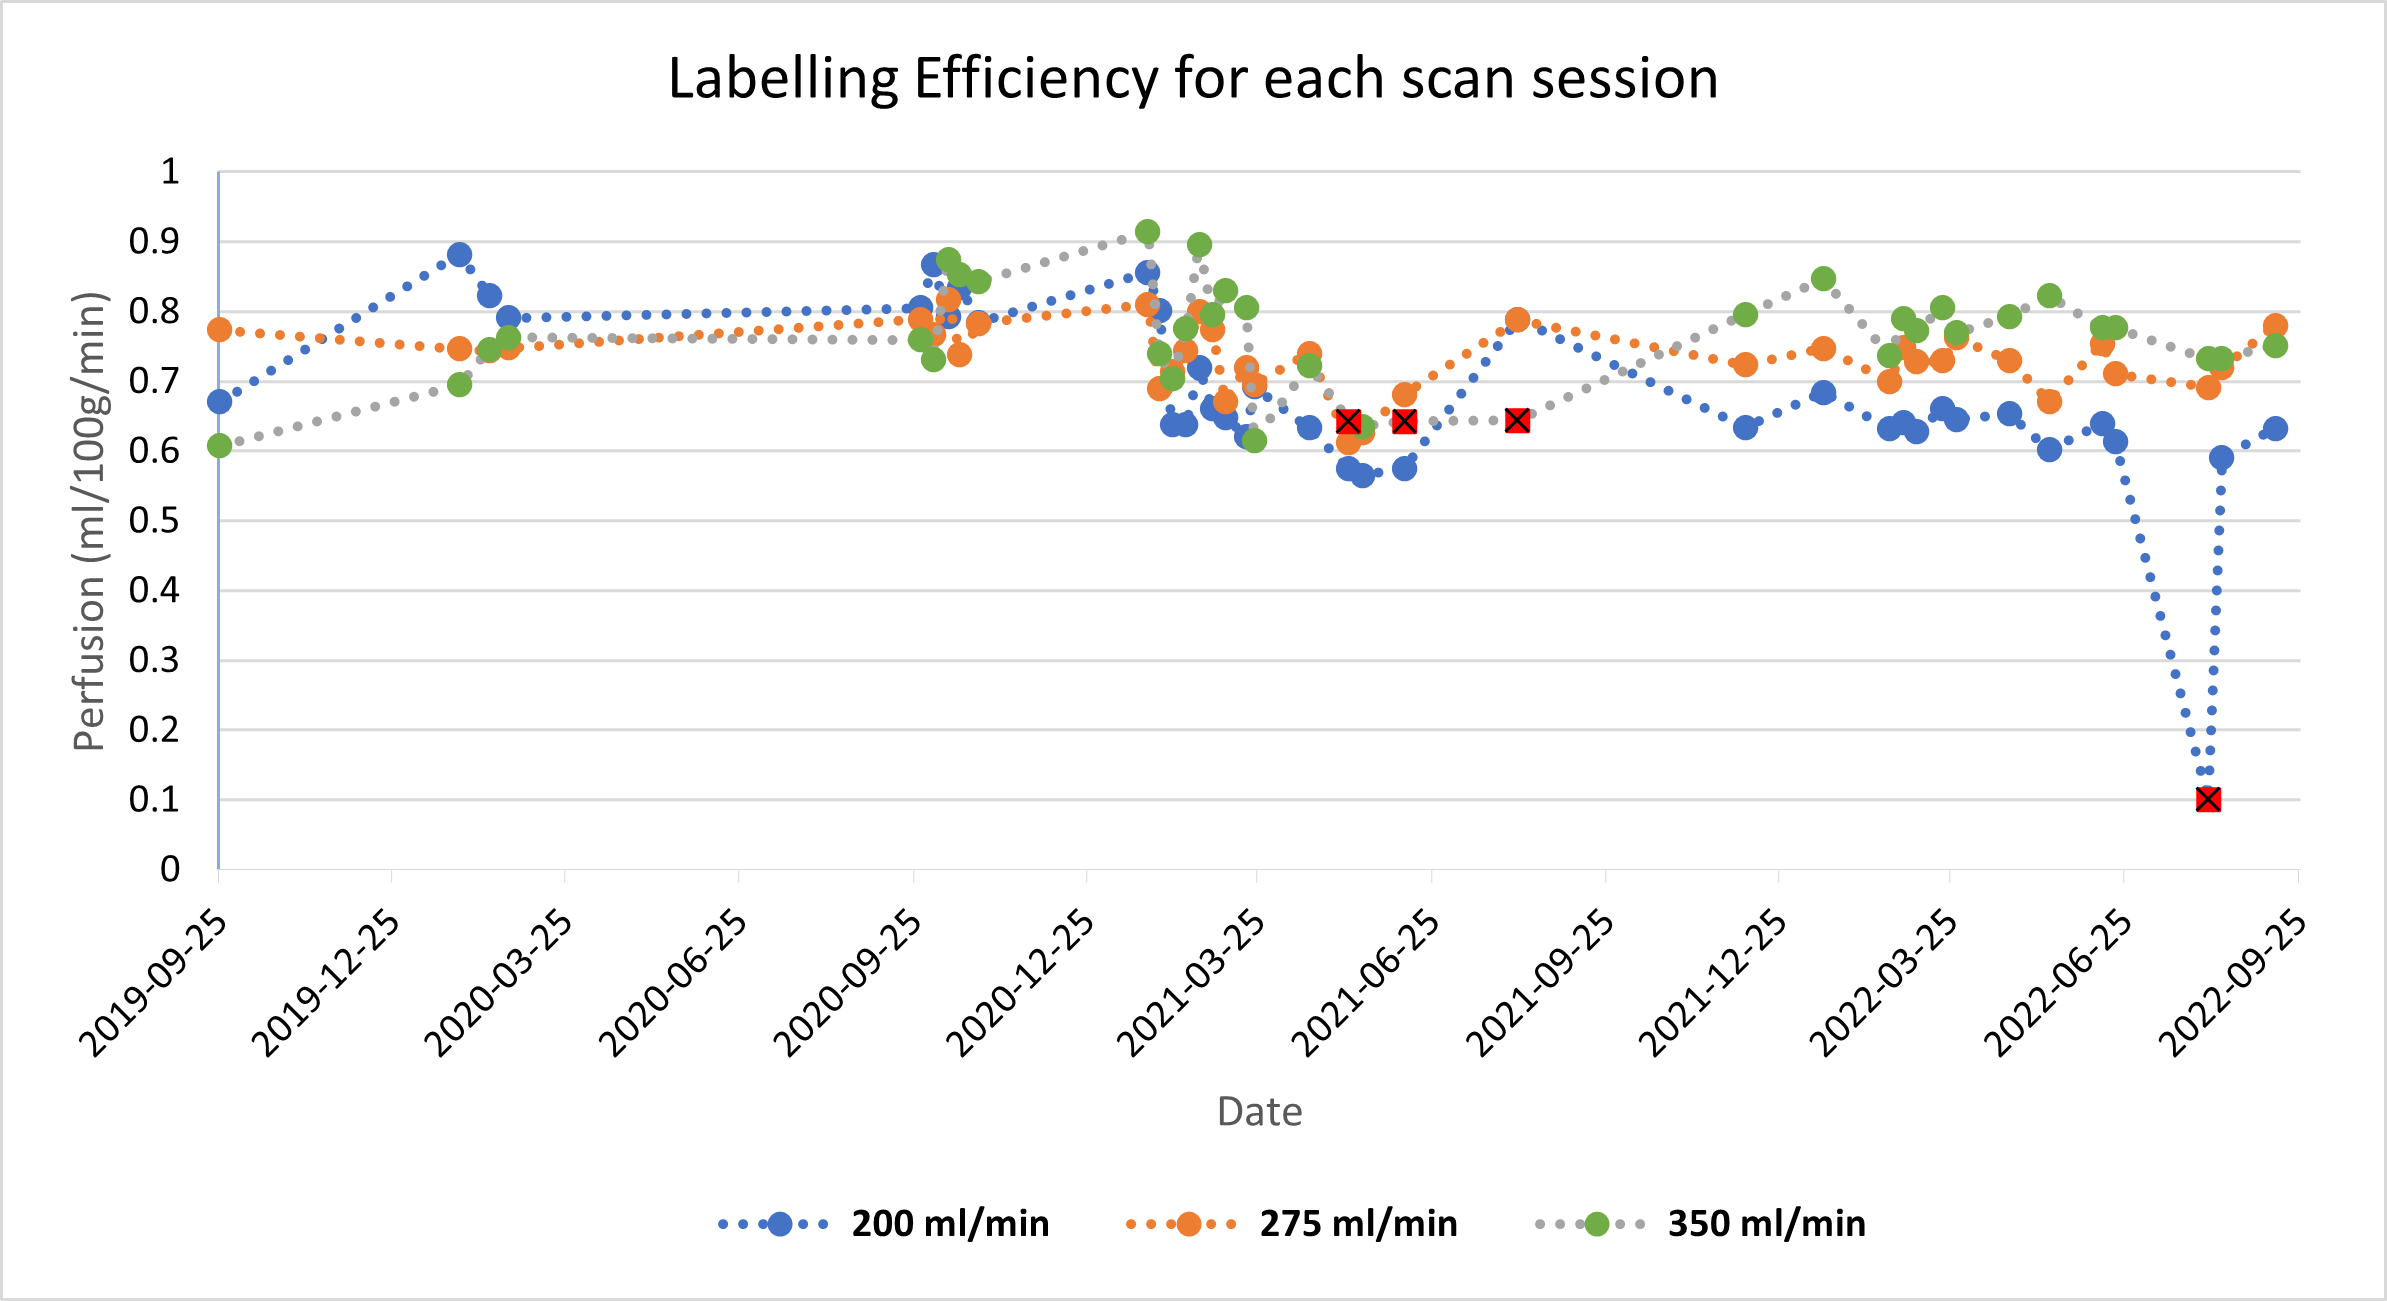
Figure 1 shows examples of the hand-drawn masks for the ASL images (a), and the inversion recovery images (b), along with CBF maps for each of the flow rates. The trend of measured T1 values is shown in Figure 2. Measured perfusion rates for each scan session and flow rate are shown in Figure 3, and the recouped flow rates in Figure 4. Figure 5 shows the calculated labelling efficiency.Discussion
The inclusion of SI traceable materials with known relaxation times[6] that can be scanned along with the perfusion phantom would address whether the 40ms change in T1 was real, or due to MR system changes. Labelling efficiency was calculated using the nominal flow rate, and not the measured flow rate. However, previous studies[2], [7] indicate that under normal operating conditions the actual flow rate of the phantom is very close to the nominal flow rate.Calculation of the CBF maps used the single-subtraction equation, which has been shown to introduce biases compared to the full General Kinetic Model[8], [9]. Values for the calculated labelling efficiency are all 60-80%, lower than the nominal 85% recommended for pCASL[4], however as background suppression pulses have been shown to reduce labelling efficiency[10], these values are not unreasonable. Measurement of the actual labelling efficiency would address the source of the bias between the ASL recouped flow rate and the pump flow rate. Due to its dependence on B1 and B0, labelling efficiency is a subject-specific factor, so it is not possible to use phantom data to calibrate data from the clinical trial. However, in general, the ASL data acquired on the phantom were of good quality, and the values for T1, CBF, and labelling efficiency provide confidence that the MRI system is able to acquire data of sufficient quality.
Conclusion
The aim of this study was to establish the use of a perfusion phantom as a QA tool in a clinical trial using ASL. Inversion recovery T1 measurements were made, and these then used in the calculation of perfusion maps. By calculating the T1 on a per-scan basis, the accuracy of the perfusion measurements was improved, and real-time monitoring of the phantom’s flow rate enabled easy identification of erroneous and confounding data.Acknowledgements
No acknowledgement found.References
[1] A. Oliver-Taylor et al., “A Calibrated Perfusion Phantom for Quality Assurance of Quantitative Arterial Spin Labelling,” in Proc. Intl. Soc. Mag. Reson. Med. 25, Honolulu, Hawaii, United States, Apr. 2017, p. A0681.
[2] A. Oliver-Taylor et al., “A multi-site round robin assessment of ASL using a perfusion phantom,” in Proc. Intl. Soc. Mag. Reson. Med. 27, Montréal, QC, Canada, May 2019, p. A2653. Accessed: Jul. 09, 2021.
[3] M. G. Cox and B. R. L. Siebert, “The use of a Monte Carlo method for evaluating uncertainty and expanded uncertainty,” Metrologia, vol. 43, no. 4, pp. S178–S188, Aug. 2006, doi: 10.1088/0026-1394/43/4/S03.
[4] D. C. Alsop et al., “Recommended implementation of arterial spin-labeled perfusion MRI for clinical applications: A consensus of the ISMRM perfusion study group and the European consortium for ASL in dementia: Recommended Implementation of ASL for Clinical Applications,” Magn. Reson. Med., vol. 73, no. 1, pp. 102–116, Jan. 2015, doi: 10.1002/mrm.25197.
[5] X. Golay, A. Oliver-Taylor, Y. Suzuki, and M. Chappell, “How to quantify ASL values in a perfusion phantom,” in ESMRMB 2019 Congress, Rotterdam, Netherlands, Oct. 2019, p. A1672. doi: https://doi.org/10.1007/s10334-019-00754-2.
[6] K. E. Keenan et al., “Quantitative magnetic resonance imaging phantoms: A review and the need for a system phantom,” Magn. Reson. Med., vol. 79, no. 1, pp. 48–61, Jan. 2018, doi: 10.1002/mrm.26982.
[7] A. Oliver-Taylor and X. Golay, “A vortical phantom for ASL perfusion MRI,” in Proc. Intl. Soc. Mag. Reson. Med. 30, 2022.
[8] R. B. Buxton, L. R. Frank, E. C. Wong, B. Siewert, S. Warach, and R. R. Edelman, “A general kinetic model for quantitative perfusion imaging with arterial spin labeling,” Magn. Reson. Med., vol. 40, no. 3, pp. 383–396, Sep. 1998, doi: 10.1002/mrm.1910400308.
[9] A. Oliver-Taylor et al., “ASLDRO: Digital reference object software for Arterial Spin Labelling,” in Proc. Intl. Soc. Mag. Reson. Med. 29, 2021.
[10] D. M. Garcia, G. Duhamel, and D. C. Alsop, “Efficiency of inversion pulses for background suppressed arterial spin labeling,” Magn. Reson. Med., vol. 54, no. 2, pp. 366–372, Aug. 2005, doi: 10.1002/mrm.20556.
Figures