4881
Caffeine reduces cerebrovascular reactivity in addition to lowering basal perfusion1Russell H Morgan Department of Radiology and Radiological Sciences, Johns Hopkins University School of Medicine, Baltimore, MD, United States, 2Department of Biomedical Engineering, Johns Hopkins University, Baltimore, MD, United States, 3Johns Hopkins University School of Medicine, Baltimore, MD, United States, 4Department of Diagnostic Radiology and Nuclear Medicine, University of Maryland School of Medicine, Baltimore, MD, United States, 5Department of Neurology, Johns Hopkins University School of Medicine, Baltimore, MD, United States, 6F. M. Kirby Research Center for Functional Brain Imaging, Kennedy Krieger Research Institute, Baltimore, MD, United States
Synopsis
Keywords: Perfusion, Velocity & Flow, Cerebrovascular reactivity
Motivation: Caffeine, one of the widely used psychoactive substances is known to reduce basal cerebral blood flow (CBF). However, its effect on vasodilatory capacity has not been characterized
Goal(s): To evaluate the impact of Caffein on cerebrovascular reactivity (CVR)
Approach: 8 healthy caffeine-naïve volunteers were scanned for baseline (pre-caffeine) and post-Caffeine CVR measurements using BOLD MRI and phase-contrast MRI (PC)-MRI during normal air breathing and hypercapnia using 5% CO2 enriched gas mixture
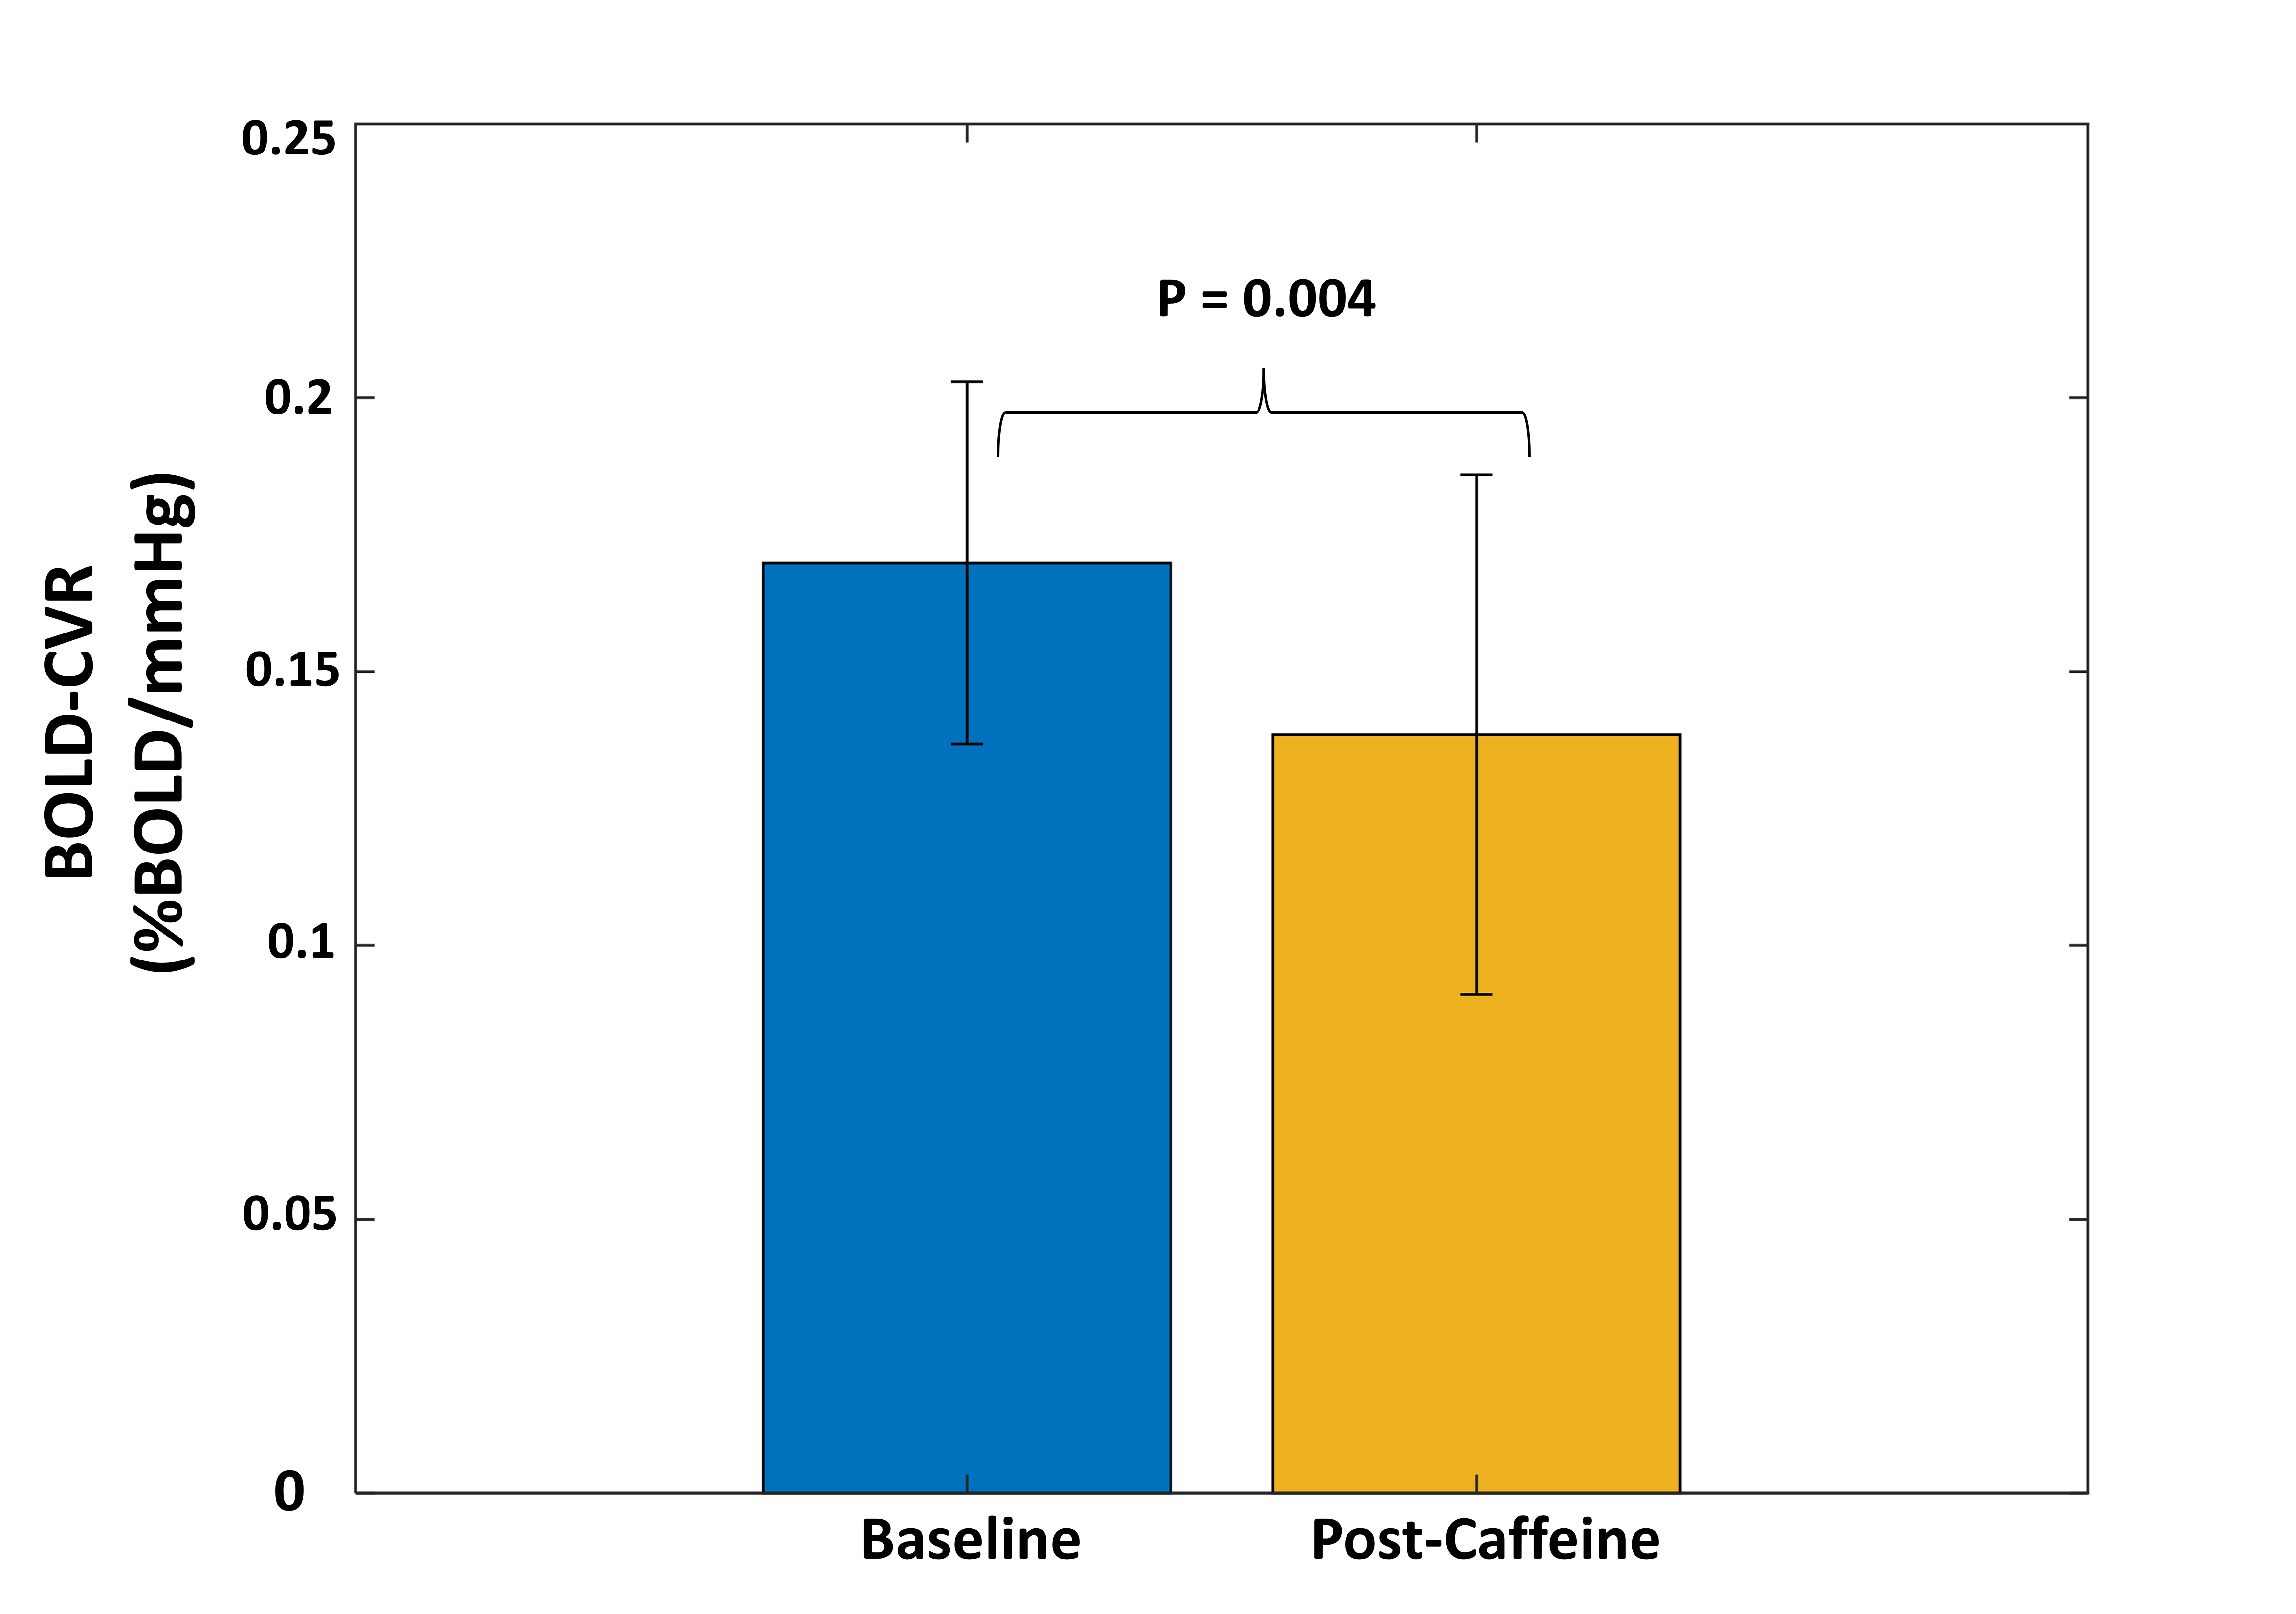
Results: There was a significant reduction in blood-flux (BF) during room-air (p=0.002) and hypercapnia (p=0.0015) post caffeine administration (variation=33.7% and 41.3% respectively). PC-CVR and BOLD-CVR were reduced by 32.7%(p=0.006) and 22.5%(p=0.006) respectively
Impact: This study's findings provide valuable insights into the impact of caffeine on cerebrovascular reactivity (CVR), revealing a significant reduction after caffeine intake. Findings would be beneficial in reducing the inter-subject variability of CVR by improving the sensitivity in detecting abnormalities.
Introduction
Cerebrovascular reactivity (CVR) denotes the ability of cerebral vessels to dilate or constrict in response to vasoactive challenges such as hypercapnia1. CVR MRI has shown great potentials as a diagnostic biomarker in both large-vessel (e.g., stroke, arterial stenosis, Moyamoya) and small-vessel (e.g., vascular dementia) diseases2. However, a remaining issue clouding CVR in clinical applications is its inter-subject variations, which can reduce the sensitivity in detecting abnormalities. Caffeine, likely consumed by some participants before receiving an MRI, is known to reduce basal cerebral blood flow (CBF). However, its effect on vasodilatory capacity has not been characterized. One hypothesis is that CVR will increase following the intake of caffeine, as a reduced basal CBF will allow more room for the blood vessels to dilate. An alternative hypothesis is that CVR will decrease if the caffeine and CO2’s vasoactive effects share the same molecular pathway. The present work aims to test these opposing hypotheses.Methods
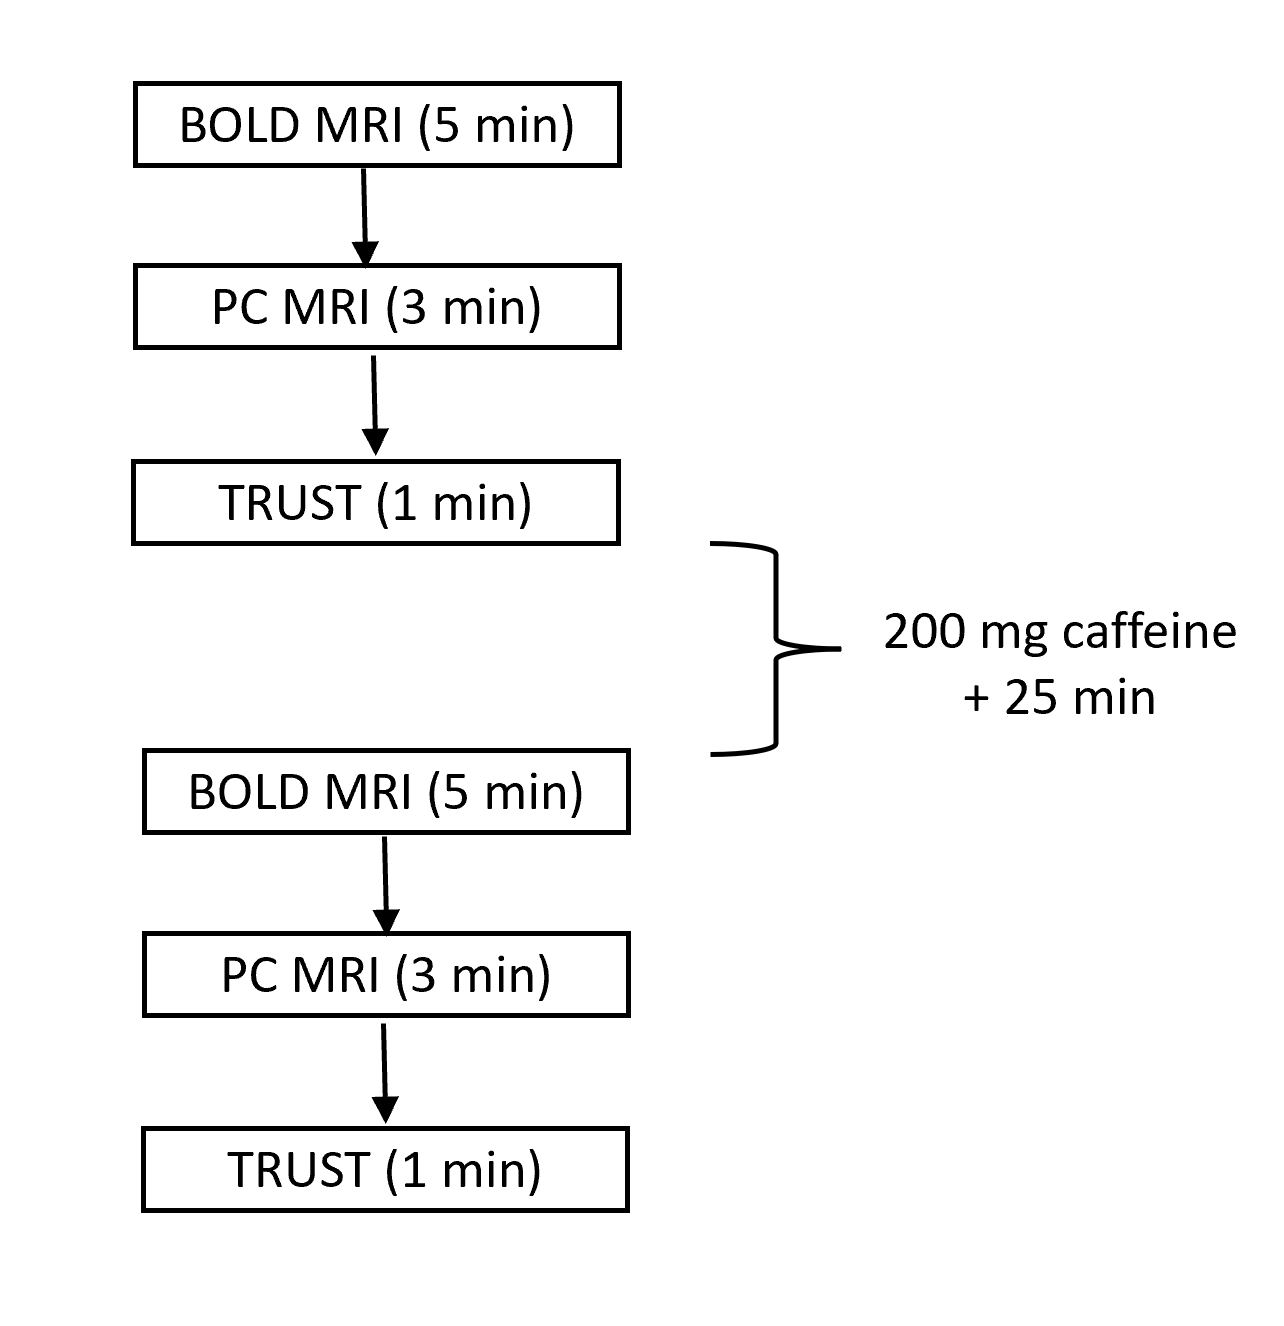
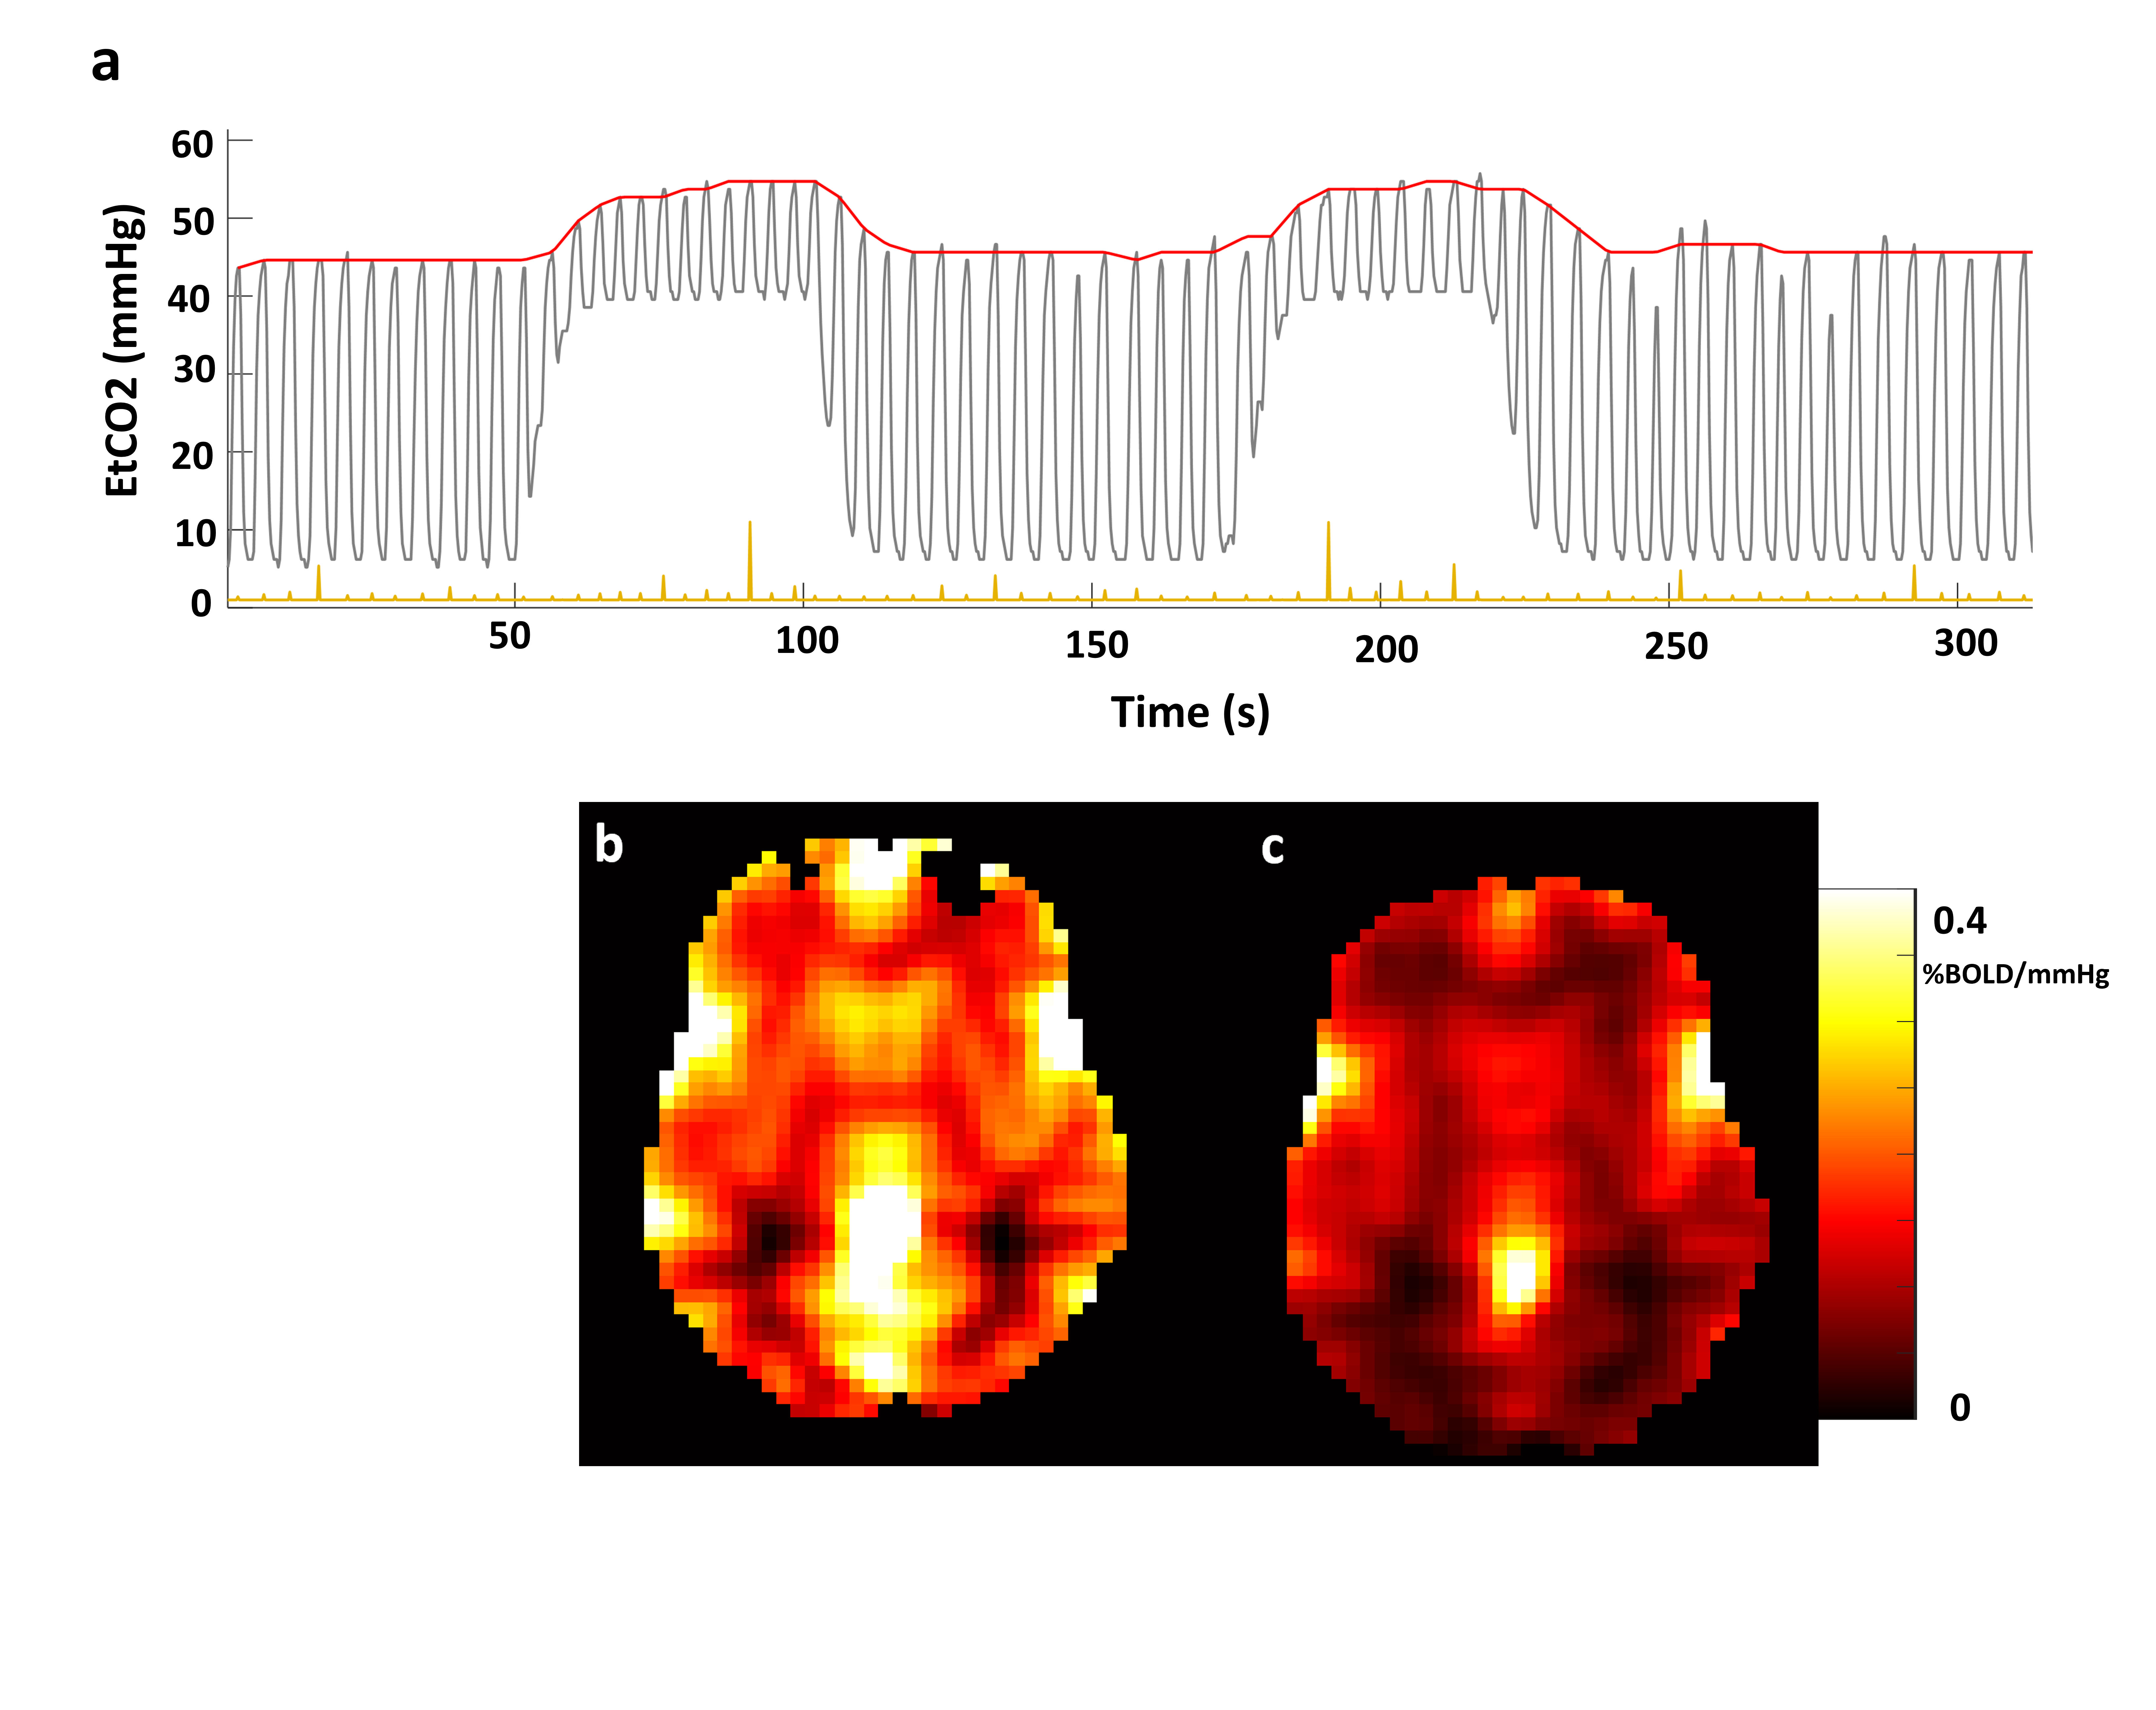
Subjects: 8 healthy caffeine-naïve volunteers with a mean age 27.7±3.9 (4 male and 4 female) were scanned on Philips Ingenia 3T system using a 32 channel receiver head coil.Experimental procedure: The study design is illustrated in Figure 1. It consisted of a baseline (pre-caffeine) CVR measurement using BOLD MRI and phase-contrast MRI (PC-MRI)3 (to measure global change in blood flux, BF (in ml/min)) during normal air breathing and hypercapnia using 5% CO2 enriched gas mixture (5% CO2, 21% O2, 74% N2). A T2-Relaxation-Under-spin-Tagging (TRUST)4 scan was also performed to confirm the effect of caffeine on basal venous oxygenation (Yv). Then, a 200 mg caffeine tablet (equivalent to 2 cups of coffee) was orally administered to the subjects followed by a break for 25 minutes, and repeated CVR and TRUST measurements were performed. The detailed setup for hypercapnia experiment is described elsewhere3. The 5 min BOLD MRI acquisition consisted of 2 hypercapnic phases with 55s each followed by room air for 75s. The MRI parameters for BOLD MRI were voxel-size = 3.43×3.43×3.8 mm, TR/TE = 1500/30 ms, dynamics = 200, scan duration = 3000s. PC-MRI were acquired using field-of-view (FOV) = 240×240 mm2, matrix size = 400×400, thickness = 5mm, TR/TE = 18.7/9.1 ms and scan duration =62 s. TRUST sequence was acquired and processed using previously published protocol5. Data analysis: BOLD-CVR(%BOLD/mmHg) and PC-CVR (%BF/mmHg) analysis were performed as previously reported5,6. To compute BF from PC-MRI, region-of-interest was manually drawn on complex difference images, and the total flux was computed from the velocity maps. Relative percentage variation (RPV) and a paired t-test with 2-tail distribution was used as statistical measures to evaluate the results.
Results
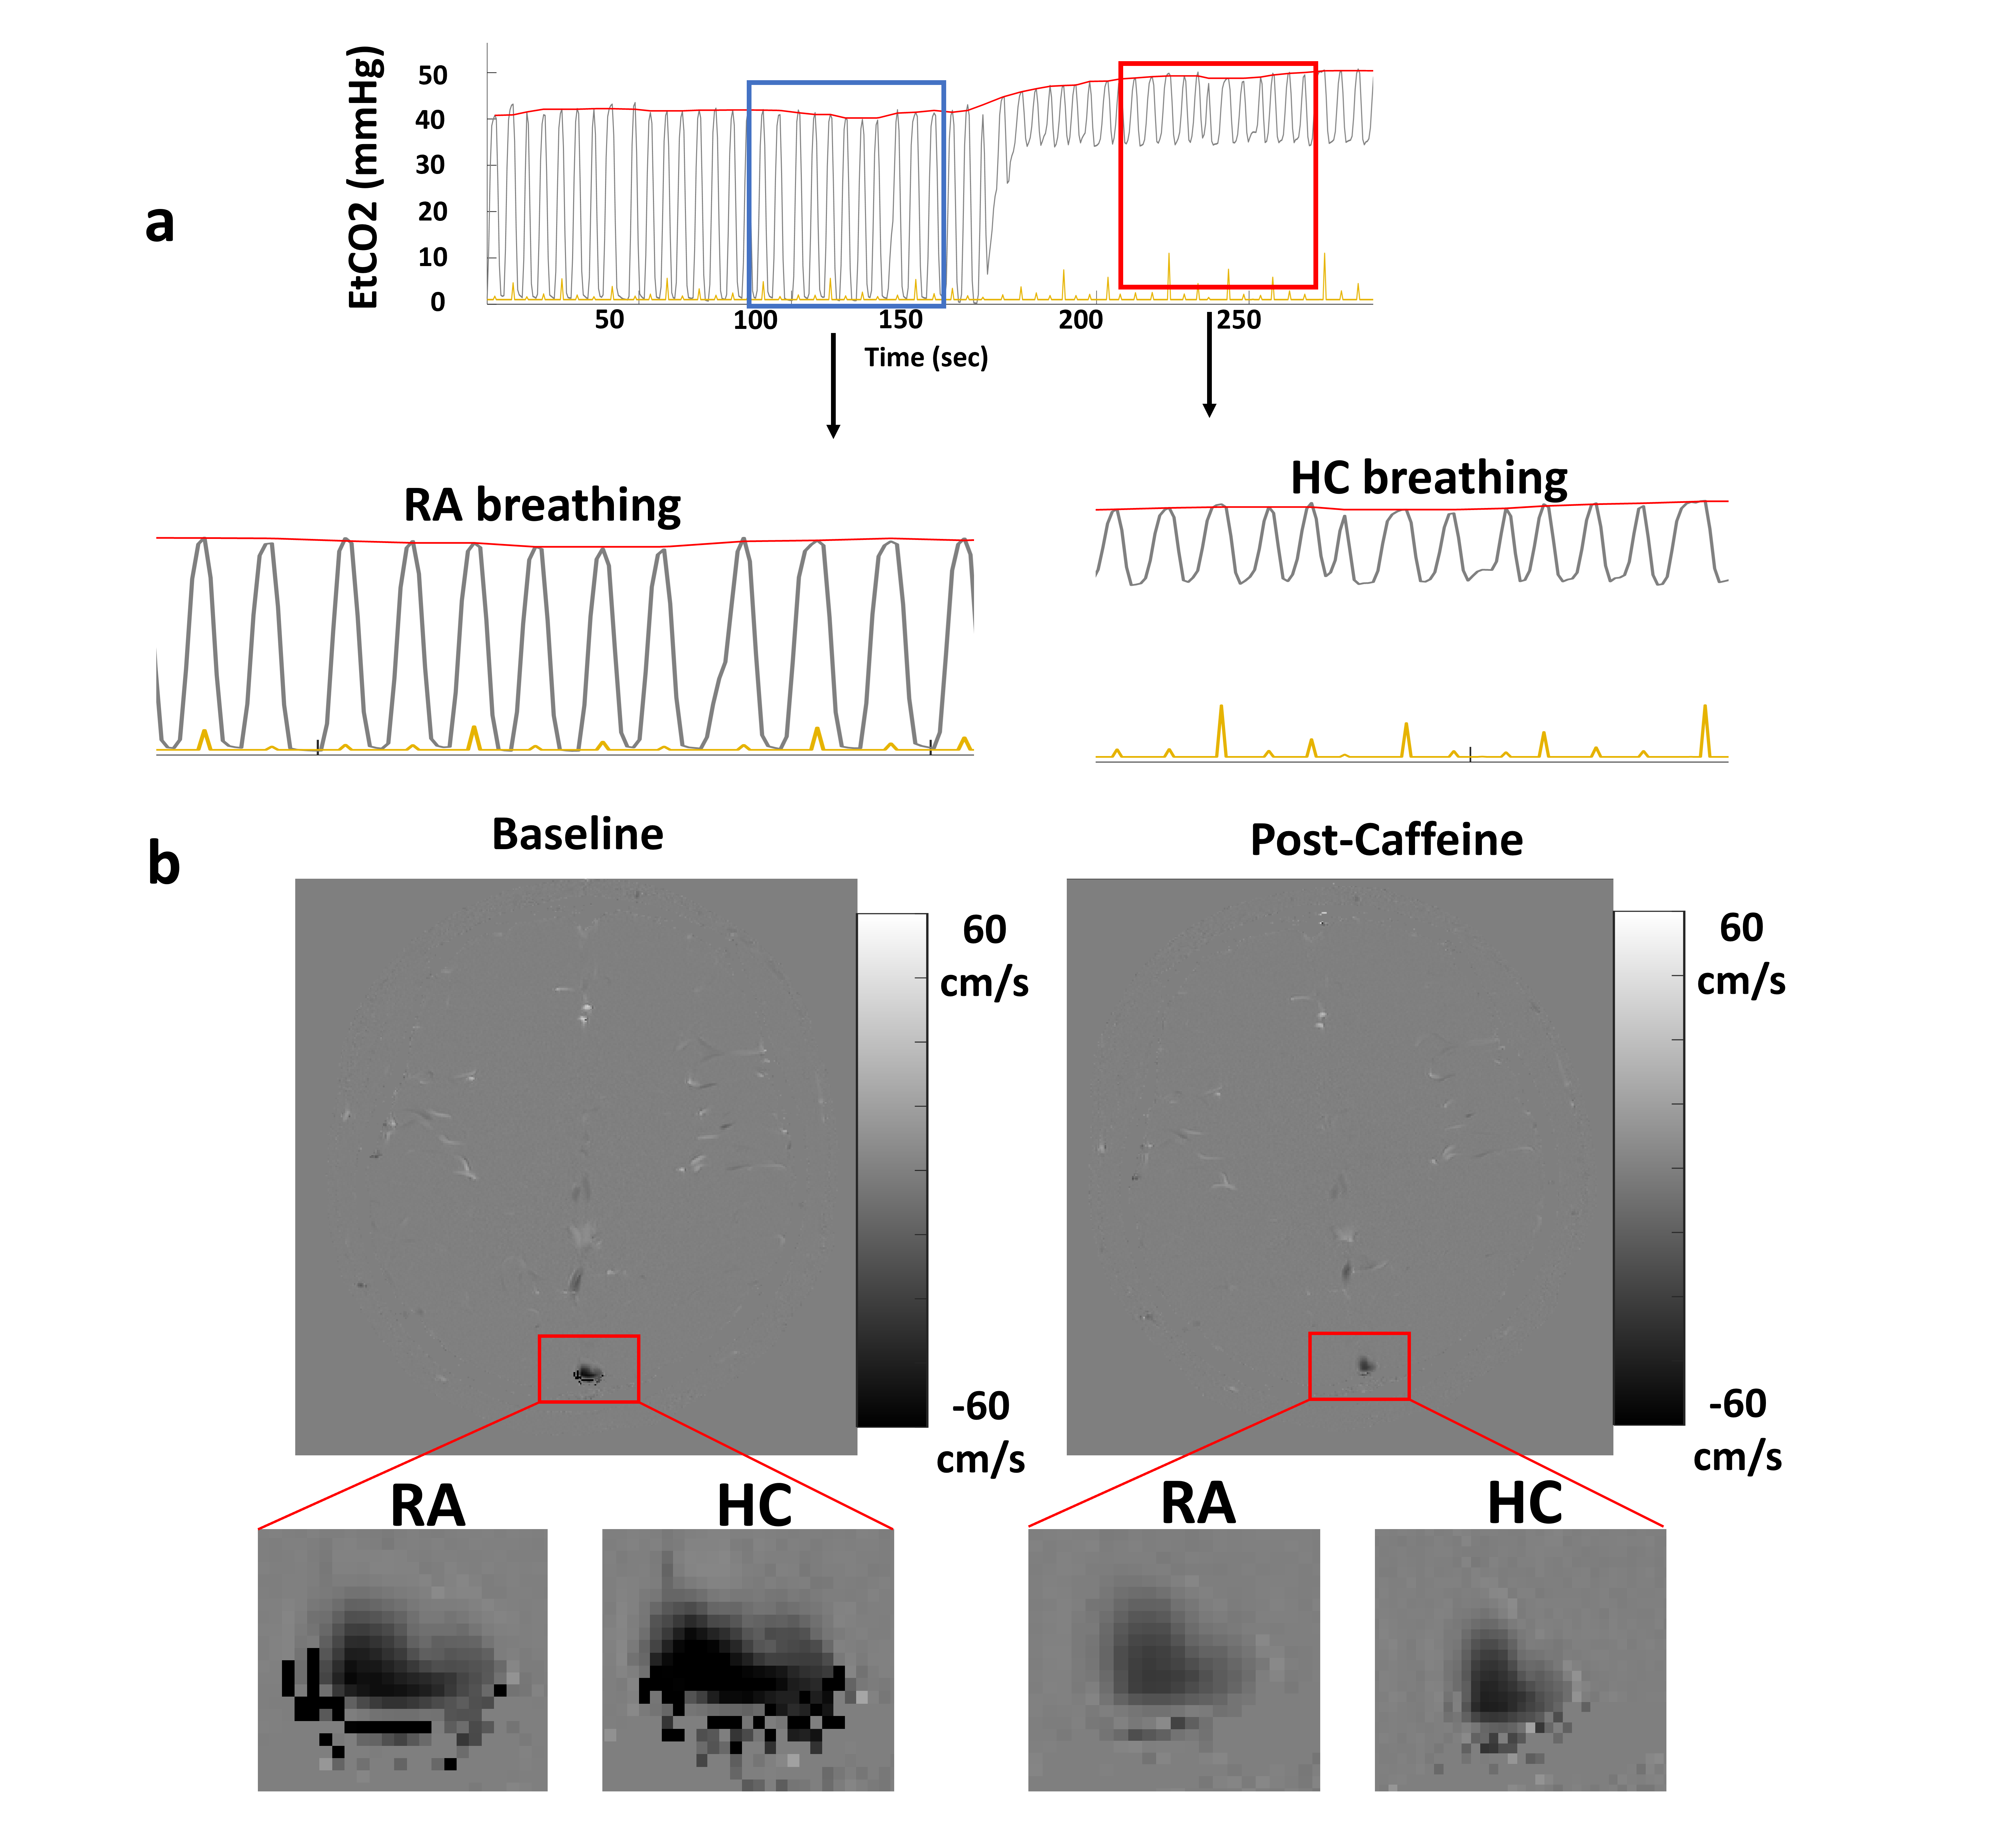
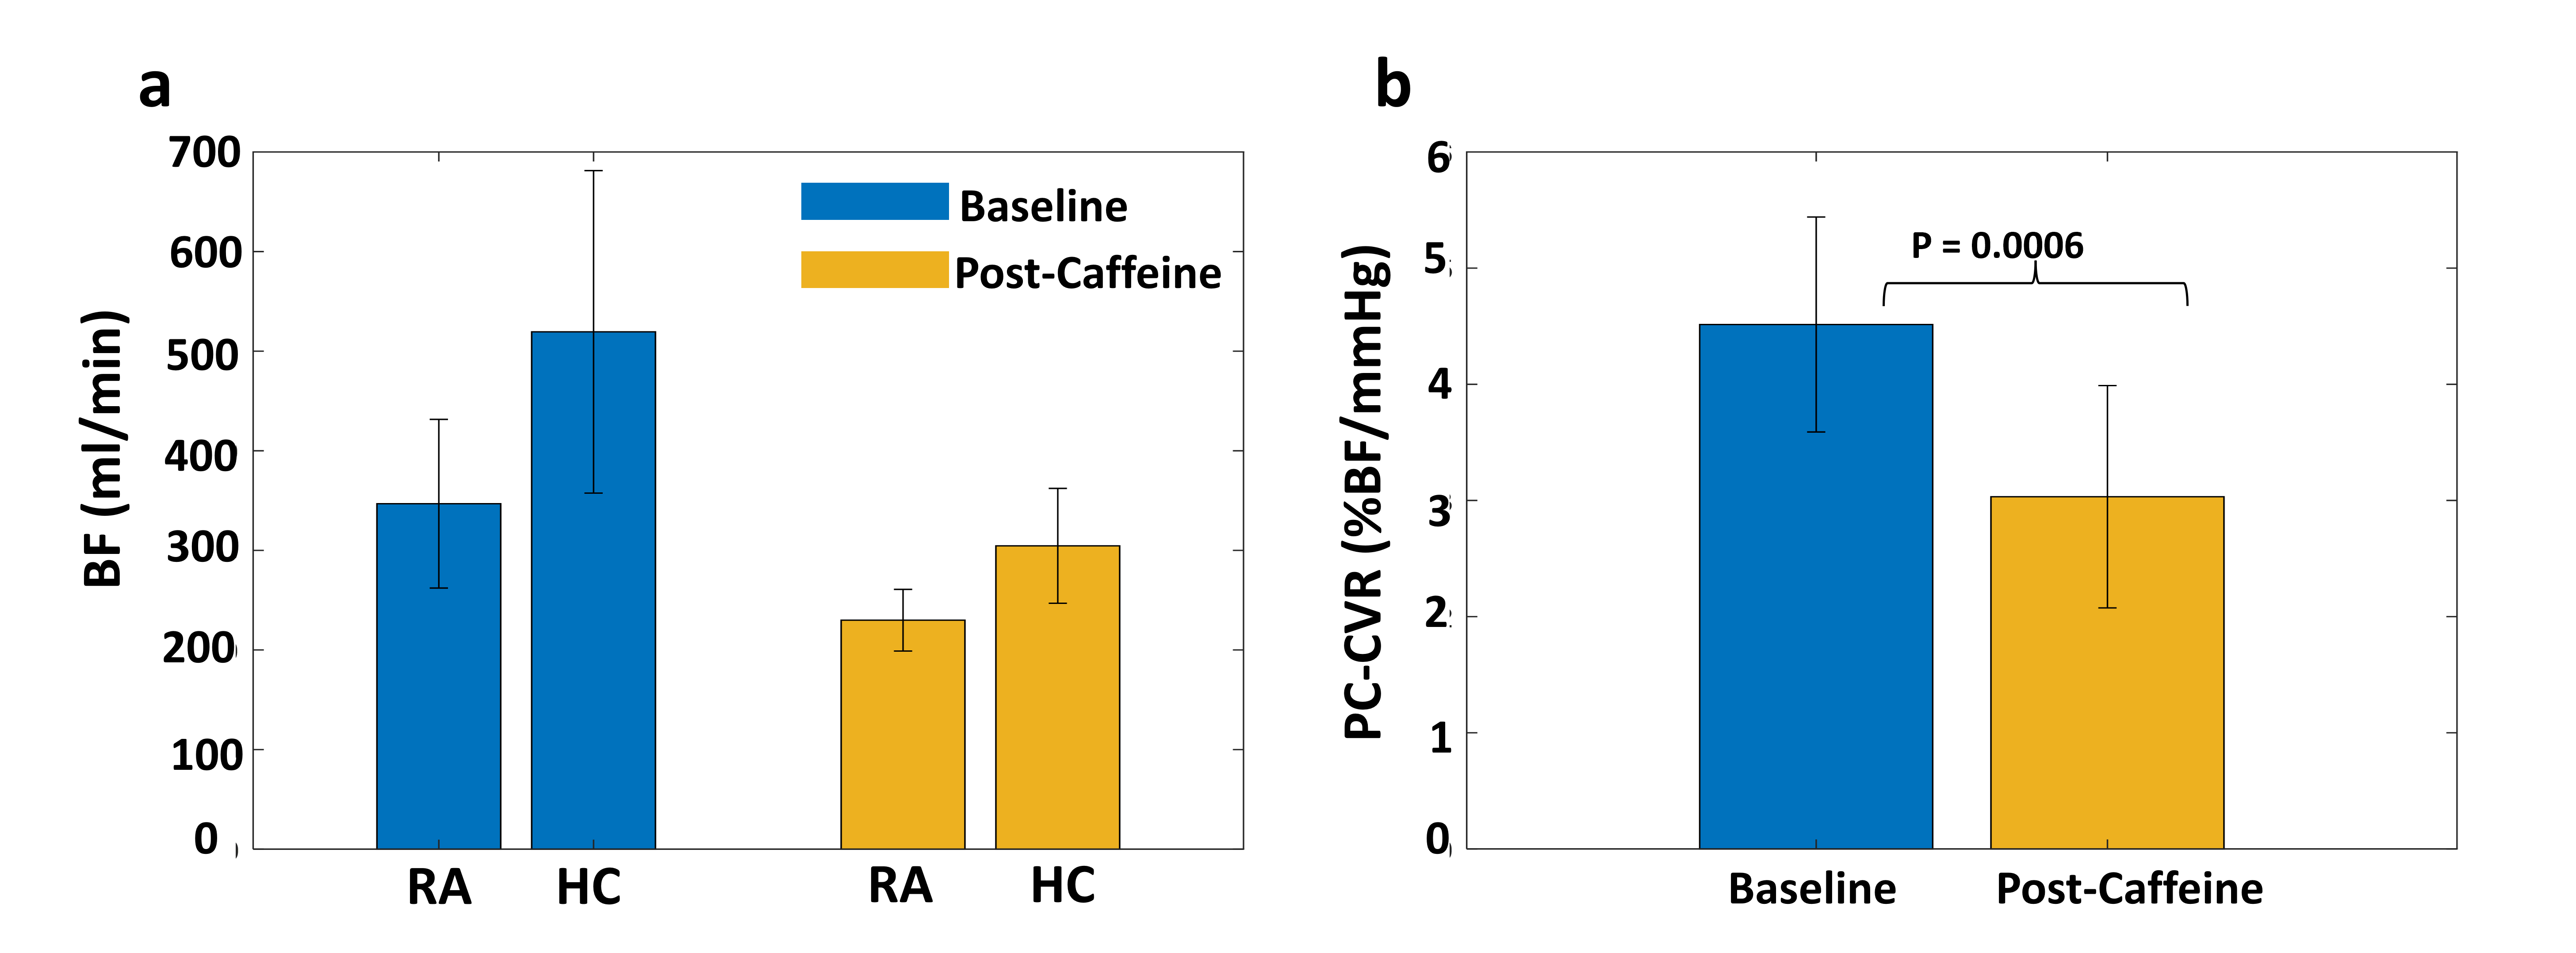
Figure 2 shows the EtCO2 curve (a) and a representative data set of velocity maps (b) acquired during room air (RA) and hypercapnia (HC) state before and after caffeine administration. Figure 3a summarizes the quantitative BF values under these four physiological states, i.e. no caffeine/no CO2, no caffeine/inhaling CO2, after caffeine/no CO2, after caffeine/inhalation CO2. There was a significant reduction in BF during RA (p=0.002) and HC (p=0.0015) post caffeine administration (RPV = 33.7 and 41.3% respectively). PC-CVR was reduced by 32.7% (p=0.006) (Figure 3b). Whole-brain Yv was also reduced, by 22.8% with p=0.0012. Figure 4 shows a representative EtCO2 curve and corresponding BOLD-CVR maps of pre- and post-caffeine acquisition. Similar to the measurements of PC-CVR, BOLD-CVR was reduced post-caffeine administration (RPV=22.5%, p=0.005) as shown in Figure 5.Discussion
Caffeine is known for its ability to cause vasoconstriction by binding to A2A adenosine receptors. However, its effect on CVR is unknown. So, the current study was designed to investigate the impact of caffeine on CVR using PC-MRI and BOLD-MRI. The reason that we used PC in addition to BOLD MRI is that BOLD signal is known to be affected by baseline venous oxygenation; thus the PC MRI can serve as an additional validation step despite not having spatial information. The results of the study suggest that CVR significantly reduced after Caffeine administration. Adenosine receptors in the brain can stimulate the production of NO by activating endothelial NOS, leading to increase NO production and subsequent vasodilation. Additionally, the release of adenosine can enhance the sensitivity of smooth muscle cells to NO, amplifying the vasodilatory effects of NO in the blood vessels. Therefore, it is plausible that, once caffeine binds to these receptors, it will block the NOS signaling pathways, hence reducing both basal perfusion and CVR.Conclusion
Caffeine's impact CVR was investigated, revealing a significant reduction in CVR following administration, despite its known vasoconstrictive effect through adenosine receptors.Acknowledgements
The authors acknowledge NIH grants R01 NS106711, R01 NS106702, R01 AG064792, RF1 AG071515, U01 NS100588, and R01 NS115771.References
1.Yezhuvath, U. S., Lewis-Amezcua, K., Varghese, R., Xiao, G. & Lu, H. On the assessment of cerebrovascular reactivity using hypercapnia BOLD MRI. NMR Biomed 22, 779–786 (2009).
2.Sur, S. et al. Association of cerebrovascular reactivity and Alzheimer pathologic markers with cognitive performance. Neurology 95, E962–E972 (2020).
3.Taneja, K. et al. Quantitative Cerebrovascular Reactivity in Normal Aging: Comparison Between Phase-Contrast and Arterial Spin Labeling MRI. Front Neurol 11, (2020).
4.Jiang, D. et al. Cross-vendor harmonization of T2-relaxation-under-spin-tagging (TRUST) MRI for the assessment of cerebral venous oxygenation. Magn Reson Med 80, 1125–1131 (2018).
5.Lu, H. et al. MRI mapping of cerebrovascular reactivity via gas inhalation challenges. Journal of Visualized Experiments (2014) doi:10.3791/52306.
6.Sur, S. et al. CO2 cerebrovascular reactivity measured with phase‐contrast MRI: A potential biomarker of cognition and physical function in older adults. Alzheimer’s & Dementia 16, (2020).
Figures