4875
Reproducibility assessment of multiparametric non-contrast cardiac MRI including ASL, T1 and T2 mapping in healthy controls1Department of Radiology, Clinica Universidad de Navarra, Pamplona, Spain, 2IdiSNA, Instituto de Investigación Sanitaria de Navarra, Pamplona, Spain, 3Siemens Healthcare, Madrid, Spain, 4Department of Cardiology, Clinica Universidad de Navarra, Pamplona, Spain
Synopsis
Keywords: Arterial Spin Labelling, Arterial spin labelling, Perfusion, Myocardium, T1 Mapping, T2 Mapping, Reproducibility
Motivation: Contrast-agent free techniques are needed in cardiac MRI studies for assessment of patients with coronary artery disease but with contraindications to gadolinium contrast-agents, such as kidney disease.
Goal(s): The aim of this work was to assess the intra and intersession reproducibility of a multiparametric protocol including three non-contrast techniques (ASL, native T1 and T2 mapping) in healthy controls with a wide age range to eventually test the technique in clinical patients.
Approach: Multiparametric non-contrast cardiac MRI in ten healthy controls at 1.5T.
Results: This protocol can offer contrast free alternative for perfusion quantification, T1 and T2 mapping, with good intra and intersession reproducibility.
Impact: Multiparametric cardiac MRI with arterial spin labelling (ASL) perfusion, T1 and T2 mapping could offer a contrast-agent free alternative for patients with kidney disease, or other contraindication to gadolinium agents, with good intra and intersession reproducibility.
Introduction
Measuring myocardial perfusion under stress condition is clinically useful for detecting potential areas of ischemia and necrosis in patients with suspected coronary artery disease.1Ordinary clinical protocols for measuring perfusion and characterizing the tissue employ contrast-agents, however, their use is limited in patients with kidney disease. Arterial spin labeling (ASL) allows quantitative measurement of myocardial blood flow (MBF, ml/g/min) using arterial blood water as an endogenous tracer2, and has been previously used in the heart.3
Native T1 mapping has been used to characterize the myocardial tissue, because variations in its water content may increase the T1, such as in myocardial fibrosis.4 Native T2 mapping is used to detect myocardial edema related to acute myocardial infarction, since increased myocardial water content will elevate the T2 and may be a sign of myocardial injury.5
The aim of this work was to assess the intra and intersession reproducibility (within-subject across time) of the three cardiac techniques in healthy volunteers within a wide age range.
Methods
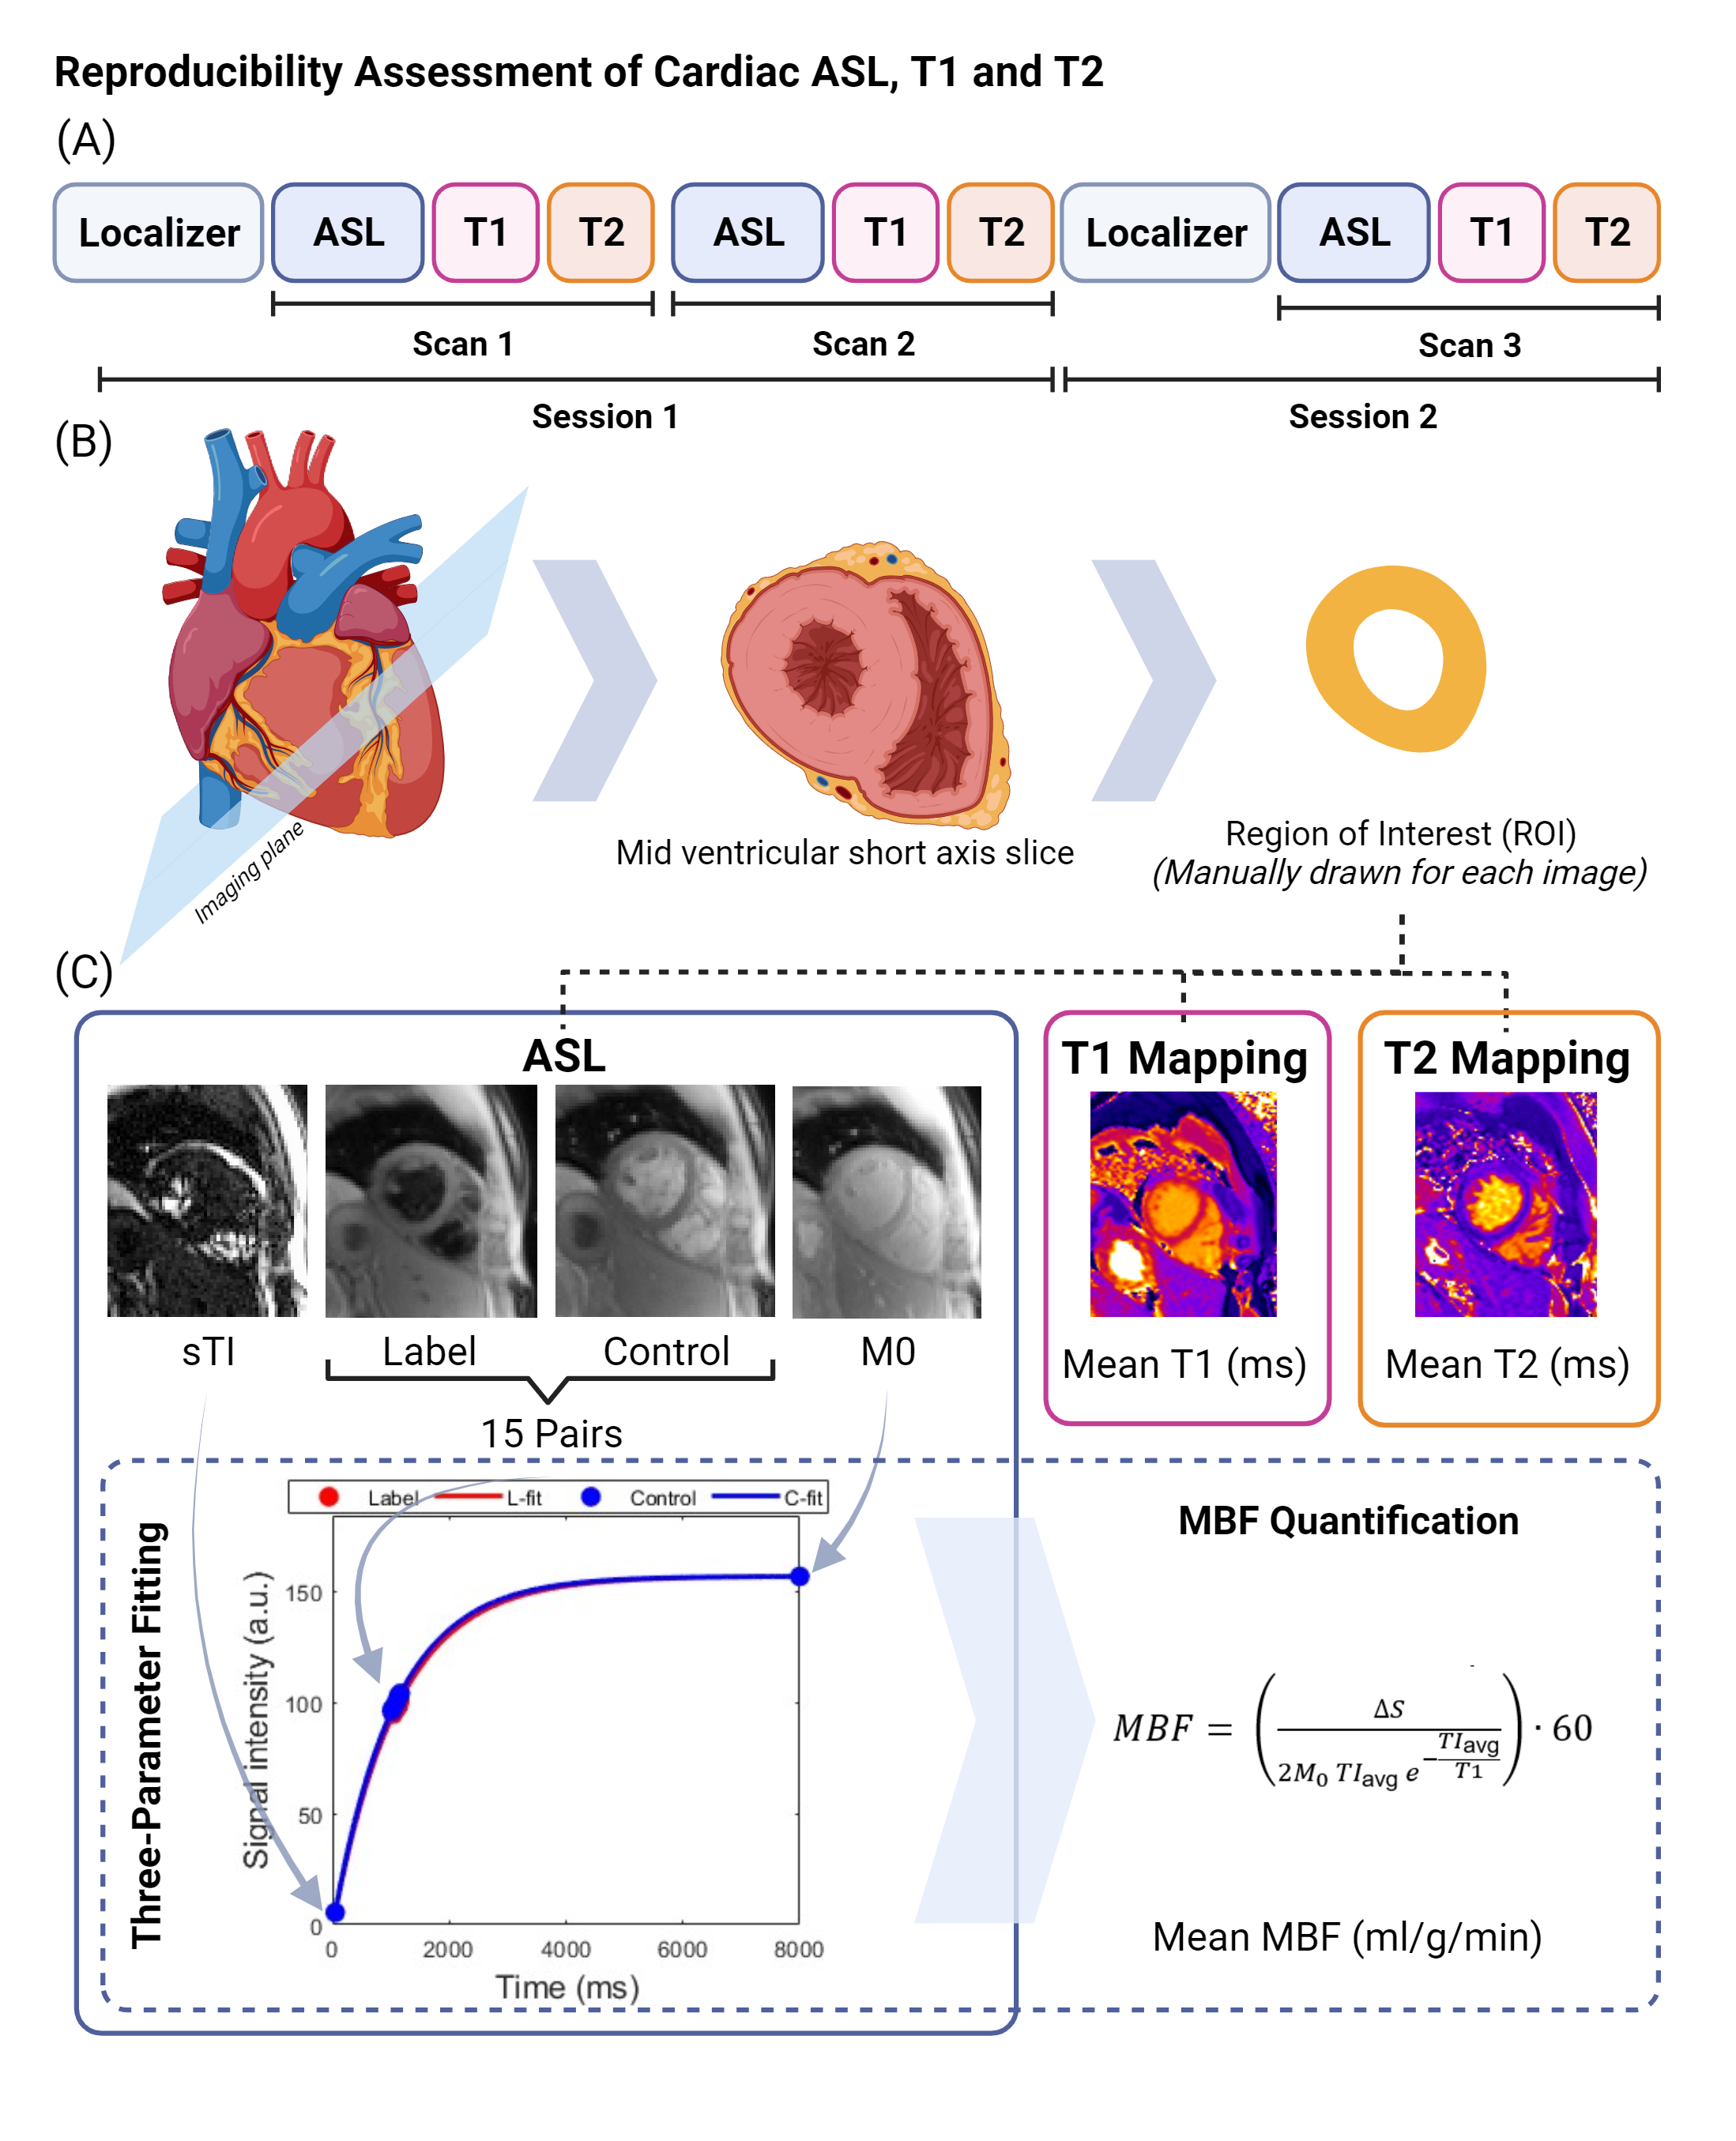
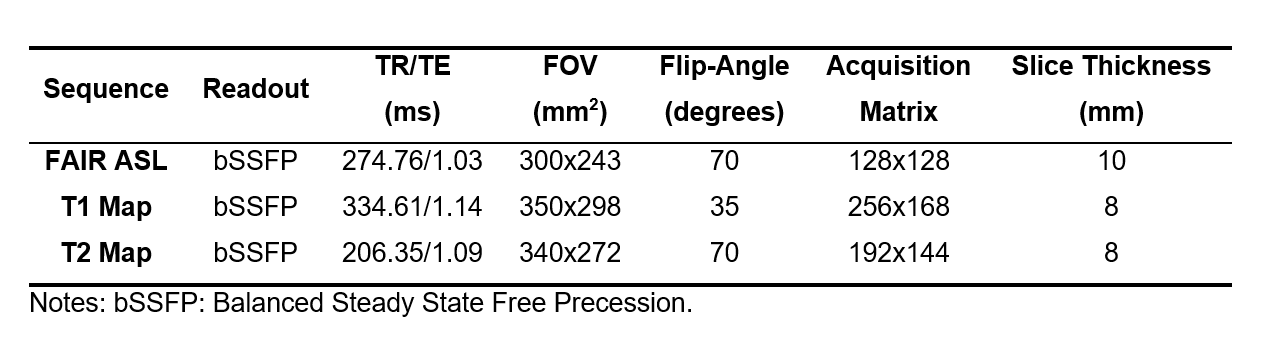
Written informed consent was obtained from volunteers. A total of ten healthy volunteers (3 women, mean age (years): 42, standard deviation: 14, range: 25-63) underwent two cardiac MRI examinations at 1.5T scanner (Siemens Healthineers) with an 18-channel body and 32-channel spine coil. The MRI protocol consisted of localizers, followed by: (a)FAIR ASL, (b)MOLLI T1 mapping and (c)bSSFP T2 mapping, acquired in one mid left ventricular short axis slice. Two sets of images were acquired in the same session (Scan 1 and Scan 2) (n=10), and another set of images (Scan 3) was acquired in the 10 days (±5 days) after the first session (n=8). All images were reviewed by an experienced radiologist. Imaging protocol and processing is depicted in Figure 1. Other protocol details: (a)FAIR ASL sequence synchronized in diastole using double-ECG triggering with variable inversion time, four presaturation pulses, alternating non-selective/slice-selective inversion hyperbolic-secant adiabatic pulses and bSSFP readout. A total of 15 pairs of label/control images were acquired. Additionally, a control/label short TI (116ms) and a baseline (8000ms) images (M0) were acquired. Synchronize breathing was used to minimize motion. (b)T1 mapping acquired in apnea with MOLLI-5(3)3 scheme; (c)T2 mapping with adiabatic preparations: 0ms, 25ms and 55ms; acquired in apnea. Other sequence parameters are in Table 1.A non-rigid pairwise registration method6 was applied in the first two ASL datasets (Scan 1 and Scan 2), and independently the third ASL (Scan 3).
An ROI was manually drawn for each registered ASL dataset based in the mean perfusion-weighted images (subtracting sequentially acquired pair of label/control images), the short TI images, and M0; covering only the visible left ventricle.
Outliers in the ASL images were discarded from quantification based on the correlation metric obtained per image after registration, considering the median by three or more median absolute deviations.
A three-parameter fitting approach was used for perfusion quantification7,8 using all remaining label and control images, the mean between short TI images and the M0 image. Double weighting was used for the short TI and M0 images within the non-linear least squares fit. The following approximation of Buxton’s Kinetic Model8,9 was used for MBF quantification:
$$\mathrm{MBF\ (ml/g/min)}= \begin{pmatrix}\\\frac{\Delta S}{2\times M_0\times{TI_{avg}}\times e^{-\frac{TI_{avg}}{T1_{blood}}}}\end{pmatrix}\ \times 60\! $$
where $$$∆S$$$ is the mean signal difference between control and label images extrapolated at average inversion time ($$${TI_{avg}}$$$) obtained from the fitting, $$$M_0$$$ is mean baseline value and $$${T1_{blood}}$$$ for arterial blood at 1.5T (1434ms)2. Custom scripts were developed in MATLAB (MathWorks) for analysis.
T1 and T2 mean values were obtained from a manually drawn ROI covering the visible left ventricle in the generated vendor sequence motion corrected maps.
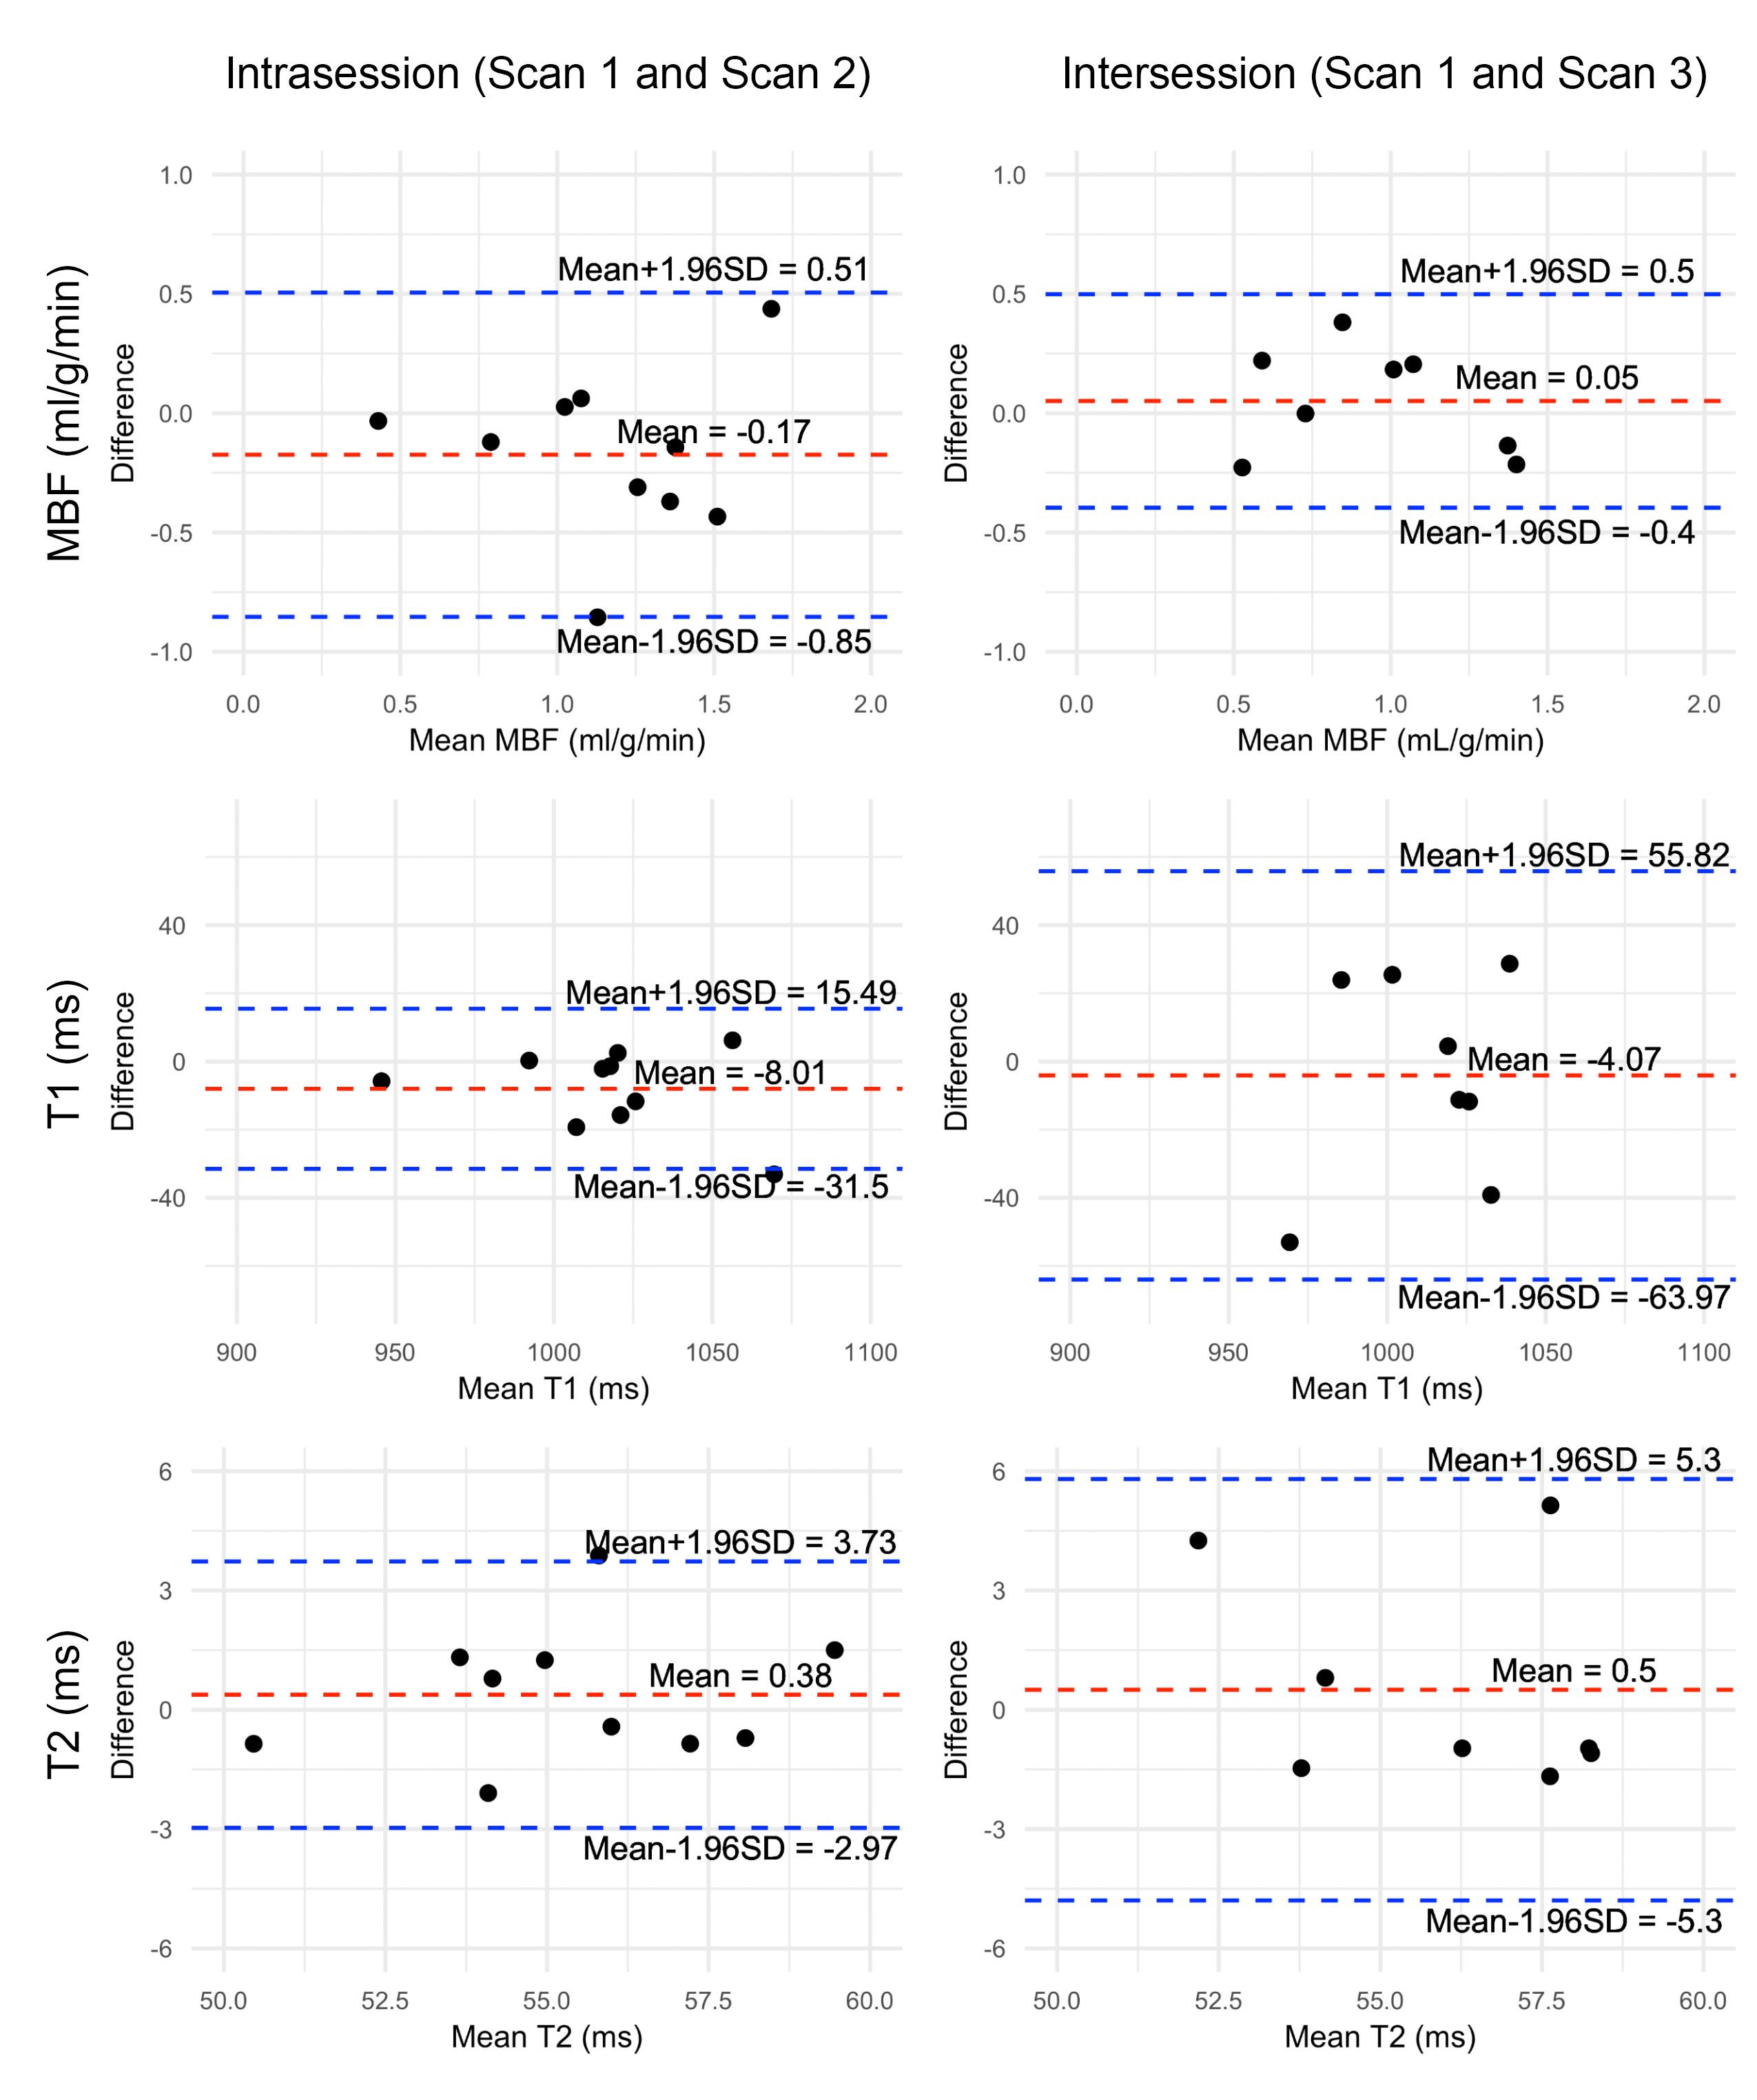
Reproducibility was assessed computing the within subject coefficient of variation (wsCV) for MBF, T1 and T2 for the intrasession (Scan 1 and Scan 2) and intersession (Scan 1 and Scan 3). The wsCVs were calculated as the squared root of the mean squared ratio between the standard deviation and the mean of the two repeated measurements.10 The limits of agreement for the Bland-Altman plots were calculated as the mean difference±1.96 times the standard deviation of the differences.
Results and Discussion
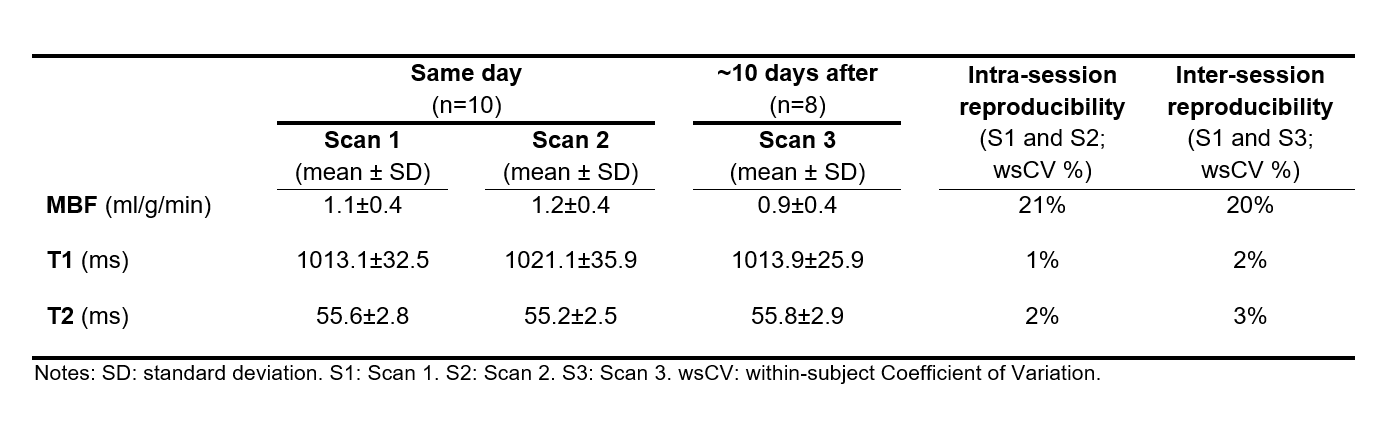
Intrasession wsCVs were 21% , 1% and 2%, and intersession wsCVs were 20%, 2% and 3% for MBF, T1 and T2 respectively. Other results are shown in Table 2. Bland-Altman plots are presented in Figure 2. MBF, T1 and T2 measurements were in agreement with those in the literature for healthy subjects.7,11–13 Further studies may focus on automatic segmentation and free breathing strategies.Conclusion
This study demonstrates that multiparametric ASL, T1 and T2 cardiac MRI can be acquired with a good intra and intersession reproducibility.Acknowledgements
Funding: Sergio M. Solís-Barquero received PhD grant support from Fundación Carolina and Universidad de Costa Rica. Verónica Aramendía-Vidaurreta received grant support from Siemens Healthcare. Research grant support from the Spanish Ministry of Science and Innovation (grant: PI21/00578 ).References
1. Patel, A. R. et al. Stress Cardiac Magnetic Resonance Myocardial Perfusion Imaging: JACC Review Topic of the Week. Journal of the American College of Cardiology vol. 78 1655–1668 Preprint at https://doi.org/10.1016/j.jacc.2021.08.022 (2021).2. Williams, D. S., Detre, J. A., Leigh, J. S. & Koretsky, A. P. Magnetic resonance imaging of perfusion using spin inversion of arterial water. in Proc. Natl. Acad. Sci. USA 89 vol. 89 212–216 (1992).
3. Kober, F., Jao, T., Troalen, T. & Nayak, K. S. Myocardial arterial spin labeling. Journal of Cardiovascular Magnetic Resonance 18, (2016).
4. Kellman, P. & Hansen, M. S. T1-mapping in the heart: Accuracy and precision. Journal of Cardiovascular Magnetic Resonance 16, (2014).
5. O’Brien, A. T., Gil, K. E., Varghese, J., Simonetti, O. P. & Zareba, K. M. T2 mapping in myocardial disease: a comprehensive review. Journal of Cardiovascular Magnetic Resonance vol. 24 Preprint at https://doi.org/10.1186/s12968-022-00866-0 (2022).
6. Aramendía-Vidaurreta, V. et al. Reduction of motion effects in myocardial arterial spin labeling. Magn Reson Med 87, 1261–1275 (2022).
7. Aramendia-Vidaurreta, V. et al. Effects of double-ECG gating in synchronized breathing myocardial arterial spin labeling. in Proc. Intl. Soc. Mag. Reson. Med. 31 (1072) (2023).
8. Poncelet, B. P. et al. Measurement of human myocardial perfusion by double-gated flow alternating inversion recovery EPI. Magn Reson Med 41, 510–519 (1999).
9. Buxton, R. B. et al. A general kinetic model for quantitative perfusion imaging with arterial spin labeling. Magn Reson Med 40, 383–396 (1998).
10. Bland, J. M. & Altman, D. G. Statistics Notes Measurement error. BMJ 312, 1654 (1996).
11. Brown, L. A. E. et al. Sex- And age-specific normal values for automated quantitative pixel-wise myocardial perfusion cardiovascular magnetic resonance. Eur Heart J Cardiovasc Imaging 24, 426–434 (2023).
12. Henningsson, M., Carlhäll, C. J., Ebbers, T. & Kihlberg, J. Non-contrast myocardial perfusion in rest and exercise stress using systolic flow-sensitive alternating inversion recovery. Magnetic Resonance Materials in Physics, Biology and Medicine 35, 711–718 (2022).
13. Nickander, J. et al. The relative contributions of myocardial perfusion, blood volume and extracellular volume to native T1 and native T2 at rest and during adenosine stress in normal physiology. Journal of Cardiovascular Magnetic Resonance 21, (2019).
Figures