4874
Fluid mechanics based quantitative transport mapping network for predicting gene expression of nasopharyngeal carcinoma (NPC) patients1Weill Cornell Medicine, New York, NY, United States, 2Cornell University, New York, NY, United States, 3Weill Cornell Medicine, New York, NY, United States
Synopsis
Keywords: Perfusion, DSC & DCE Perfusion, Head & Neck Imaging
Motivation: To use fluid-mechanics based deep learning method to predict perfusion parameters from dynamic images
Goal(s): We propose to explore the possibility to use neural network trained on simulated data from fluid mechanics simulation to analyze dynamic medical images.
Approach: We use quantitative transport mapping network (QTMnet), which is trained on simulated concentration propagation profile generated from constrained constructive optimization (CCO) and transport equation-based tracer propagation simulation, to predict perfusion parameters including flow rate, permeability, vasculature volume, from DCE MRI images.
Results: QTMnet predict perfusion parameters accurately in simulation study and can distinguish different gene expression group patients comparing with using traditional kinetics model.
Impact: Proposed QTMnet method can be used to predict different perfusion parameters related to dynamic images accurately and automatically without usage of arterial input function.
Background
We propose to estimate perfusion parameters from dynamic contrast enhanced (DCE) MRI data using quantitative transport mapping network (QTMnet) without requiring an arterial input function. QTMnet is a deep neural network trained on simulated tracer propagation data based on constrained constructive optimization (CCO) vasculature generation and fluid mechanics transport simulation. Parabolic flow model was used to model tracer behavior in arteries and veins, and two compartment 4 parameter (2T4K) model is used to model tracer behavior in capillary and extravascular space. We compared QTMnet and traditional kinetic modeling method in simulation and vascular endothelial growth factor (VEGF) expression prediction for nasopharyngeal carcinoma (NPC) patients.Methods
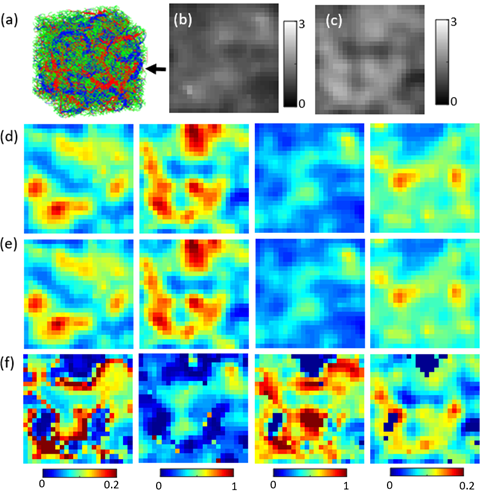
QTMnet is trained to predict perfusion parameters from time resolved contrast enhanced medical images. Its training data is generated based on the following simulation: First, we specify perfusion parameter distribution in certain volume as ground truth. We employ a 2T4K model for DCE MRI data, thus 4 parameters (flow rates $$$K_1$$$ and $$$K_2$$$ from artery to local capillary space and from local capillary space to venous space; exchange rate $$$K_3$$$ and $$$K_4$$$ between capillary and extravascular space) were generated based on mixed Gaussian distribution, one representative distribution is shown in Figure 1d. Second, we use the CCO method to generate arterial and venous vasculature that satisfies the specified perfusion parameter distribution, and connect the thus generated arterial outlets and venous inlets with simulated capillaries (1), which is shown in Figure 1a. Third, we used transport equation with parabolic flow assumption to simulate tracer propagation in arterial/venous space and used the following equation [1] and [2] to simulate tracer propagation in the capillary and extravascular space (2), where $$$C_{art}$$$ , $$$C_{cap}$$$ , $$$C_{tissue}$$$ are tracer concentration in artery, capillary, and tissue space.$$\frac{\partial {C_{cap}}}{\partial t}=K_1 C_{art}-K_2 C_{cap}+K_3 C_{tissue}-K_4 C_{cap} \:\:\: [1]$$
$$\frac{\partial {C_{tissue}}}{\partial t}=-K_3 C_{tissue}+K_4 C_{cap}+D \Delta C_{tissue} \:\:\: [2]$$
Fourth, simulated concentration and perfusion parameter distribution was summed and down sampled to medical image resolution and used as training data for QTMnet, which is shown in Figure 1b. A 30-layer 3D U-net was trained on 1000 simulated data for 200 epochs, which is determined by minimizing error in validation dataset containing 200 simulated data.
We applied QTMnet on NPC DCE MRI data and tested the correlation between perfusion parameters and the expression of VEGF. VEGF encodes heparin-binding protein, which is essential for pathological angiogenesis (3). DCE MRI images and VEGF expression of 95 NPC patients were acquired. DCE images were acquired using a T1 fast-low angle shot, FLASH/vibe sequence with 50 dynamic acquisitions, 4.9 s per dynamic acquisition, TR=4.09 ms, TE=1.47 ms, flip angle=9°, phase=75%, bandwidth=400 Hz, thickness=4 mm, slice gap=0 mm, FOV=180*180 mm2, matrix=192×144, TA=245s. An unpaired two-sided t-test was performed comparing these parameters between VEGF=0 and VEGF=1 group.
Results
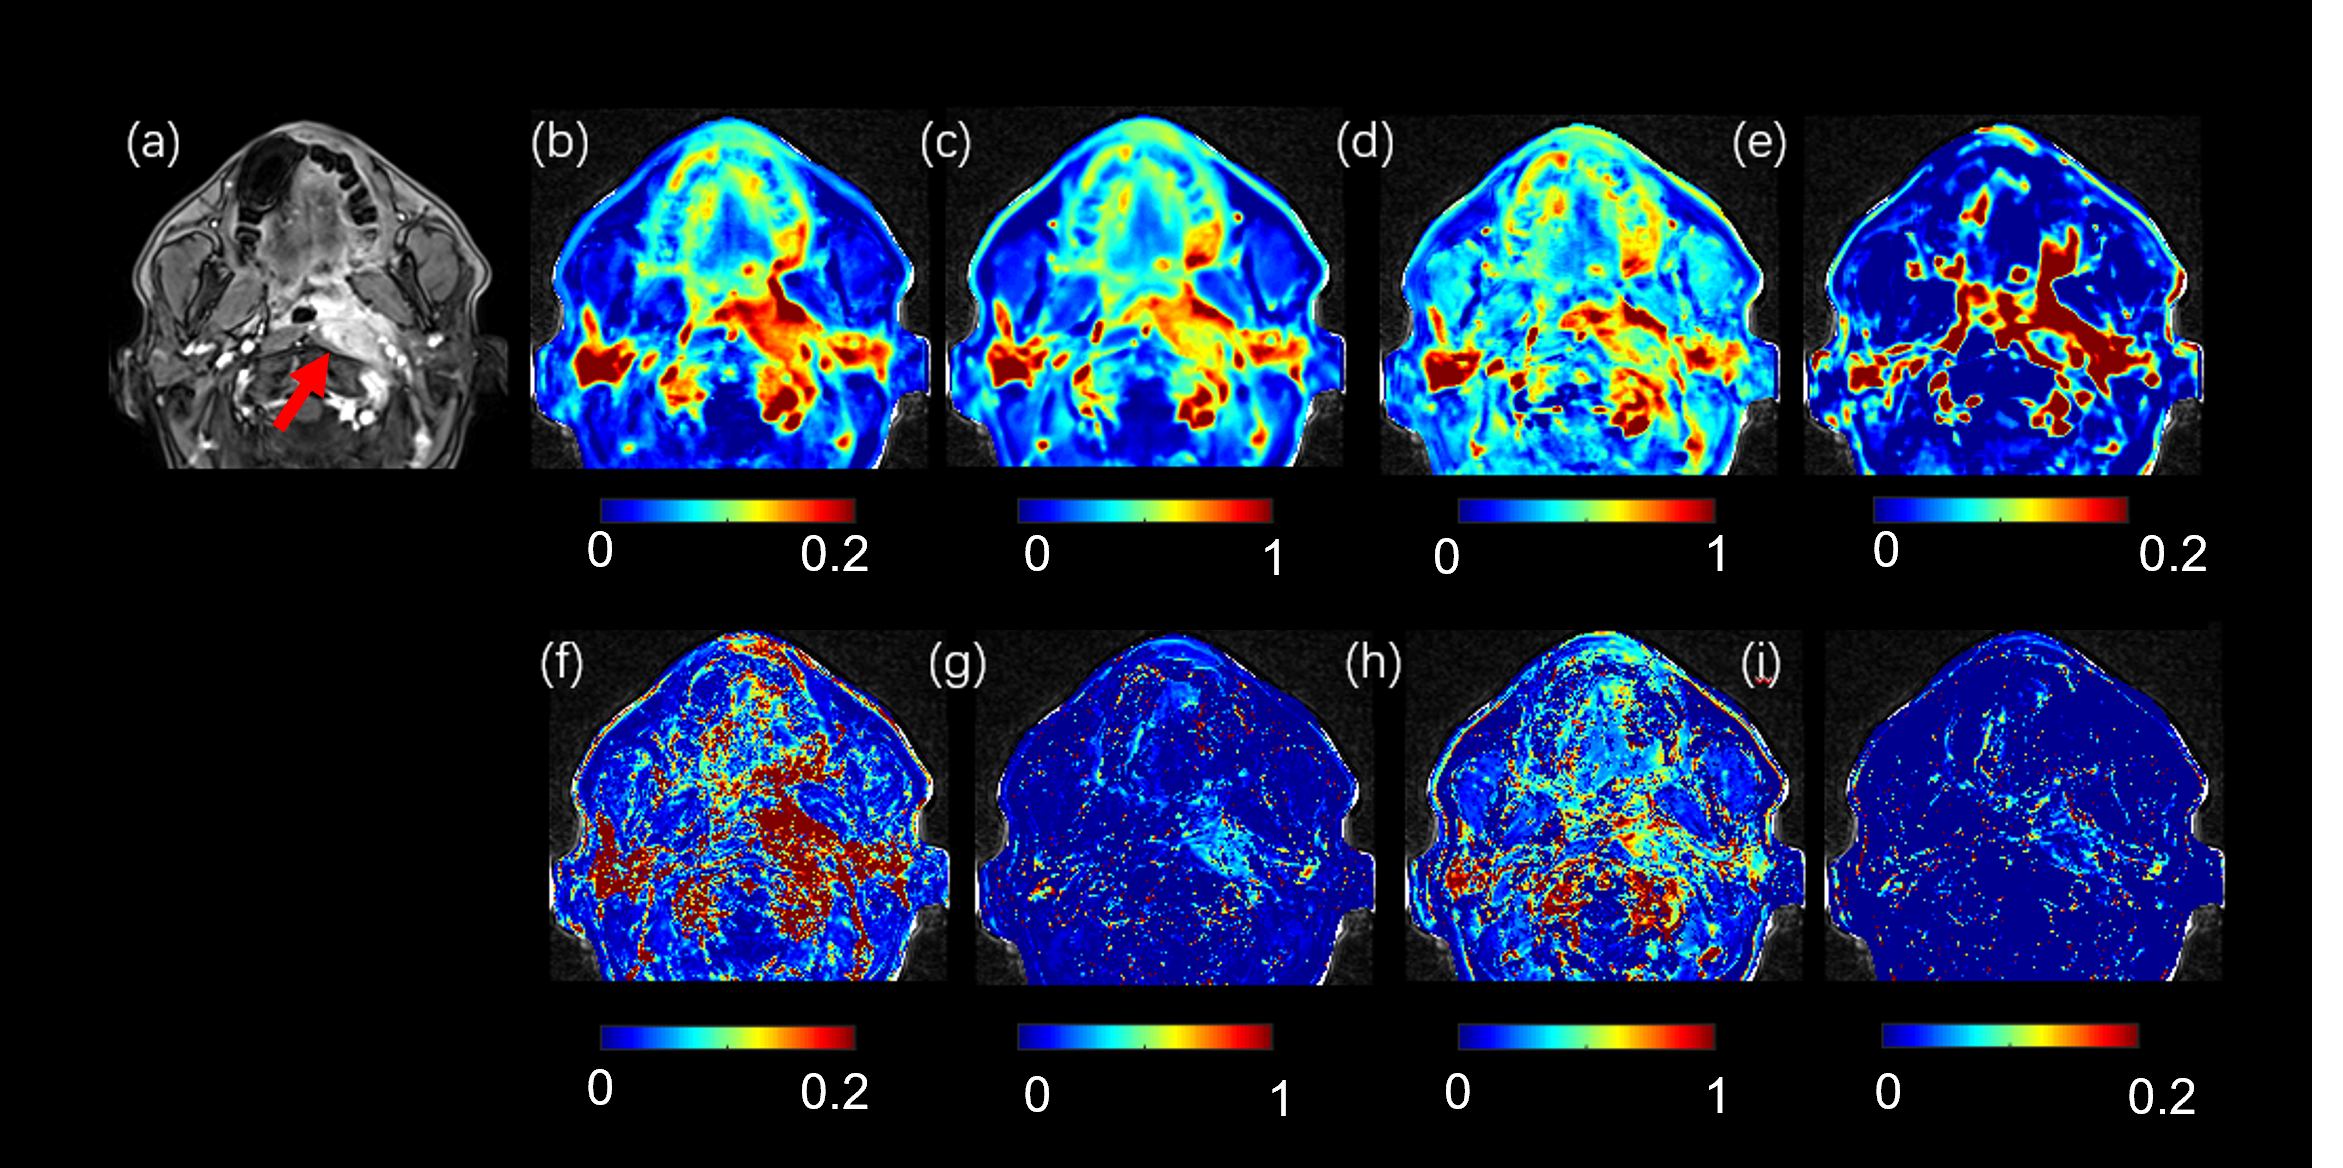
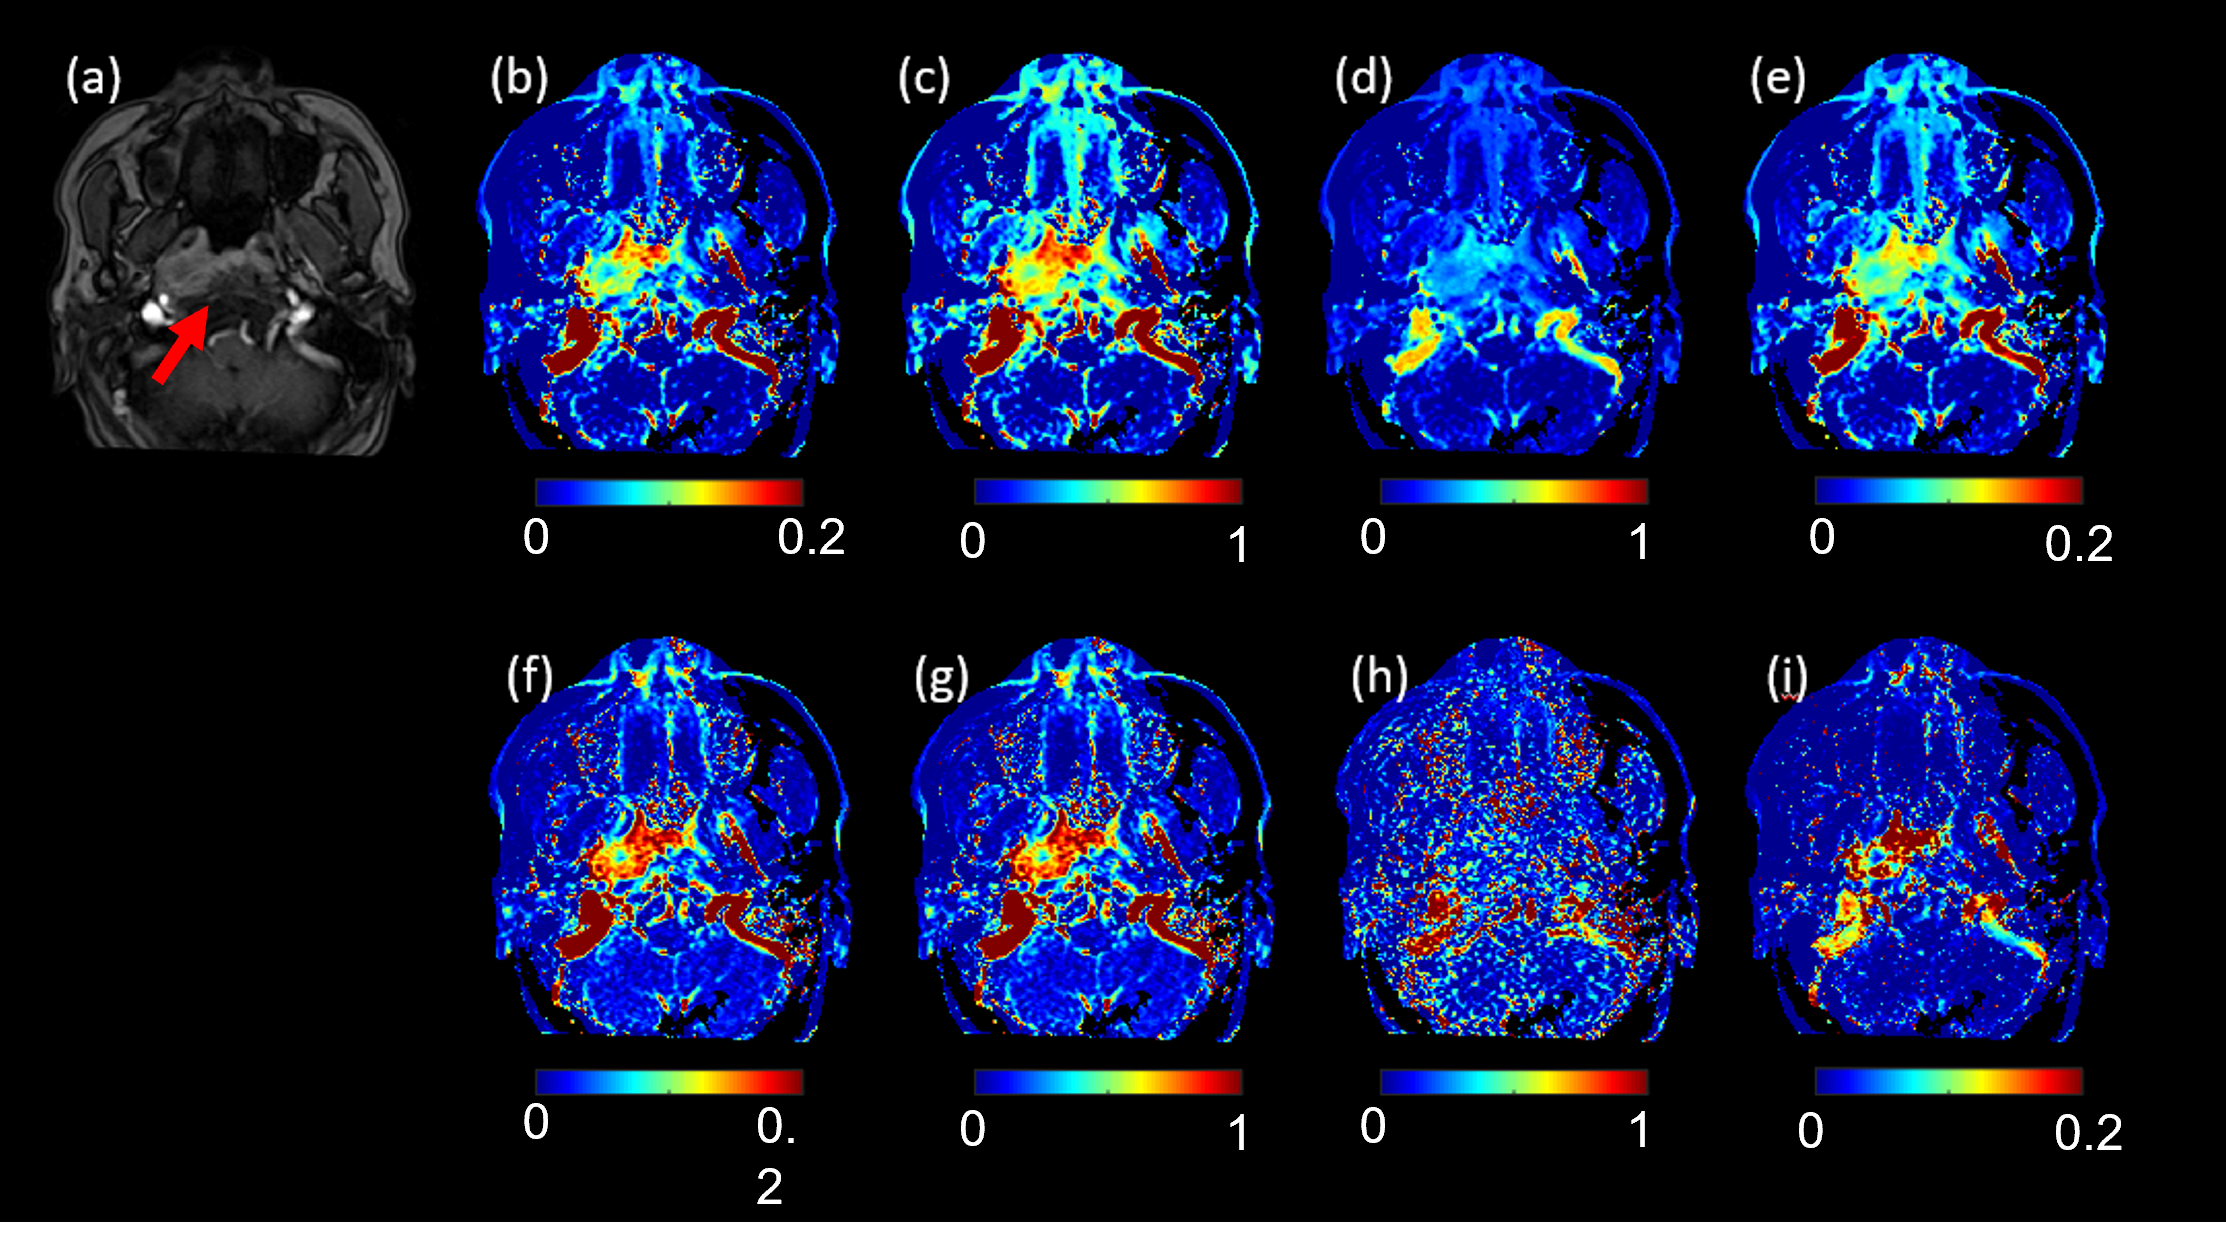
QTMnet predicted $$$K_1$$$ , $$$K_2$$$ $$$K_3$$$ and $$$K_4$$$ from a concentration profile on a CCO generated vasculature in test dataset is shown in Figure 1e. As a comparison, ground truth and two-compartment kinetic modeling predicted $$$K_1$$$ , $$$K_2$$$ $$$K_3$$$ and $$$K_4$$$ using concentration at the arterial inlet as the AIF are shown in Figure 1f, accordingly. The rRMSEs of QTMnet predicted perfusion parameters were 10.12% for $$$K_1$$$ , 11.87% for $$$K_2$$$ , 16.64% for $$$K_3$$$ , and 17.01% for $$$K_4$$$, while the rRMSEs of kinetic modeling predicted perfusion parameters were 45.36% for $$$K_1$$$ , 47.18% for $$$K_2$$$ , 40.17% for $$$K_3$$$ , and 31.55% for $$$K_4$$$ . The QTMnet and kinetic modeling results for the DCE MRI of tumors with and without VEGF expression are shown in Figure 2 and 3, respectively. For QTMnet, a significant difference between VEGF=1 and VEGF=0 group was observed for $$$K_1$$$ (0.13±0.019 /s vs 0.11±0.021 /s, p<0.001), $$$K_2$$$ (0.66±0.10/s vs 0.56±0.09/s, p<0.001), $$$K_3$$$ (0.77±0.21/s vs 0.56±0.29/s, p=0.03), but not in $$$K_4$$$ (0.07±0.04/s vs 0.06±0.03/s, p=0.08). For traditional kinetic modeling, a significant difference between VEGF=1 and VEGF=0 group was observed for $$$K_1$$$ (0.17±0.06 mL/100g/min vs 0.21±0.06 mL/100g/min, p=0.006), $$$K_3$$$ (0.31±0.06 vs 0.27±0.05, p=0.004), but not in $$$K_2$$$ (0.49±0.09/s vs 0.47±0.09/s, p=0.22) and $$$K_4$$$ (0.15±0.07 vs 0.13±0.05, p=0.21). $$$K_2$$$ from QTMnet showed the highest AUC (0.79, 95% CI 0.68-0.78), followed by $$$K_1$$$ from QTMnet (AUC=0.75, 95% CI 0.65-0.85), and $$$K_3$$$ from traditional kinetic modeling (AUC=0.71, 95% CI 0.57-0.80).Discussion
QTMnet can accurately predict perfusion parameters from contrast enhanced images, and can be used to better detect the vascular property change during disease progression comparing with traditional kinetic method.Acknowledgements
No acknowledgement found.References
(1) Karch R, Neumann F, Neumann M, et al. A three-dimensional model for arterial tree representation, generated by constrained constructive optimization[J]. Computers in biology and medicine, 1999, 29(1): 19-38.
(2) Zhang Q, Luo X, Zhou L, et al. Fluid Mechanics Approach to Perfusion Quantification: Vasculature Computational Fluid Dynamics Simulation, Quantitative Transport Mapping (QTM) Analysis of Dynamics Contrast Enhanced MRI, and Application in Nonalcoholic Fatty Liver Disease Classification[J]. IEEE Transactions on Biomedical Engineering, 2022, 70(3): 980-990.
Figures