4873
Grey and white matter plasticity during motor-skill learning: a longitudinal diffusion MRI study1Spinal Cord Injury Center Balgrist University Hospital, Zurich, Switzerland, 2Wellcome Centre for Human Neuroimaging, UCL Queen Square Institute of Neurology, London, United Kingdom, 3Department of Neurophysics, Max Planck Institute for Human Cognitive and Brain Sciences, Leipzig, Germany
Synopsis
Keywords: Multi-Contrast, Brain, Myelin plasticity, diffusion MRI, DTI, corticospinal tract, hippocampus, cerebellum, sensory motor system
Motivation: MRI studies have demonstrated plastic changes in grey and white matter (GM/WM) during motor skill learning. However, diffusion magnetic resonance imaging (dMRI) might provide additional complementary information in contrast to multi-parametric mapping (MPM), which has been investigated previously.
Goal(s): To investigate training-induced neuroplasticity using dMRI and contextualize them to the MPM findings.
Approach: Acquisition of longitudinal dMRI and MPM during motor skill learning.
Results: We observed overlapping changes in dMRI and MPM metrics following motor skill learning. dMRI was thereby able to capture additional changes within the WM, whereas within the GM, some findings were unique to the MPM protocol.
Impact: dMRI and MPM metrics are sensitive to motor skill learning-induced changes in GM and WM. To combine the two methodologies advances our capability in detecting neuroplasticity changes and might be beneficial for patient rehabilitation.
Introduction
MRI studies have shown that both grey and white matter (GM/WM) undergo plasticity changes within the cortex and subcortex during motor skill learning1–8. In particular, training-induced plasticity has been investigated using the multi-parameter mapping (MPM9) protocol, which provides metrics sensitive to myelin including magnetization transfer saturation (MTsat), longitudinal relaxation rate (R1), and to iron (effective transverse relaxation rate (R2*))8. However, the potential of diffusion imaging (dMRI), which might detect additional complementary changes has not been investigated10.Methods
We recruited 18 healthy males to undergo one-hour training-sessions four times a week for four consecutive weeks (Fig. 1), and 14 healthy males to undergo scanning only. Behavioral training assessment and longitudinal dMRI and MPM were conducted at baseline (before training), on training days 7, 14, and 28, and after training on day 84. MPM data consisted of three 3D multi-echo FLASH images with the following parameters: resolution=1x1x1mm3, repetition times (TR) and flip angles (T1w: 25ms/23°; PDw: 25ms/4°, and MTw: 37ms/9°)8. We used the hMRI toolbox11 with UNICORT correction12,13 to generate maps of MTsat, R1, and R2*. dMRI data were acquired using a single-shot spin-echo echo-planar imaging sequence with the following parameters: resolution=2.5x2.5x2.5mm3, TR=7600ms, echo time=80ms, flip angle=90°, 60 diffusion directions with b-values=1200s/mm², 7 with b-values=0s/mm². Data underwent denoising (MRtrix314), correction for susceptibility (FSL topup15) and motion and eddy-current artifacts (FSL eddy15), and were co-registered to the MTsat image. The diffusion tensor model (FSL dtifit15) was fitted to generate maps of FA, MD, AD, and RD. Using statistical parametric mapping, training-induced brain changes were investigated using FA, MD, AD, RD, MTsat, R1, and R2*, and compared to each other by superimposition of significant training responses.Results
Compared to non-trainees, trainees exhibited (i) a greater rate of increase in FA and AD and greater rate of decrease in RD and MD within the WM of the cerebellum and corticospinal tracts (CST), (ii) a greater rate of decrease in MD within the GM of the cerebellum, thalamus, and hippocampus, and (iii) a greater rate of decrease in R2* and MD within the GM of the cerebellum (Table 1, Figs. 2-3). The location of observed changes in MTsat, FA, AD, and RD overlapped within the CST (Fig. 3), where trainees exhibited greater positive quadratic change in MTsat (0.007%), a greater rate of increase in FA (0.153%) and AD (0.057%), as well as a greater rate of decrease in RD (-0.283%). Within GM of the cerebellum, we observed a greater rate of decrease in R2* (-0.163%) and MD (-0.120%) in trainees than in non-trainees (Fig. 3). The comparison of dMRI and MPM within GM or WM yielded simultaneous decreases in MD and RD and a positive quadratic response in MTsat, R1, and R2* in GM (Fig. 4). In WM, FA and AD linearly increased, while RD showed a linear decrease, and MTsat exhibited a positive quadratic change (Fig. 4).Discussion
We observed training-induced changes in FA, RD, AD, and MD in multiple brain regions including the CST, cerebellum, hippocampus, and thalamus. Such WM changes might be caused by alterations in the integrity of axonal cytoarchitecture or the degree of myelination16–24. The decrease in MD could be attributed to an increase in cortical axon, dendritic, and/or myelin content, as MD has been shown to be sensitive to changes in microstructure25,26, such as the loss of dendrites and synapses10,27.The dMRI changes overlapped with those previously observed in MTsat, R1, and R2*8. Increase in FA and AD and decrease in RD are expected during synaptic and dendritic branching, where new dendrites and axons are first created and then myelinated, or during pruning of non-essential synapses10,28–30. Decreases in MD and R2* in GM might be explained by dendritic sprouting and axonal branching, as during this process, microstructural density is increasing10,27 and iron gets consumed31,32.
Nevertheless, dMRI has provided also complementarity results to the MPM protocol, as the dMRI was able to capture additional changes within the WM, whereas within the GM, some findings were unique to the MPM protocol.
Conclusion
dMRI metrics detected changes within the WM that may reflect increased myelination and axonal changes, while changes within the GM potentially reflecting axonal and dendritic sprouting and pruning of nonessential synapses8. The complementarity of the findings in dMRI and MPM are able to advance our knowledge of neuroplasticity.Acknowledgements
We would like to thank all participants for participation in this study. We thank Eric Reese (https://github.com/kyzentun ) for selflessly offering his time and expertise in the writing of the StepMania scripts. We also thank Dr Maryam Seif, Prof Bogdan Draganski, Dr. Chris Easthope Awai, Dr. Marc Bolliger and Prof. Armin Curt for their guidance and support in developing and carrying out this study; and thanks to Daniel R. Altmann for the statistical support.References
1. Dayan, E. & Cohen, L. G. Neuroplasticity Subserving Motor Skill Learning. Neuron 72, 443–454 (2011).
2. Hüfner, K. et al. Structural and functional plasticity of the hippocampal formation in professional dancers and slackliners. Hippocampus 21, 855–65 (2011).
3. Taubert, M., Mehnert, J., Pleger, B. & Villringer, A. Rapid and specific gray matter changes in M1 induced by balance training. Neuroimage 133, 399–407 (2016).
4. Draganski, B. & May, A. Training-induced structural changes in the adult human brain. Behav. Brain Res. 192, 137–142 (2008).
5. Boyke, J., Driemeyer, J., Gaser, C., Buchel, C. & May, A. Training-Induced Brain Structure Changes in the Elderly. J. Neurosci.28, 7031–7035 (2008).
6. Scholz, J., Klein, M. C., Behrens, T. E. J. & Johansen-Berg, H. Training induces changes in white-matter architecture. Nat. Neurosci. 12, 1370–1371 (2009).
7. Jacobacci, F. et al. Rapid hippocampal plasticity supports motor sequence learning. Proc. Natl. Acad. Sci. 117, 23898–23903 (2020).
8. Azzarito, M. et al. Coherent, time-shifted patterns of microstructural plasticity during motor-skill learning. Neuroimage 274, 120128 (2023).
9. Weiskopf, N. et al. Quantitative multi-parameter mapping of R1, PD(*), MT, and R2(*) at 3T: a multi-center validation. Front. Neurosci. 7, 1–11 (2013).
10. Draganski, B. et al. Regional specificity of MRI contrast parameter changes in normal ageing revealed by voxel-based quantification (VBQ). Neuroimage 55, 1423–1434 (2011).
11. Weiskopf, N., Edwards, L. J., Helms, G., Mohammadi, S. & Kirilina, E. Quantitative magnetic resonance imaging of brain anatomy and in vivo histology. Nat. Rev. Phys. 3, 570–588 (2021).
12. Emmenegger, T. M. et al. The Influence of Radio-Frequency Transmit Field Inhomogeneities on the Accuracy of G-ratio Weighted Imaging. Front. Neurosci. 15, 1–17 (2021).
13. Weiskopf, N. et al. Unified segmentation based correction of R1 brain maps for RF transmit fi eld inhomogeneities (UNICORT). Neuroimage 54, 2116–2124 (2011).
14. MRtrix3. No Title.
15. Jenkinson, M., Beckmann, C. F., Behrens, T. E. J., Woolrich, M. W. & Smith, S. M. FSL. Neuroimage 62, 782–790 (2012).
16. Brennan, F. H., Cowin, G. J., Kurniawan, N. D. & Ruitenberg, M. J. Longitudinal assessment of white matter pathology in the injured mouse spinal cord through ultra-high field (16.4T) in vivo diffusion tensor imaging. Neuroimage 82, 574–585 (2013).
17. Budde, M. D. et al. Toward accurate diagnosis of white matter pathology using diffusion tensor imaging. Magn. Reson. Med.57, 688–695 (2007).
18. Kim, J. H. et al. Noninvasive diffusion tensor imaging of evolving white matter pathology in a mouse model of acute spinal cord injury. Magn. Reson. Med. 58, 253–260 (2007).
19. Song, S.-K. et al. Diffusion tensor imaging detects and differentiates axon and myelin degeneration in mouse optic nerve after retinal ischemia. Neuroimage 20, 1714–1722 (2003).
20. Sun, S.-W., Liang, H.-F., Cross, A. H. & Song, S.-K. Evolving Wallerian degeneration after transient retinal ischemia in mice characterized by diffusion tensor imaging. Neuroimage 40, 1–10 (2008).
21. Xie, M., Wang, Q., Wu, T.-H., Song, S.-K. & Sun, S.-W. Delayed axonal degeneration in slow Wallerian degeneration mutant mice detected using diffusion tensor imaging. Neuroscience 197, 339–347 (2011).
22. Zhang, J. et al. Diffusion tensor magnetic resonance imaging of Wallerian degeneration in rat spinal cord after dorsal root axotomy. J. Neurosci. 29, 3160–71 (2009).
23. Song, S.-K. et al. Dysmyelination revealed through MRI as increased radial (but unchanged axial) diffusion of water. Neuroimage 17, 1429–1436 (2002).
24. Sun, S.-W. et al. Noninvasive detection of cuprizone induced axonal damage and demyelination in the mouse corpus callosum. Magn. Reson. Med. 55, 302–308 (2006).
25. Weston, P. S. J., Simpson, I. J. A., Ryan, N. S., Ourselin, S. & Fox, N. C. Diffusion imaging changes in grey matter in Alzheimer’s disease: a potential marker of early neurodegeneration. Alzheimers. Res. Ther. 7, 47 (2015).
26. Le Bihan, D. Looking into the functional architecture of the brain with diffusion MRI. Nat. Rev. Neurosci. 4, 469–480 (2003).
27. Whitwell, J. L. et al. Gray and white matter water diffusion in the syndromic variants of frontotemporal dementia. Neurology 74, 1279–1287 (2010).
28. Zatorre, R. J., Fields, R. D. & Johansen-Berg, H. Plasticity in gray and white: neuroimaging changes in brain structure during learning. Nat. Neurosci. 15, 528–36 (2012).
29. Beaulieu, C. What Makes Diffusion Anisotropic in the Nervous Syste? in Diffusion MRI Theory,Methods, and Applications (ed. Jones, D. K.) 92–109 (Oxford University Press, 2011).
30. Beaulieu, C. The basis of anisotropic water diffusion in the nervous system - a technical review. NMR Biomed. 15, 435–55 (2002).
31. Carlson, E. S., Stead, J. D. H., Neal, C. R., Petryk, A. & Georgieff, M. K. Perinatal iron deficiency results in altered developmental expression of genes mediating energy metabolism and neuronal morphogenesis in hippocampus. Hippocampus17, 679–691 (2007).
32. Tran, P. V., Kennedy, B. C., Lien, Y. C., Simmons, R. A. & Georgieff, M. K. Fetal iron deficiency induces chromatin remodeling at the Bdnf locus in adult rat hippocampus. Am. J. Physiol. Regul. Integr. Comp. Physiol. 308, R276–R282 (2015).
Figures
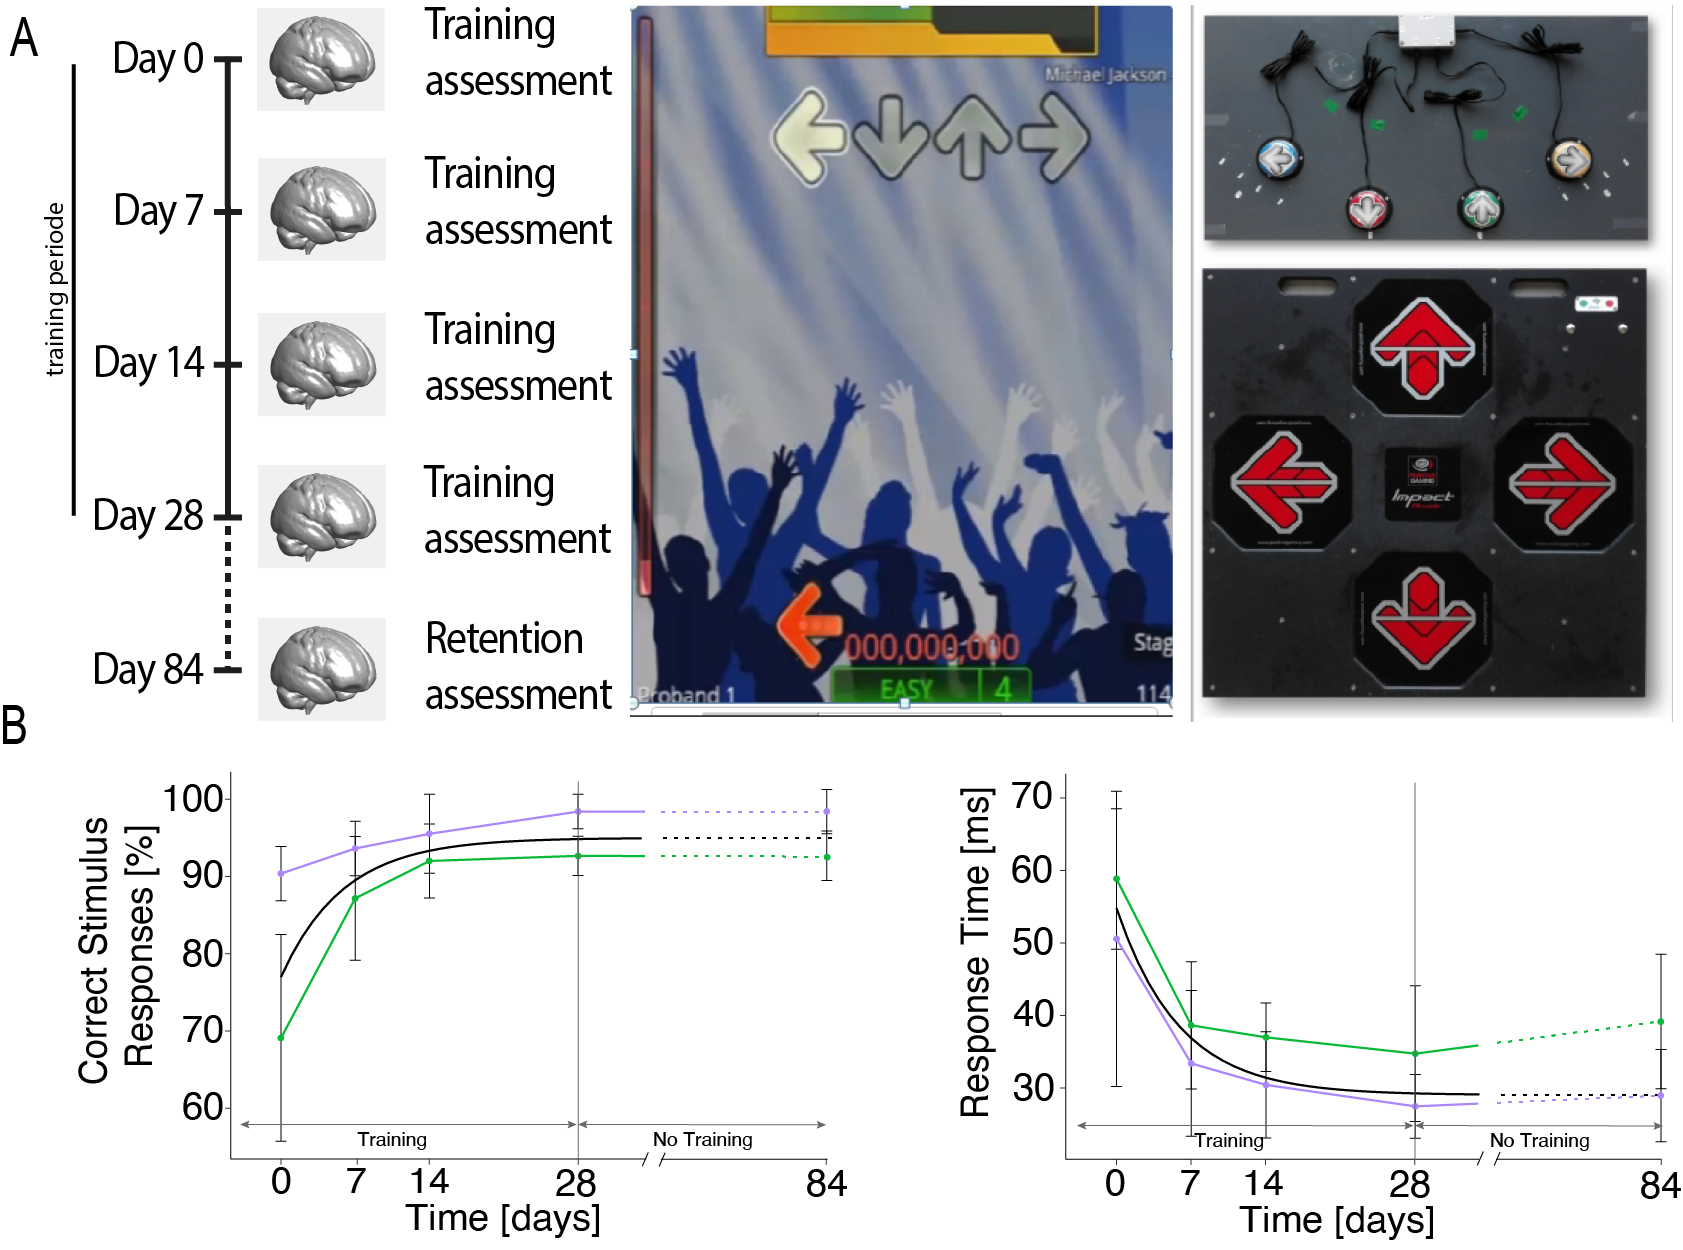
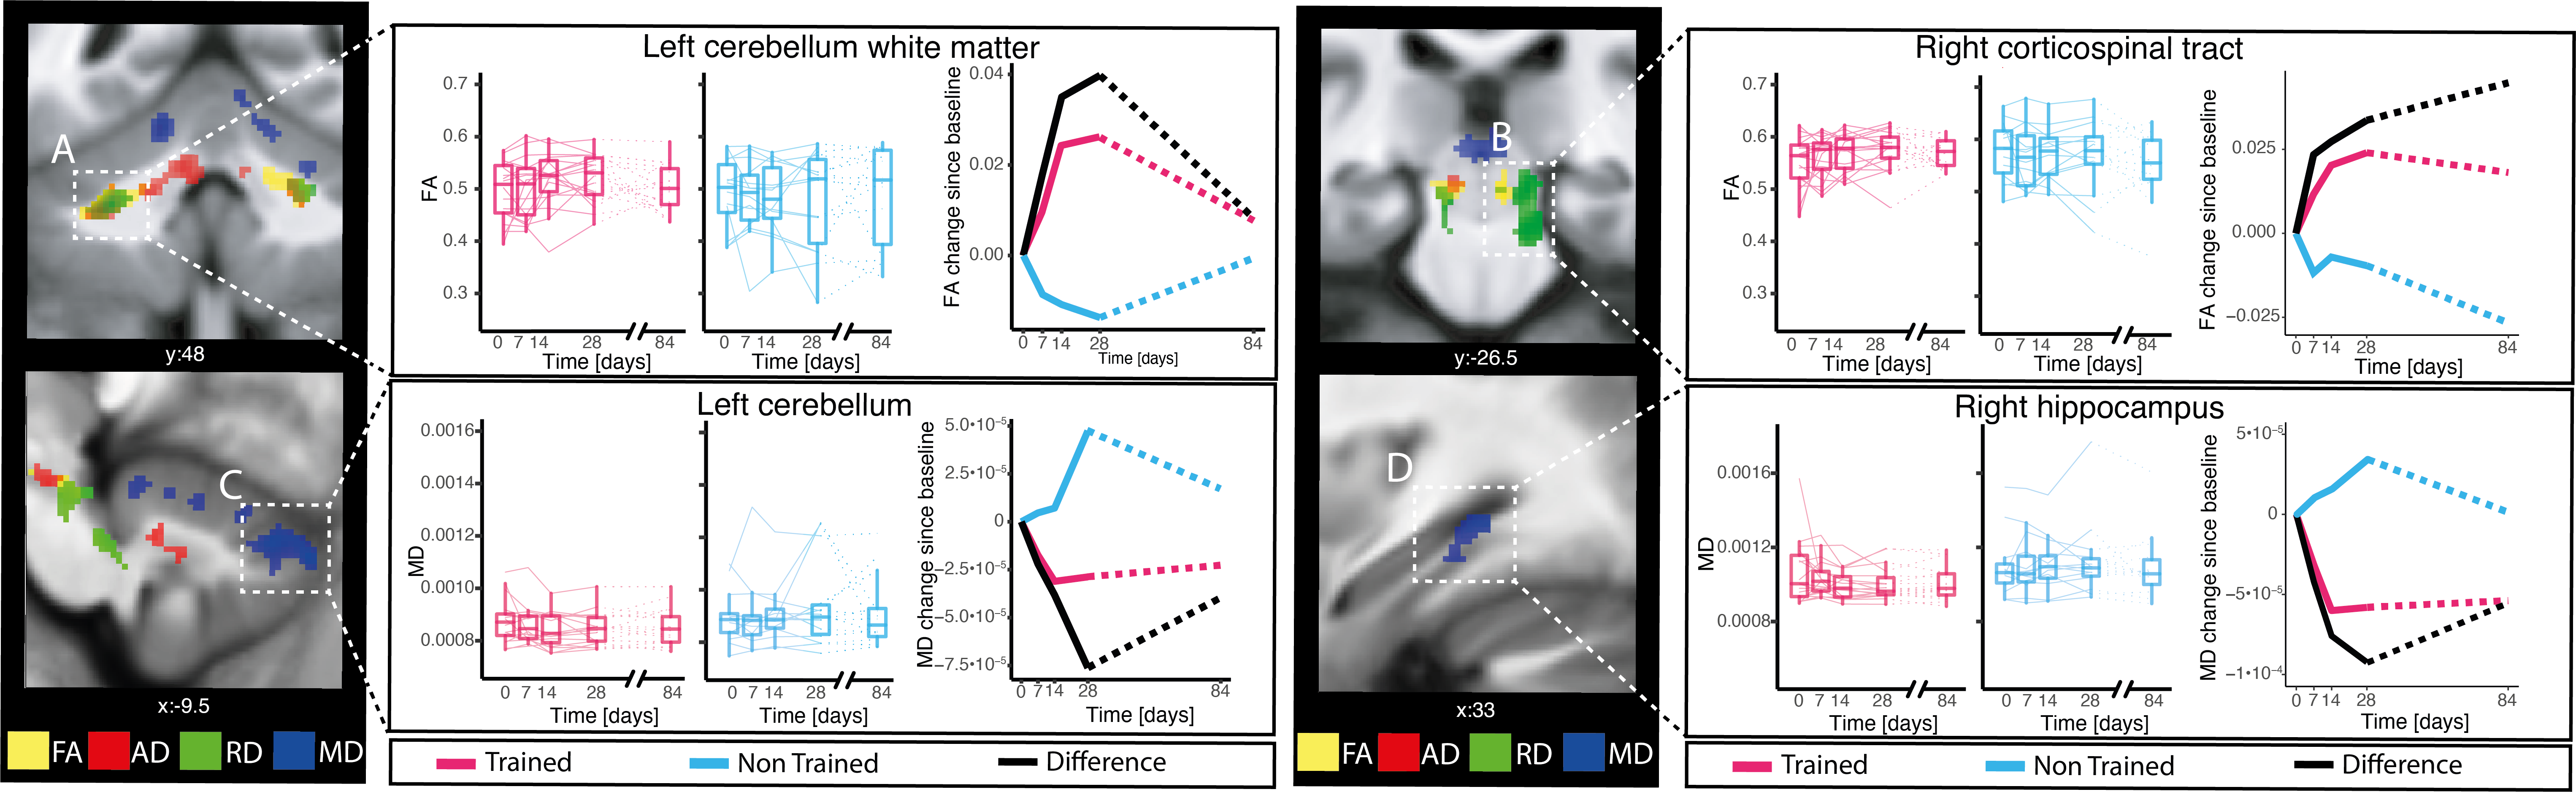
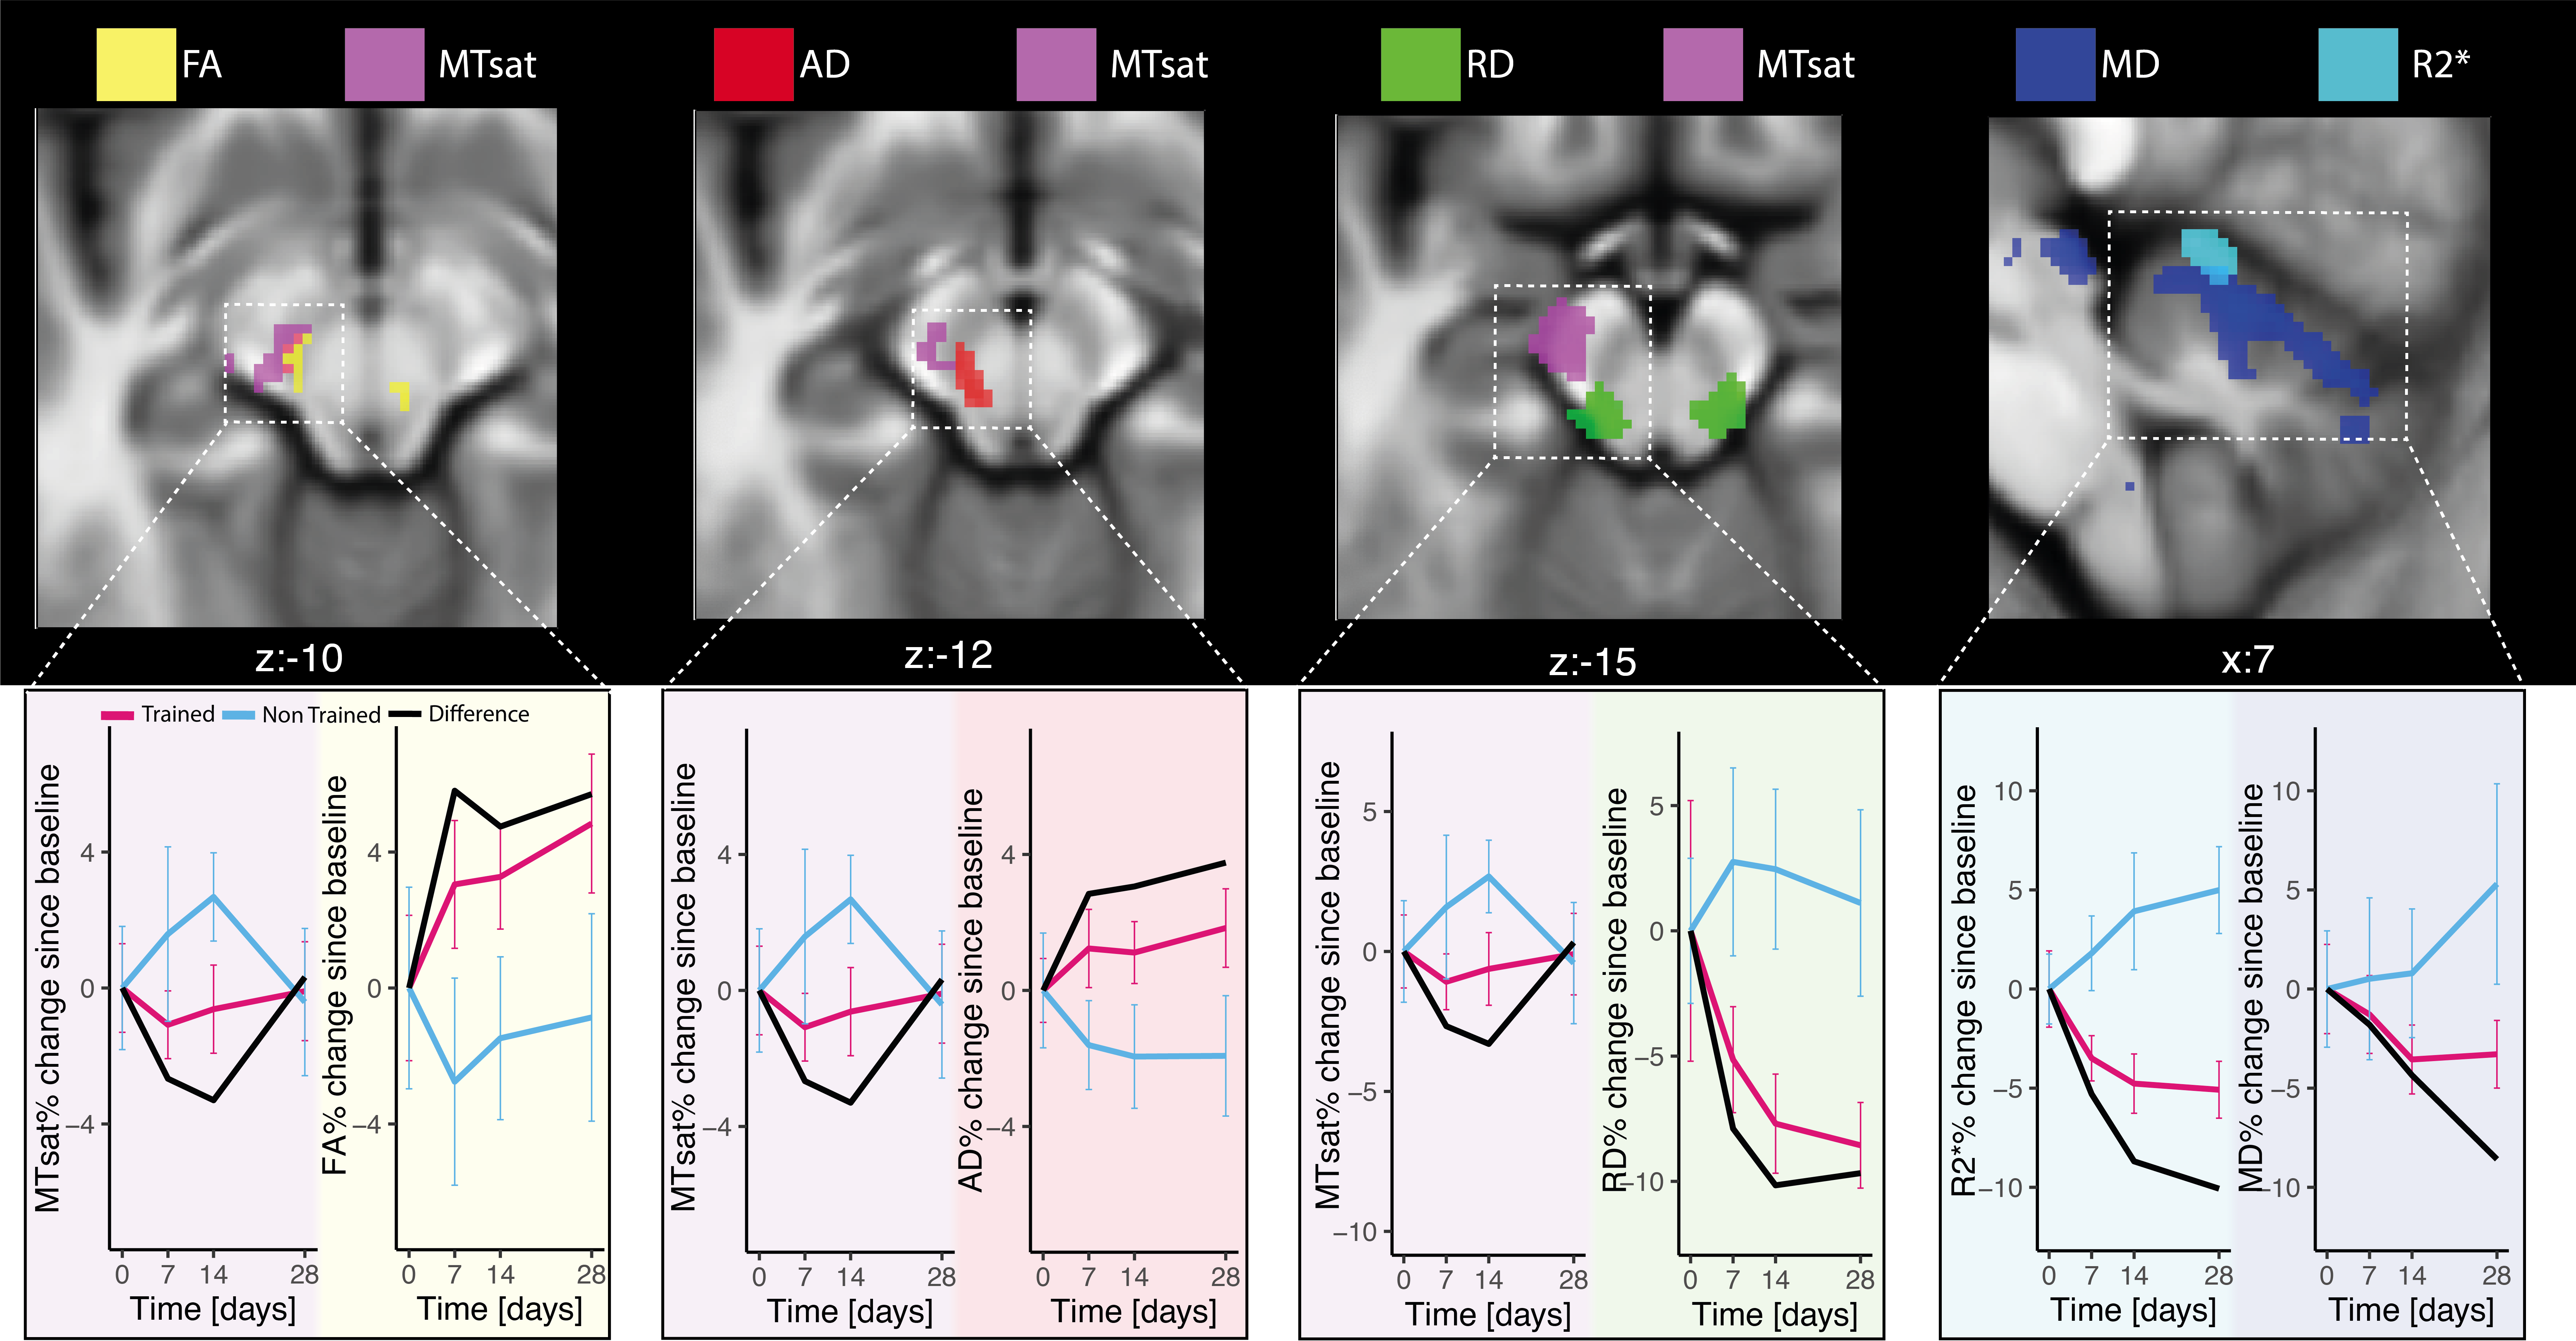
Fig.3: Overlap between significant multi-parameter mapping (MPM), magnetization transfer saturation (MTsat, magenta), and effective transverse relaxation rate (R2*, cyan) maps of study8 and diffusion imaging (dMRI) with fractional anisotropy (FA, yellow), mean diffusivity (MD, blue), axial diffusivity (AD, red), and radial diffusivity (RD, green). The overlapping clusters between MPM and DWI indicate regions where both modalities showed significant group differences, suggesting spatial colocation between microstructural changes captured by MPM and DWI.
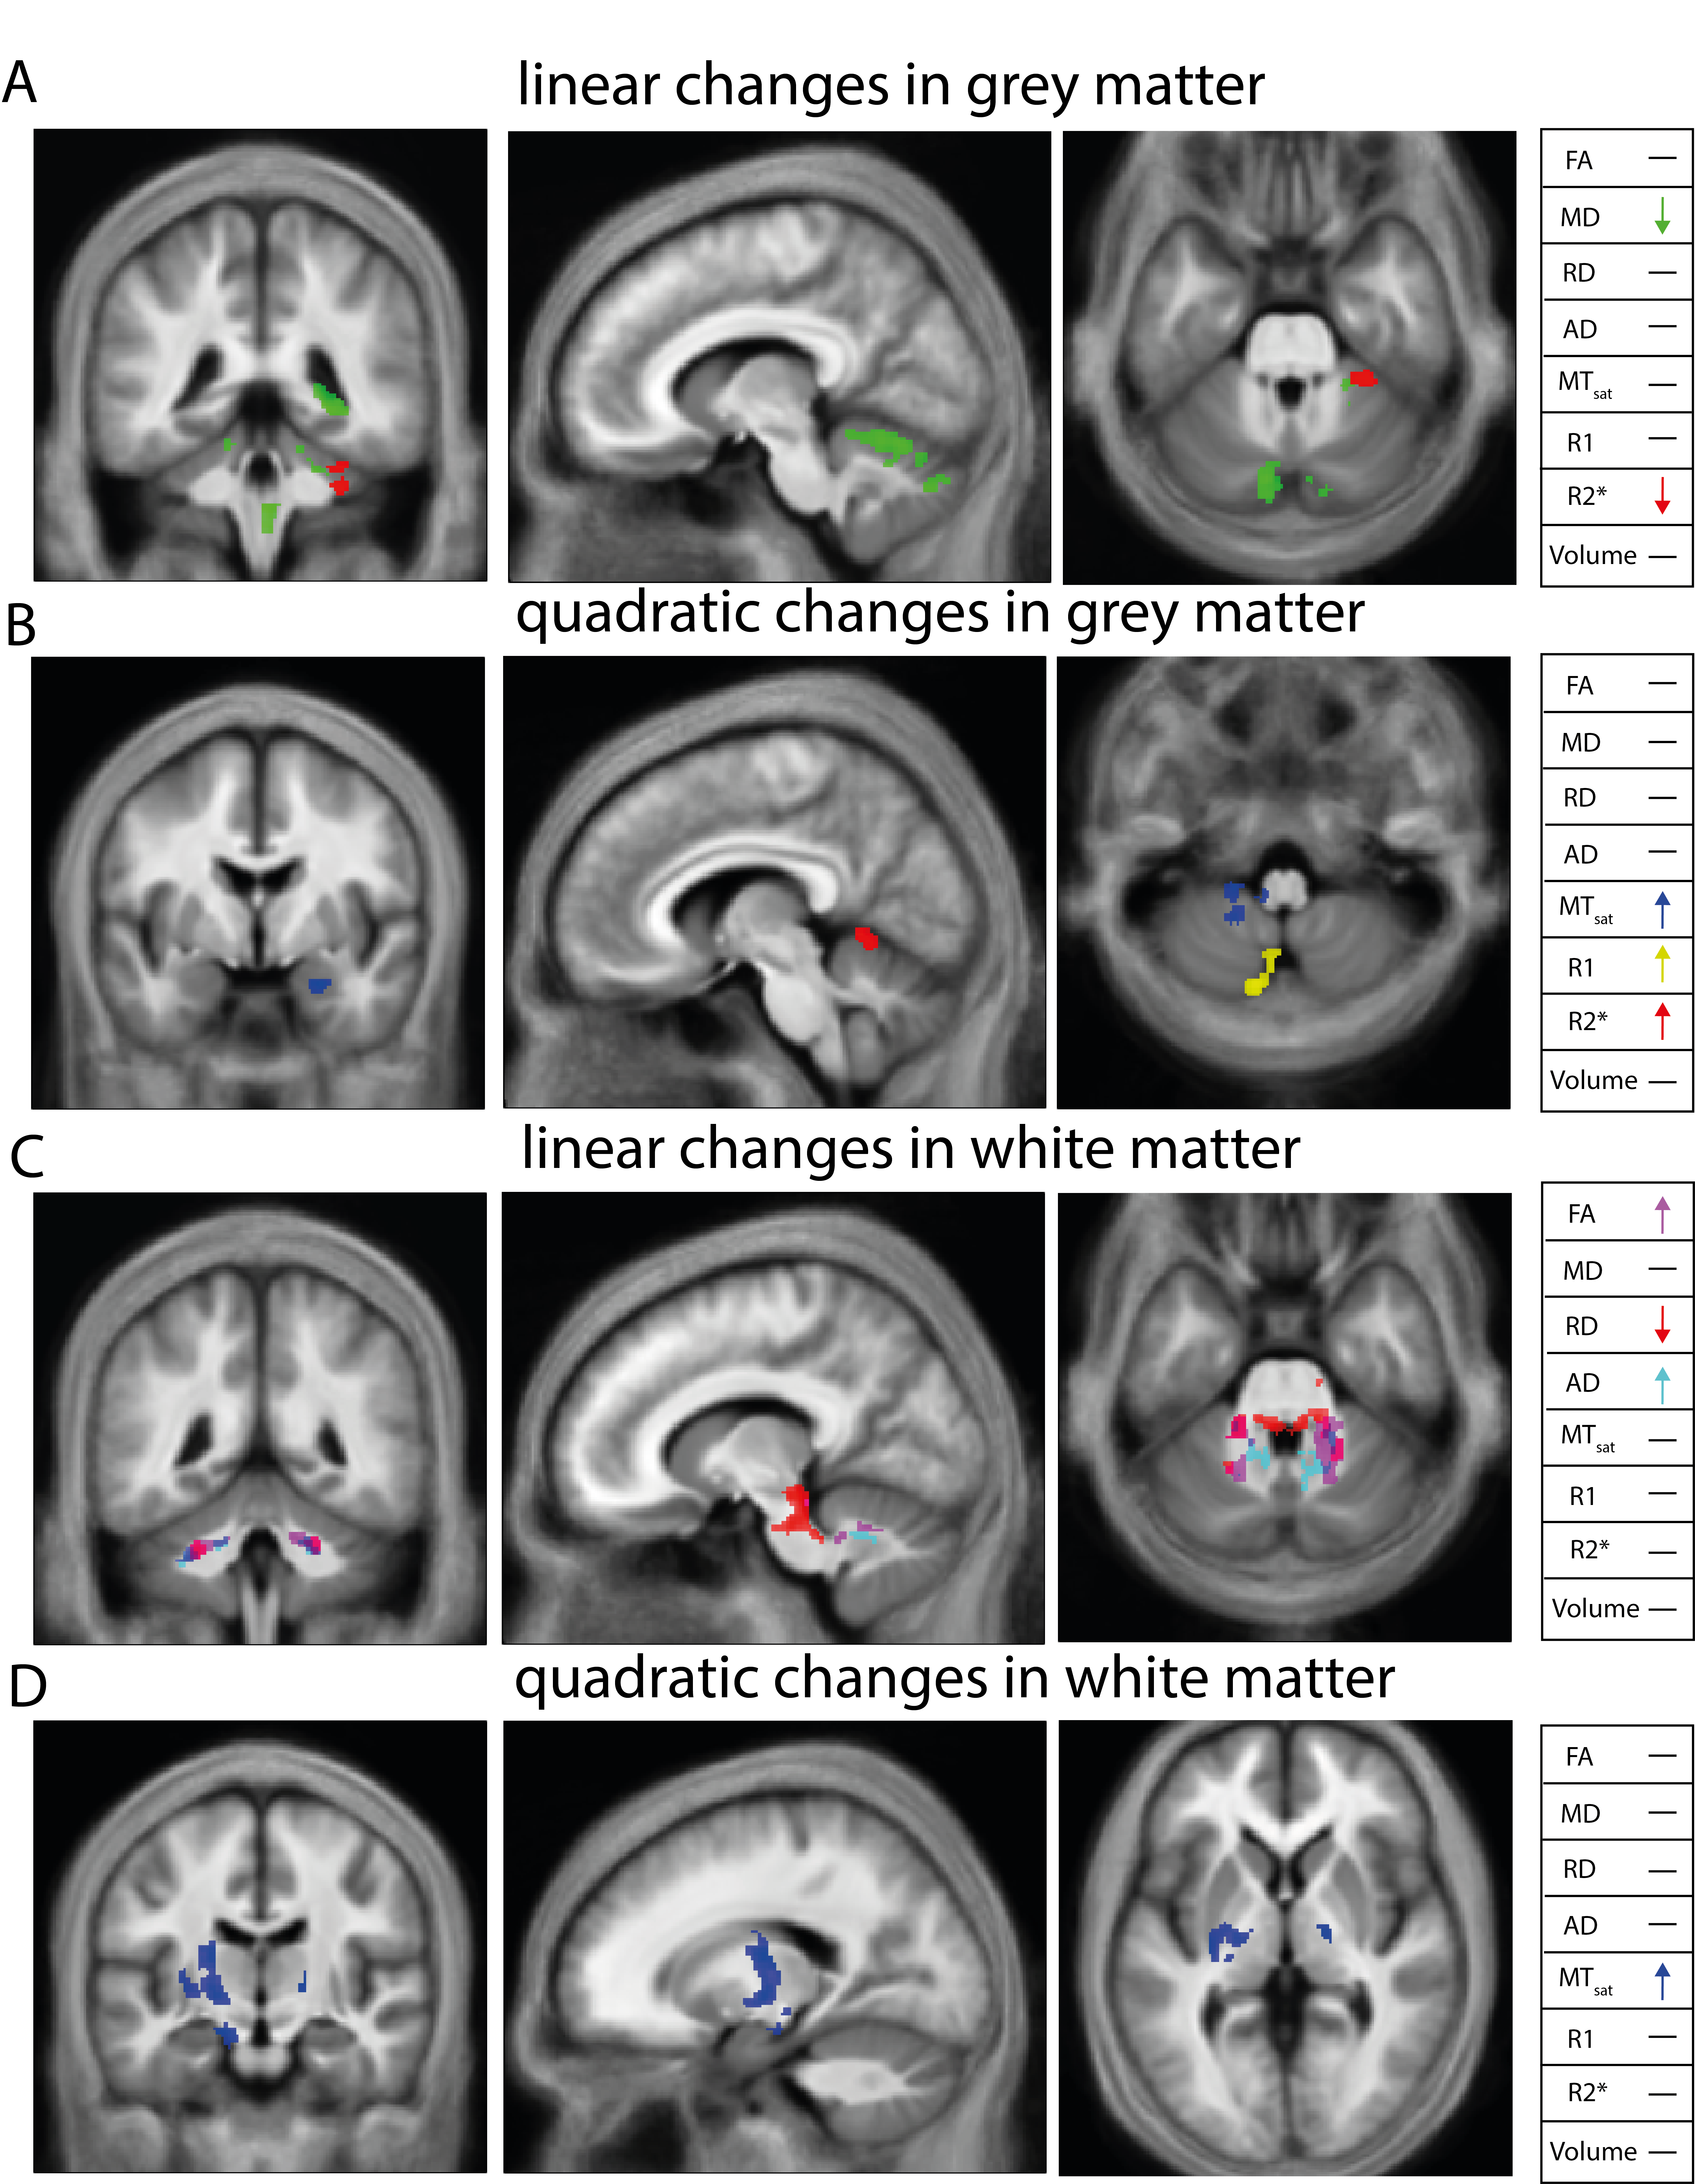
Fig.4: Overlap between significant multi-parameter mapping (MPM), magnetization transfer saturation (MTsat), longitudinal relaxation rate (R1),and effective transverse relaxation rate (R2*) maps of study8 and diffusion imaging (dMRI) with fractional anisotropy (FA), mean diffusivity (MD), axial diffusivity (AD), and radial diffusivity (RD). A) Linear MPM and DWI in grey matter (GM). B) Quadratic MPM and DWI change in GM. C) Linear MPM and DWI change in white matter (WM). D) Quadratic MPM and DWI change in WM.
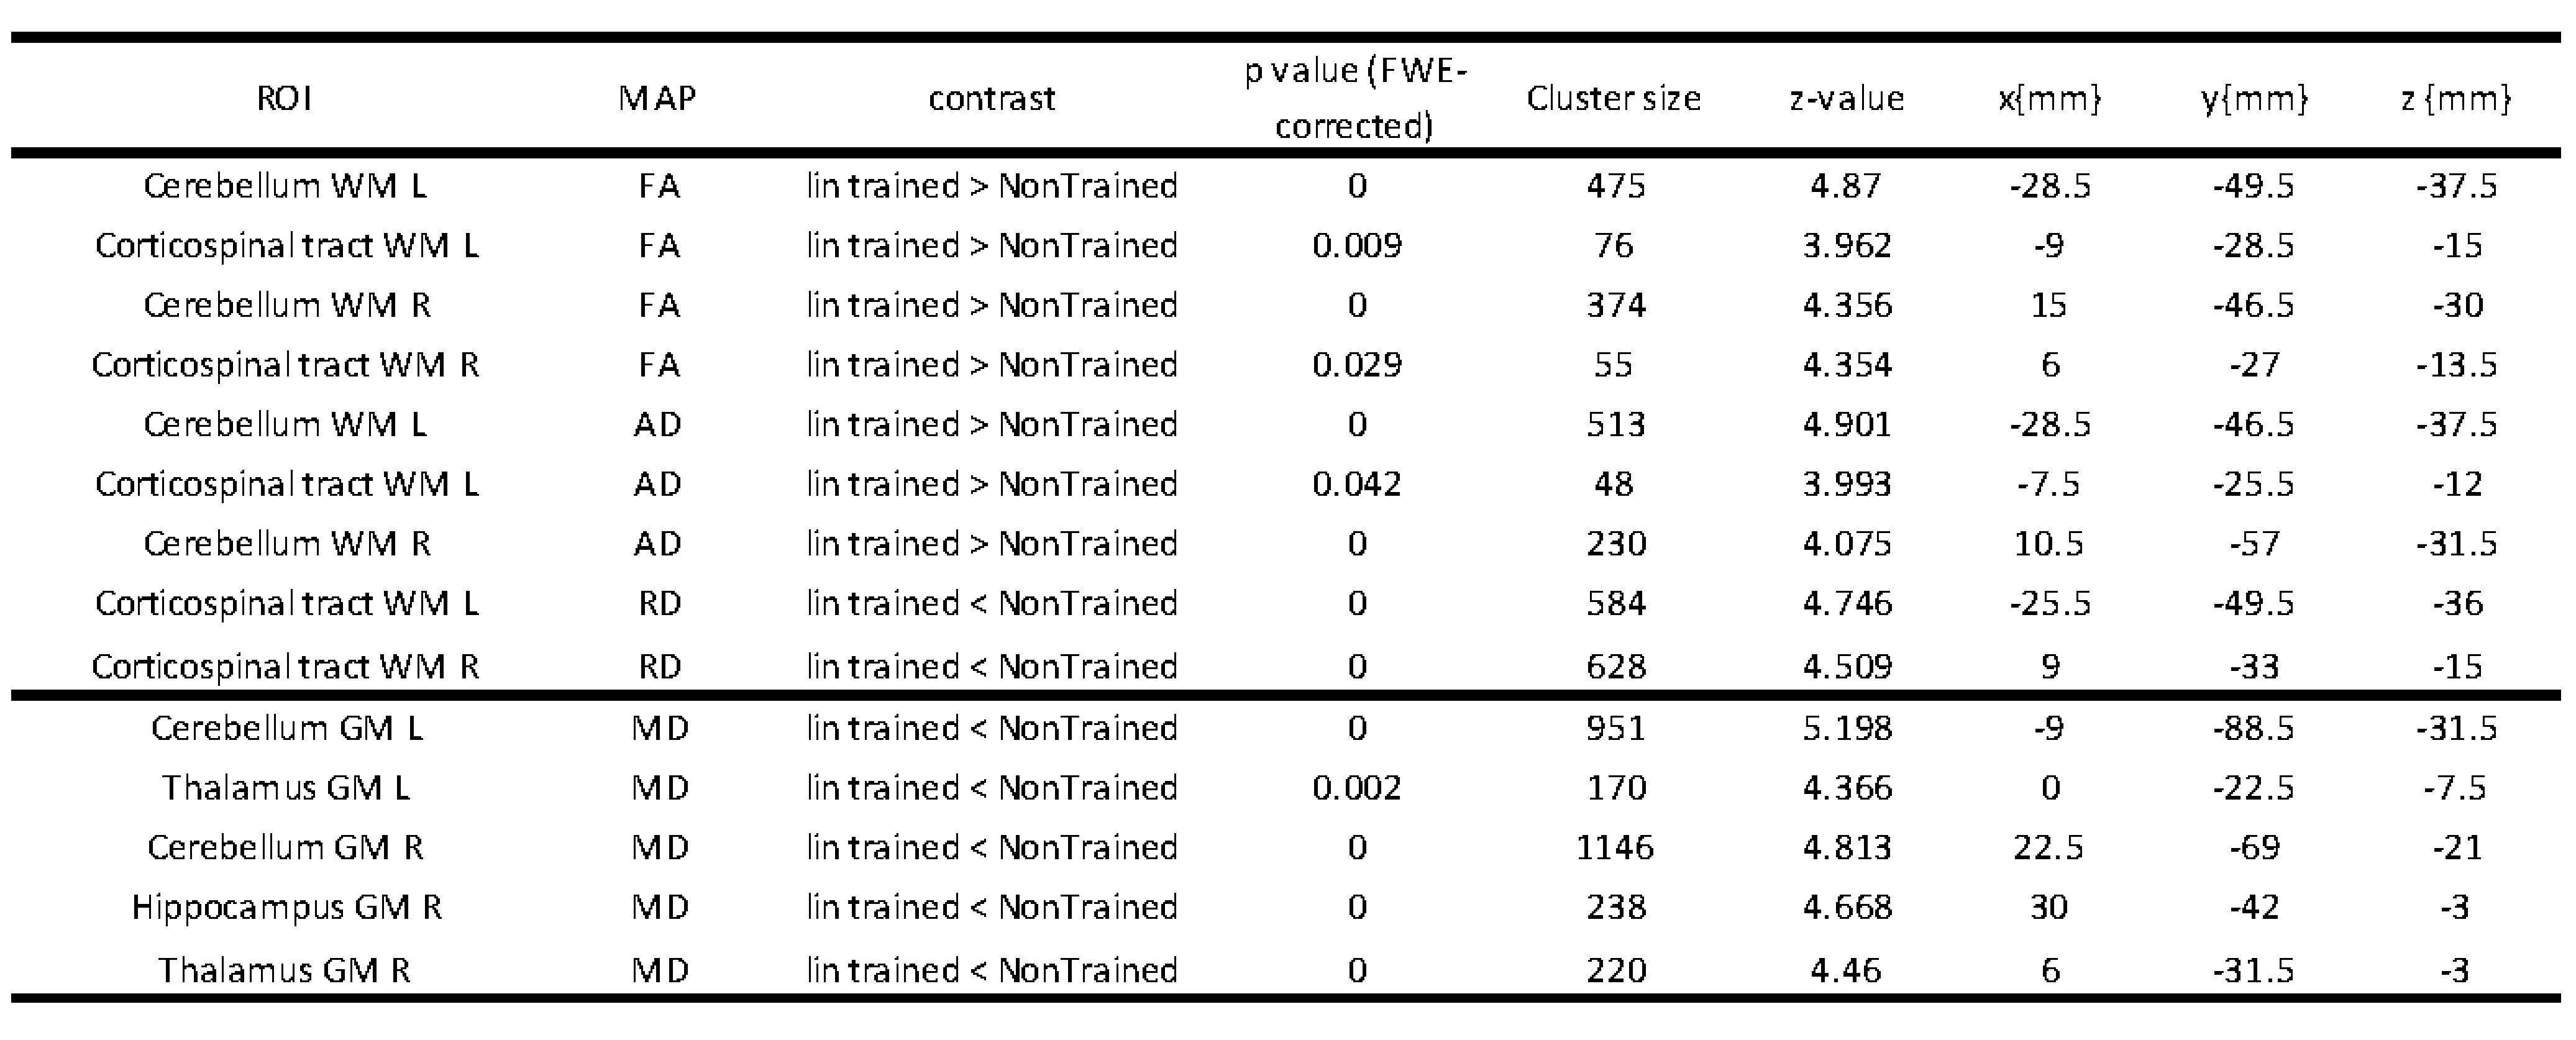
Table 1: Longitudinal statistical parametric mapping (SPM) displays differences in the linear time dependence of fractional anisotropy (FA), axial diffusivity (AD), radial diffusivity (RD), and mean diffusivity (MD) maps between trainees and untrained subjects. R = right, L = left