4871
Hepatic 5D flow: An Effective Acquisition and Reconstruction Scheme for Portal Vein1Institute of Science and Technology for Brain-Inspired Intelligence, Fudan University, Shanghai, China, 2MR Research Collaboration Team, Siemens Healthineers Ltd., Shanghai, China, 3Oden Institute for Computational Engineering and Sciences, University of Texas at Austin, Austin, TX, United States, 4Siemens Medical Solutions USA, Inc., Chicago, IL, United States, 5Siemens Healthcare GmbH, Erlangen, Germany
Synopsis
Keywords: Velocity/Flow, Velocity & Flow
Motivation: 4D flow imaging in the liver suffers from long acquisition time and inefficient motion control.
Goal(s): Address the challenges of prolonged acquisition time and significant motion artifacts in hepatic 4D flow imaging.
Approach: We collected data from all respiratory states without a diaphragm navigator, and retrospectively reconstructed respiratory-resolved 5D flow using simultaneously recorded breathing signal.
Results: This scheme reduced the acquisition time from over 10 minutes to 6-8 minutes, while maintaining consistent image quality with few motion artifacts. High quantitative correlation in hepatic hemodynamic results was found between the results from prospectively navigated data and retrospectively binned data.
Impact: The proposed hepatic 5D flow scheme achieved high image quality and quantitative metrics, compared with those of diaphragm navigated results. This scheme can effectively shorten the acquisition time to 6-8 minutes and mitigate motion artifacts.
Introduction
Hepatic hemodynamics serves as a crucial diagnostic indicator for hepatic diseases [1]. Previous studies have demonstrated a significant correlation between portal venous hemodynamics and the liver cirrhosis stage [2,3]. While 4D flow MRI has proven its feasibility for evaluating portal venous flow [4,5], its long data acquisition duration and the need for respiratory motion control have limited the widespread clinical applications. To address these issues, we collected data from all respiration states without navigator control to reduce scan times to 6-8 minutes. For motion control, respiratory-resolved 5D flow data were reconstructed by data binning using simultaneously recorded breathing signals. Hepatic hemodynamics was evaluated for different phases and compared with navigated 4D flow data.Materials and Methods
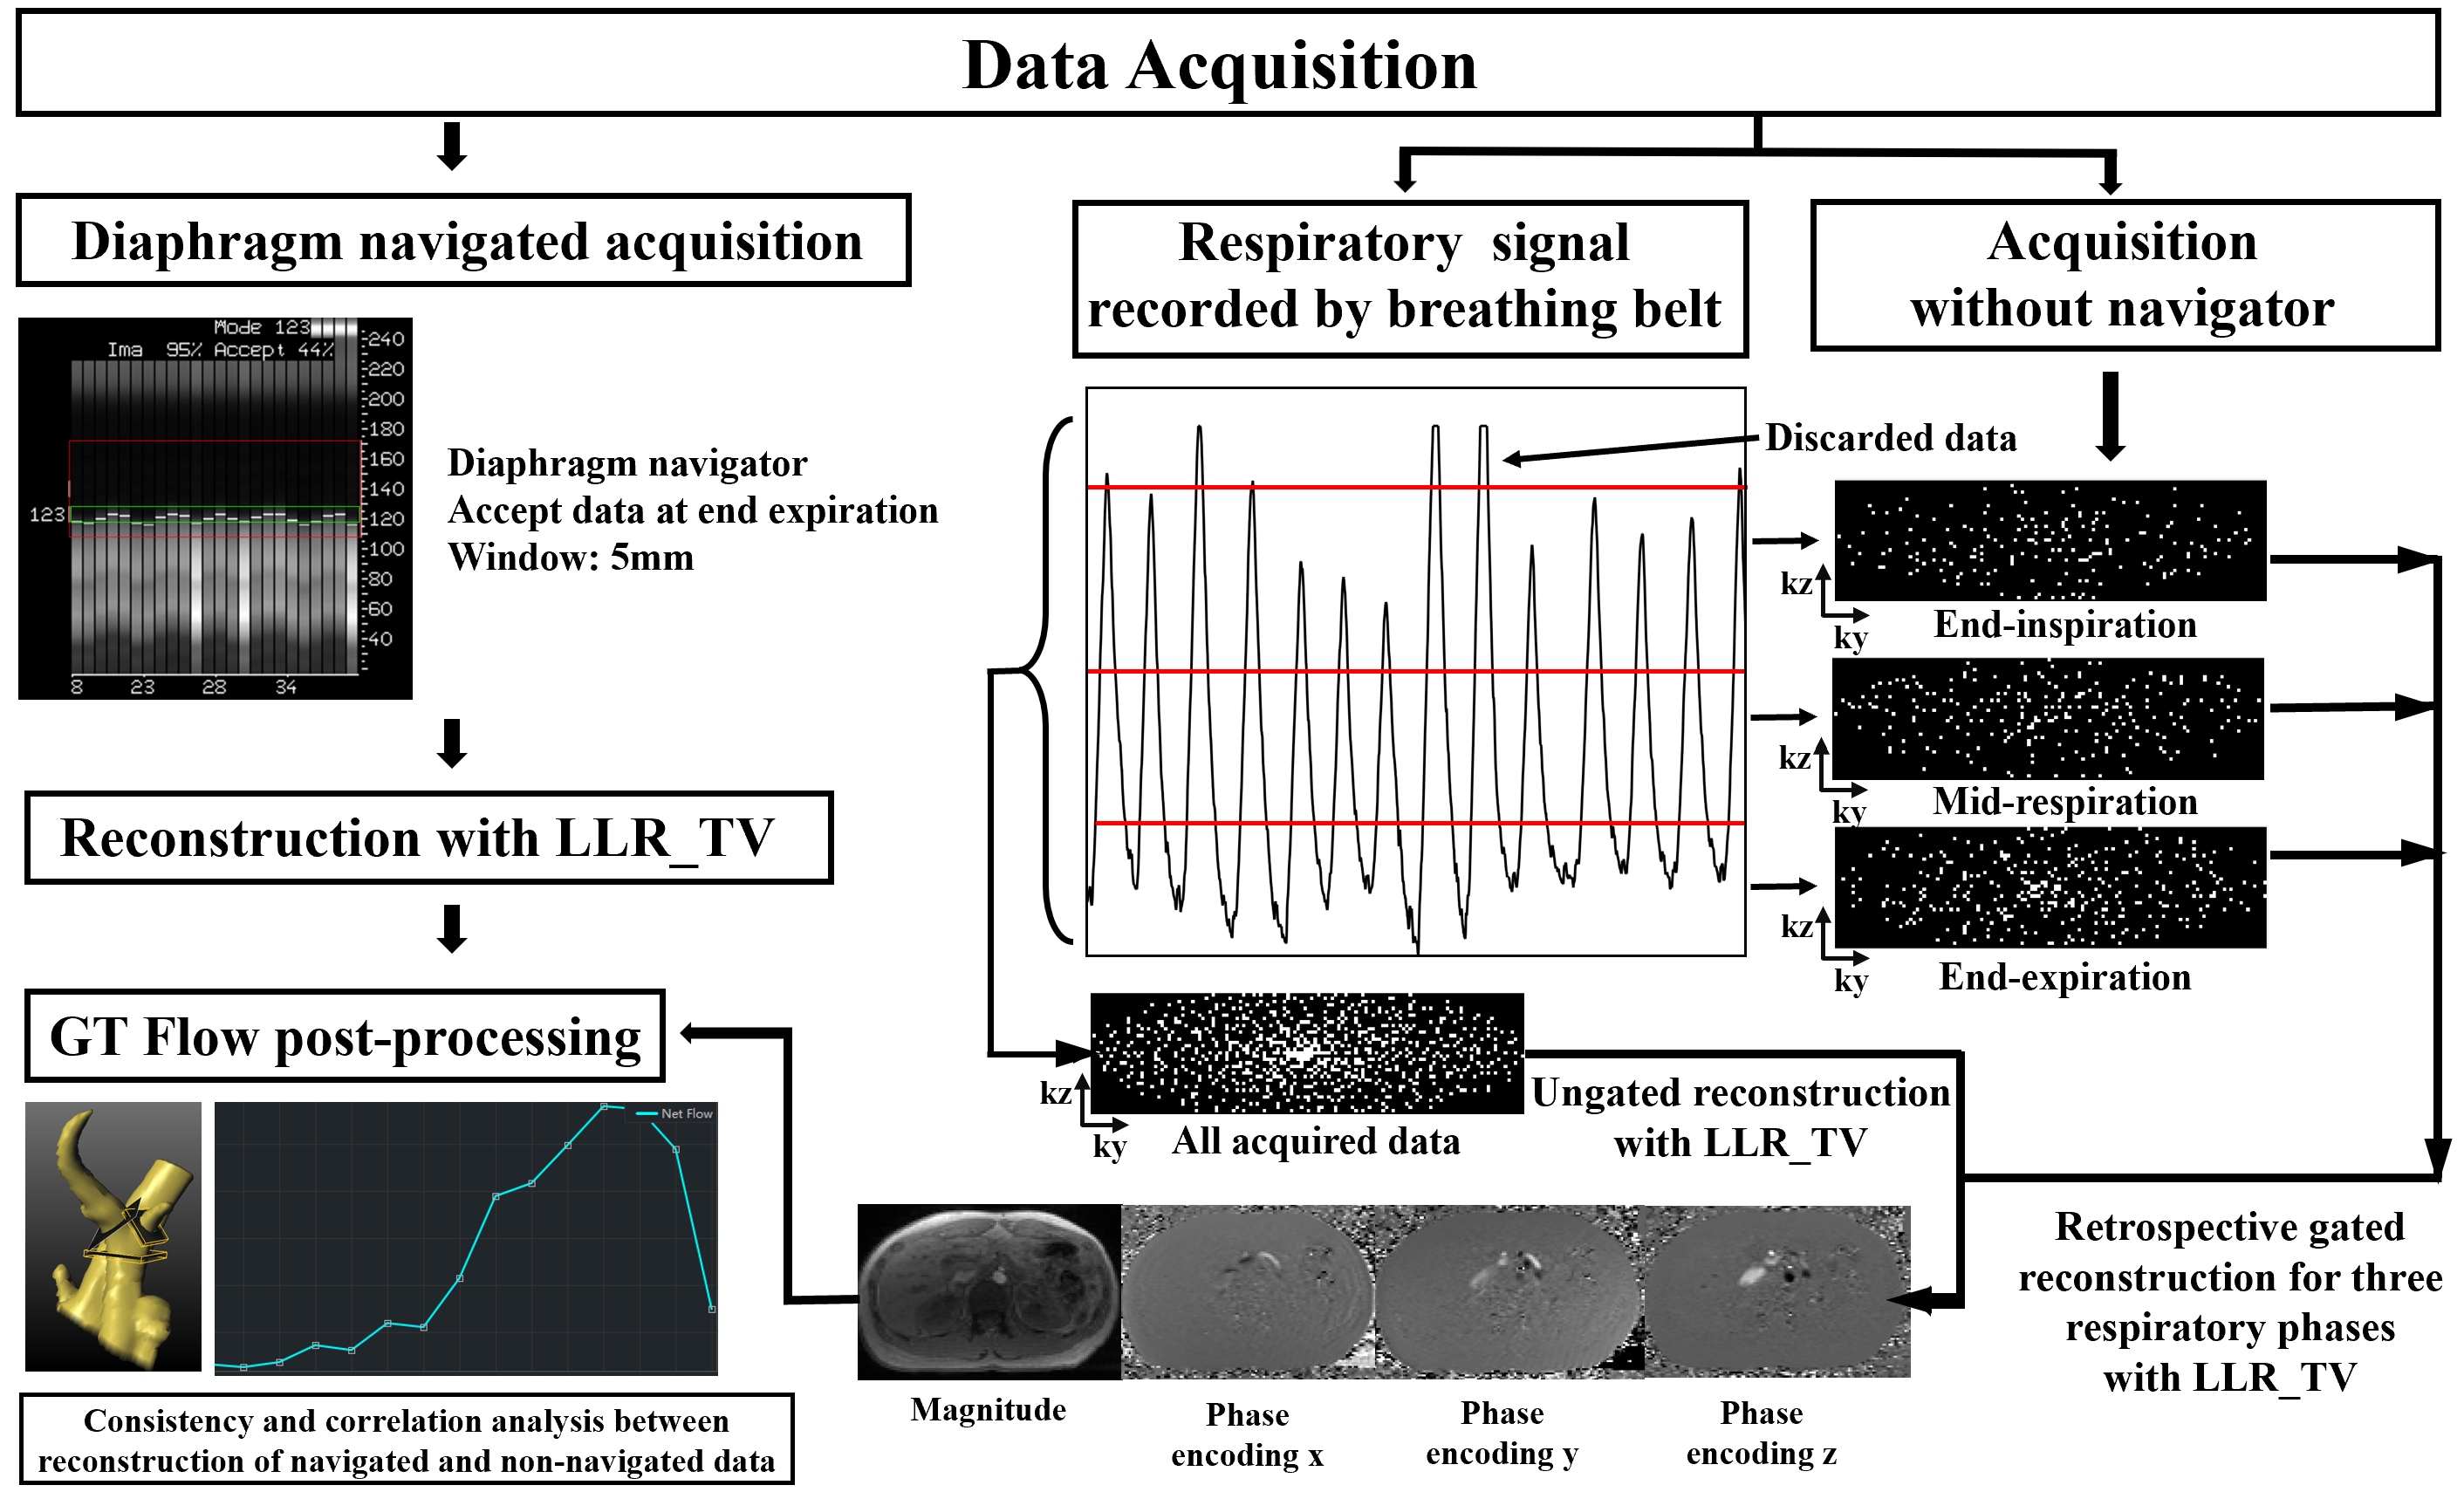
The workflow of the proposed scheme is illustrated in Figure1.Data Acquisition
MR imaging was performed on a 3T system (VIDA; Siemens Healthcare, Erlangen, Germany) equipped with 18-channel body and spine coil array. Seven recruited healthy volunteers (4 males, 3 females, age: 22-26 years old) underwent both a continuous acquisition for retrospectively data binning and a prospectively navigated 4D flow acquisition. The continuous acquisition used Cartesian compressed sensing (CS)‐accelerated 4‐point velocity encoding 4D flow sequence, with prospective peripheral pulse gating, and the data were collected without navigator control. The breathing signal was recorded simultaneously using a breathing belt. The other parameters include: orientation = transverse, TR/TE = 39.5/2.95ms, FOV = 430×272×96mm3 , resolution = 2.1×2.1×3mm3, velocity encoding = 50 cm/s, CS-accelerated factor = 5.7, temporal resolution = 39.5ms, reconstructed 17 cardiac frames, scan time: 5:57min. The prospectively navigated acquisition shared identical parameters with the first one, but incorporated a diaphragm navigator, accepting data only within 5 mm from the end of expiration (scan time: 10:31min). Navigation efficiency ranged from 55%-80%. The total acquisition time varies depending on the volunteer's heart rate.
Image Reconstruction
We extended the application of the locally low rank and finite difference (LLR_TV) [6] algorithm with ESPIRIT [7] to facilitate 4D reconstruction. Data acquired with navigator were reconstructed using 4D LLR_TV as the hemodynamics quantification reference. Data acquired during all breathing states were retrospectively separated into three phases (end-expiration, mid-respiration, end-inspiration) according to breathing signal. The data at the extreme end inspiration were discarded, and the division ensured a relatively uniform and random distribution of the data within each phase. Then the data from three phases (retrospectively gated) and ungated data (without phase separation) were reconstructed by LLR_TV.
Data Analysis
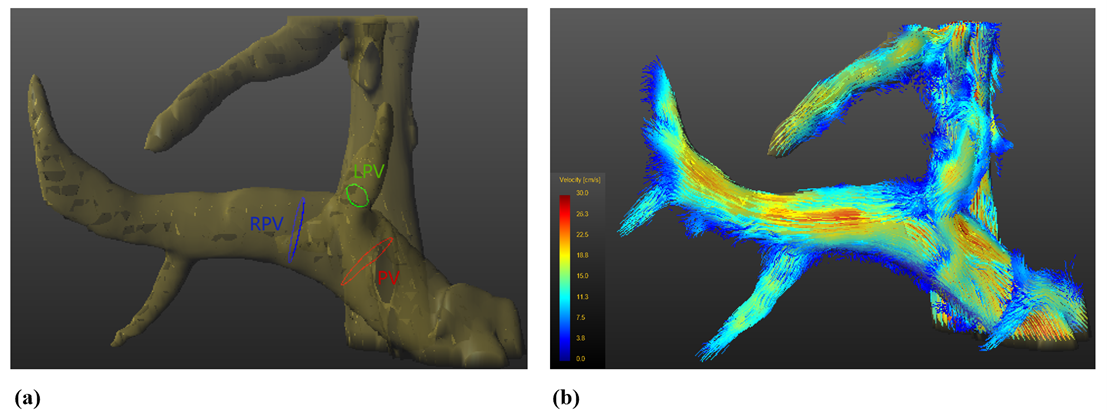
All reconstructed data were analyzed using GT flow software (GyroToolsLLC, version 3.2.17, Switzerland) for quantification of hemodynamic parameters. Three cross-sections were manually placed perpendicular to the portal vein (PV), right portal vein (RPV), and left portal vein (LPV), and the regions of interest (ROI) within these vessels were marked. Average velocity, peak velocity and net flow for these vessels were measured.
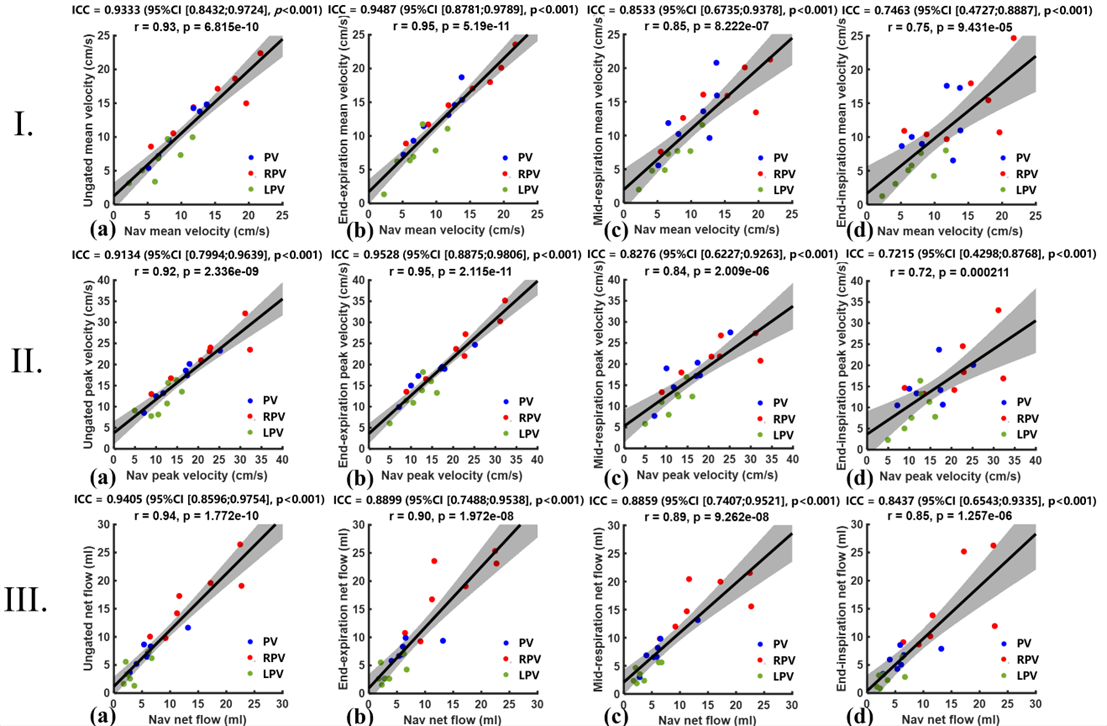
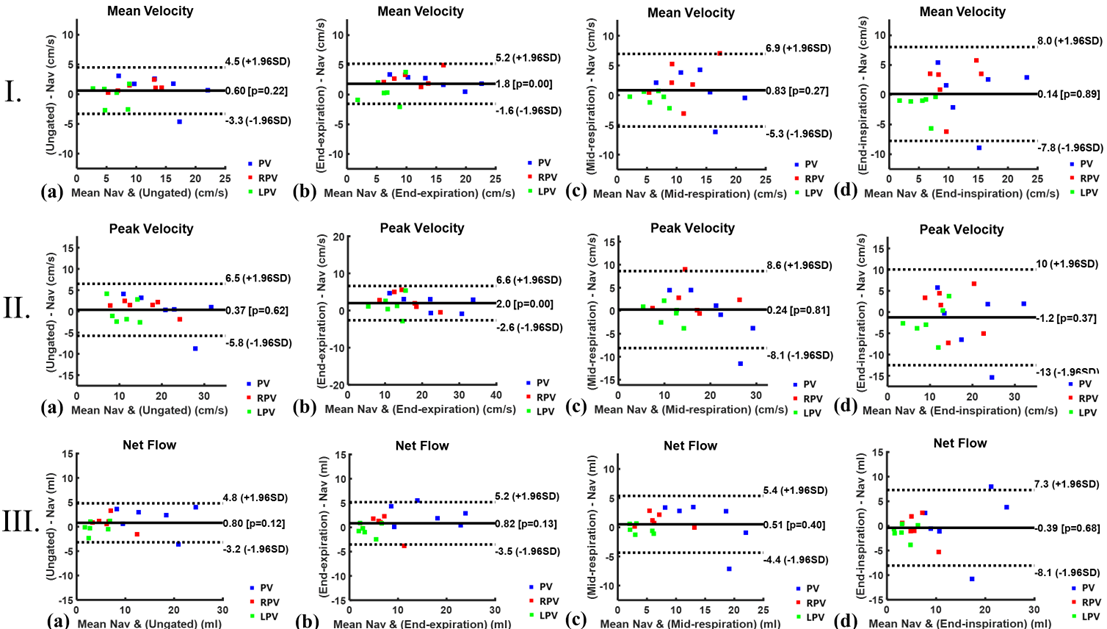
The hemodynamic correlation between reference and reconstruction results of our scheme was evaluated using the Spearman correlation coefficient. Bland‐Altman analysis was also conducted for the corresponding data.
Results
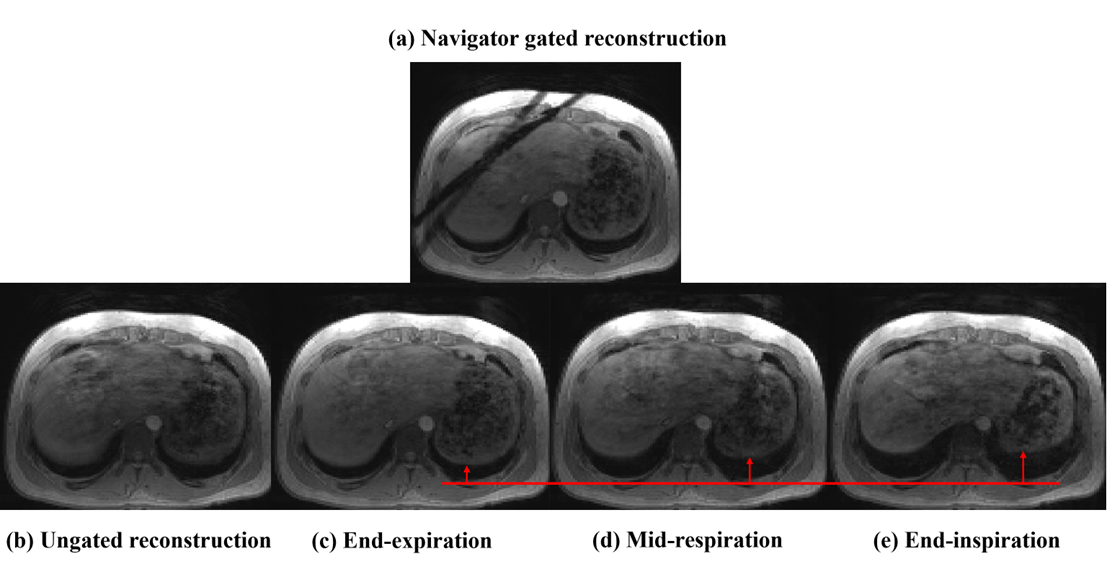
Figure 2 shows the five reconstructed magnitude images from one volunteer. The image reconstructed with navigated data exhibits minimal motion artifacts (Figure 2a), while the image of end-expiration demonstrates comparable image quality (Figure 2c). Noticeable motion artifacts can be observed in images reconstructed from data of the other two respiratory phases and ungated data (Figure 2bde).For hemodynamic quantification, although the images from ungated reconstruction were evidently affected by motion artifacts, all the metrics showed high correlation when compared to the reference (first column of Figure 3). For retrospective gated reconstruction, the end-expiration phase showed the highest correlation with the reference (second column of Figure 3), while the other two phases showed lower correlation. A greater consistency between end-expiration phase and reference can also be observed in Bland-Altman plots as shown in Figure 4.
Figure 5 demonstrates an example of post-processing results.
Discussion
The extracted end-expiration phase demonstrates promising image quality and quantification results and could be optimal for retrospective gated PC flow acquisitions. Motion correction will be necessary to fully utilize the data from mid-respiration and end-inspiration phases, which suffer from more motion artifacts and lower quantitative consistency. Despite the presence of motion artifacts, ungated flow results without respiratory phase separation also exhibit high correlation with the reference, which may due to the contribution from more sufficient data and effective removal of artifacts by the LLR_TV algorithm.Conclusion
The proposed hepatic 5D flow scheme achieved consistently high image quality and quantitative metrics, compared with those of diaphragm navigated results, and effectively shorten acquisition time.Acknowledgements
No acknowledgement found.References
[1] Taourel P, Blanc P, Dauzat M, et al. Doppler study of mesenteric, hepatic, and portal circulation in alcoholic cirrhosis: relationship between quantitative Doppler measurements and the severity of portal hypertension and hepatic failure. Hepatology 1998;28(4):932–936. 3. Zekanovic D, Ljubicic N, Boban M, et al. Doppler ultrasound of hepatic and system hemodynamics in patients with alcoholic liver cirrhosis. Dig Dis Sci 2010;55(2):458–466.
[2] Hyodo R, Takehara Y, Mizuno T, et al. Assessing the complicated venous hemodynamics and therapeutic outcomes of Budd-Chiari syndrome with respiratory-gated 4D flow MR imaging during the expiratory and inspiratory phases[J]. Magnetic Resonance in Medical Sciences, 2023, 22(1): 1-6.
[3] Hyodo R, Takehara Y, Mizuno T, et al. Portal vein stenosis following liver transplantation hemodynamically assessed with 4D-flow MRI before and after portal vein stenting[J]. Magnetic Resonance in Medical Sciences, 2021, 20(3): 231-235.
[4] Oechtering T H, Roberts G S, Panagiotopoulos N, et al. Clinical applications of 4D flow MRI in the portal venous system[J]. Magnetic Resonance in Medical Sciences, 2022, 21(2): 340-353.
[5]Bane O, Stocker D, Kennedy P, et al. 4D flow MRI in abdominal vessels: prospective comparison of kt accelerated free breathing acquisition to standard respiratory navigator gated acquisition[J]. Scientific reports, 2022, 12(1): 19886.
[6]Otazo R, Candes E, Sodickson D K. Low‐rank plus sparse matrix decomposition for accelerated dynamic MRI with separation of background and dynamic components[J]. Magnetic resonance in medicine, 2015, 73(3): 1125-1136.
[7]Uecker M, Lai P, Murphy M J, et al. ESPIRiT—an eigenvalue approach to autocalibrating parallel MRI: where SENSE meets GRAPPA[J]. Magnetic resonance in medicine, 2014, 71(3): 990-1001.
Figures