4870
Estimation of cerebral blood flow using the pulse wave amplitude in brain MRI1Institute for Diagnostic and Interventional Radiology, Hannover Medical School, Hannover, Germany, 2Institute for Diagnostic and Interventional Neuroradiology, Hannover Medical School, Hannover, Germany
Synopsis
Keywords: Perfusion, Quantitative Imaging, CBF, perfusion, quantification, flow-related enhancement, pCASL, imaging speed optimization
Motivation: Flow-related enhancement (FREE)-MRI could be used to generate phase-resolved perfusion-weighted brain maps.
Goal(s): To test cerebral blood flow (CBF) estimation using the pulse wave amplitude in FREE-MRI. Secondly, the potential for acceleration was evaluated retrospectively.
Approach: Twenty-four healthy subjects had cerebral MRI with balanced steady-state free precession imaging (FREE-MRI) and with pCASL-MRI for comparison.
Results: The value distribution of the estimated CBF showed disparity of the values between both techniques in the histogram. A Kolmogorov-Smirnov test confirmed differing probability distributions.
The approximated CBF from FREE-MRI remained stable until 50% of the data was reconstructed and reveals large potential acceleration.
Impact: The proposed technique allows a rough approximation of the cerebral blood flow. Further sequence optimization must be achieved to improve the measurement of lowly perfused tissues. Nevertheless, the technique offers large potential for imaging speed optimization.
Introduction
Flow phenomena in magnetic resonance imaging are being exploited by numerous techniques to display vessels, to measure flow or to quantify perfusion without using additional contrast media (1–3). Flow-related enhancement (FREE) is exploited in time-of-flight-angiographies and for functional lung imaging (4). Nevertheless, its use for other organs with less pulsatility should be evaluated more thoroughly. Pursuing a surrogate of tissue perfusion similar to color Doppler in ultrasound, it is essential to test the similarity with true tissue perfusion. Firstly, this study evaluates the feasibility of estimating the cerebral blood flow (CBF) using the pulse wave amplitude in comparison to the reference technique pseudo-continuous ASL-MRI (pCASL-MRI). Secondly, the potential to accelerate imaging speed by data reduction is tested retrospectively.Methods
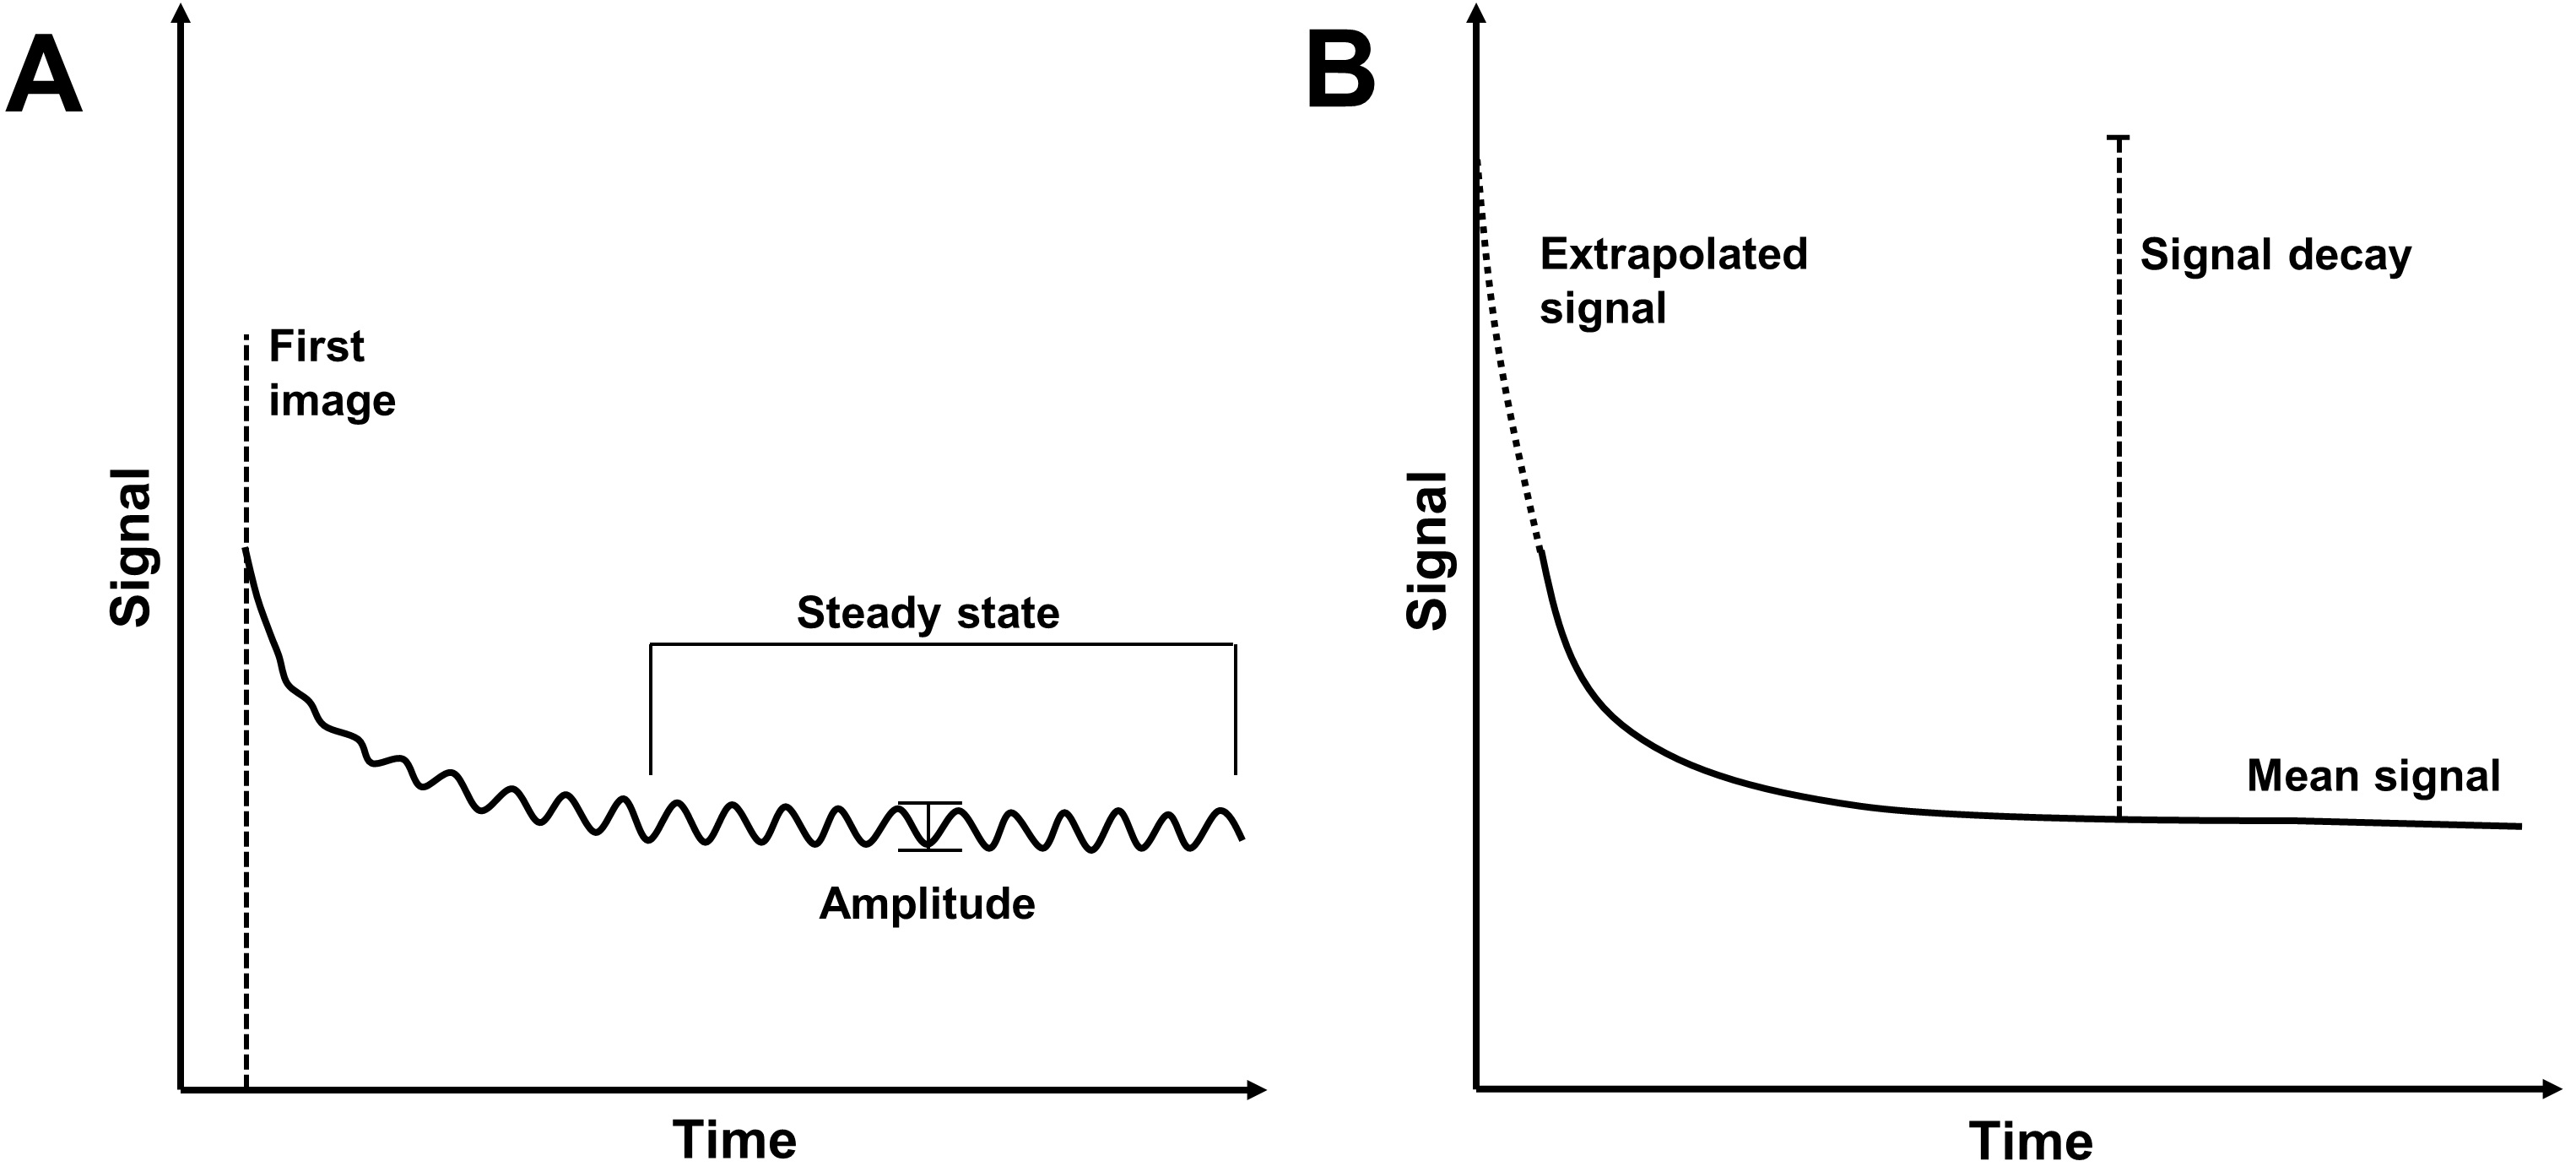
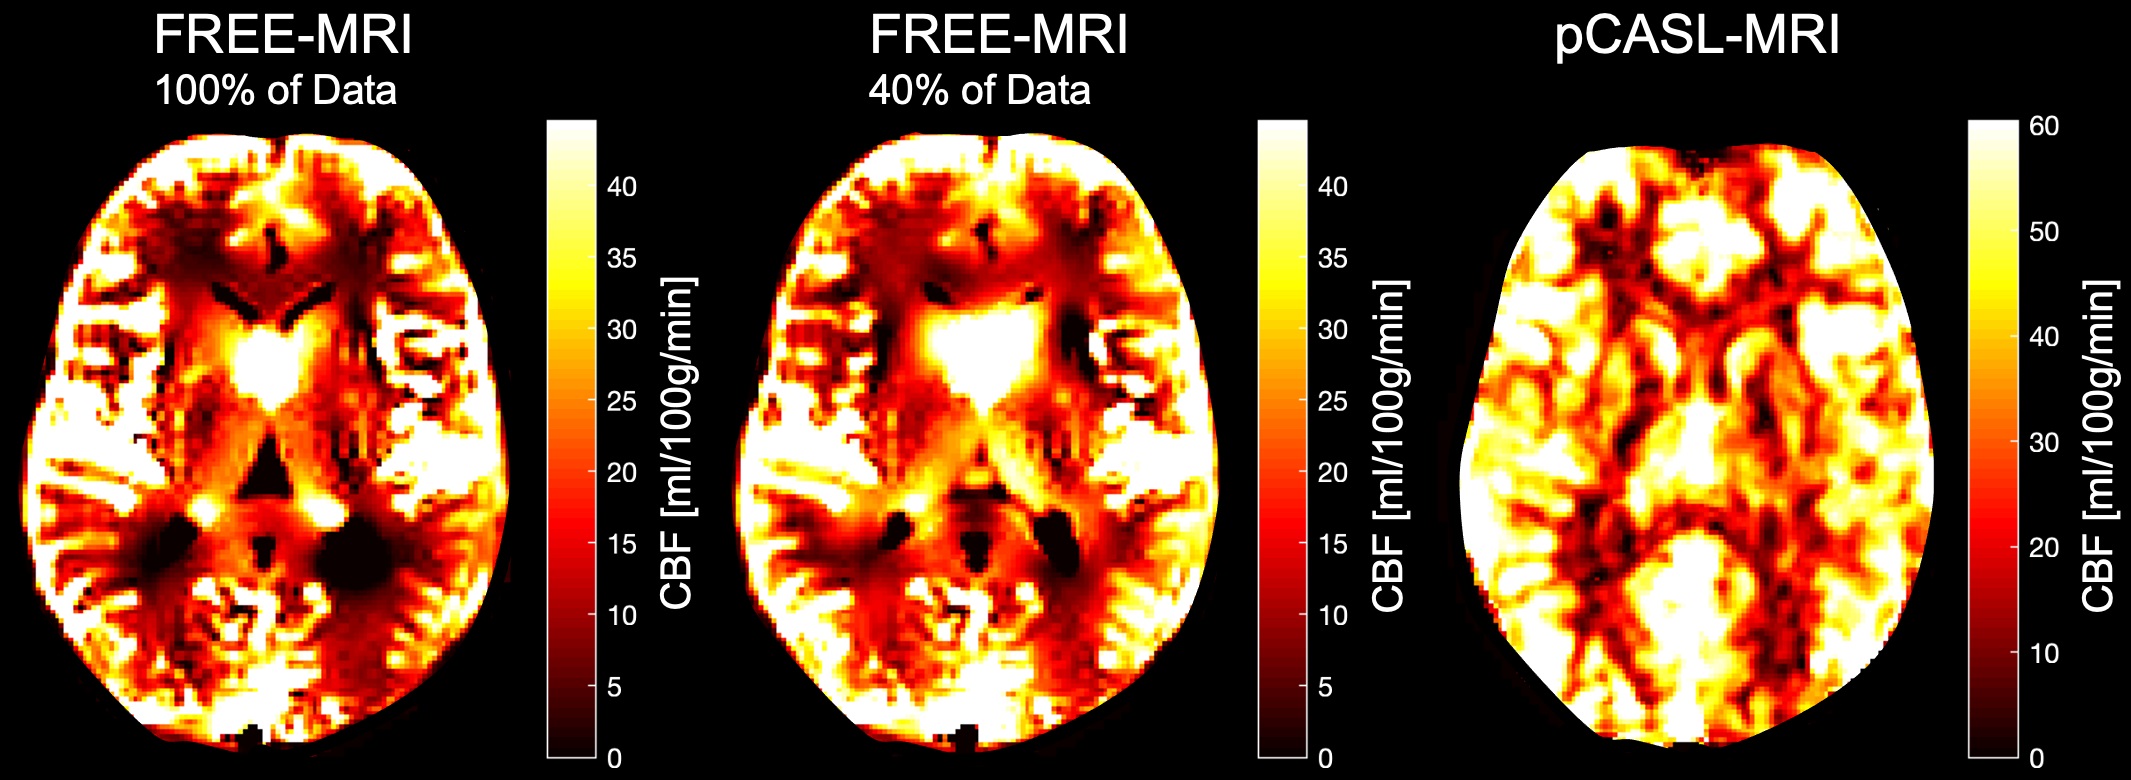
Twenty-four probands between 20-61 years without any neurological disease had MRI at 3T. Imaging was performed with a balanced steady-state free precession sequence for FREE-MRI and with 2D-echo-planar pCASL-MRI. Resolution of both sequences: matrix 128x128, field-of-view 340x340 mm2, slice thickness 5mm. FREE-MRI:TR 3.6ms,TE 1.6ms,flip angle 60°,500 repetitions,acquisition time 3:50min. 2D-pCASL-MRI:TR 4900ms,TE 25ms,echo spacing 0.61ms,flip angle 90°,45 measurements,labeling duration 1800 ms,post labeling delay 1800ms,acquisition time 3:42min. The k-space lines were sorted and 15 images across one composed cardiac cycle were reconstructed. A reduction of the last k-space line-averages in steps of 10% was done retrospectively. Pulse wave amplitude maps were calculated by subtracting the image of the heart cycle with minimal average signal from the one with maximum average signal. Perfusion contrast was defined as amplitude (FREE-MRI) or subtraction (pCASL-MRI) divided by mean signal. The cerebral blood flow (CBF) in each voxel was then estimated by the following formula (5) (Figure 1): CBF=blood-fraction x exchange-fraction x 1/time per hearbeat x scaling factor.The scaling factor was chosen to minimize the difference between the mean values of FREE- and pCASL-MRI. pCASL-MRI was quantified using the BASIL toolbox v.6.0.6.4 (6) from the FSL-library (7–9). Figure 2 shows representative CBF-maps.
Results
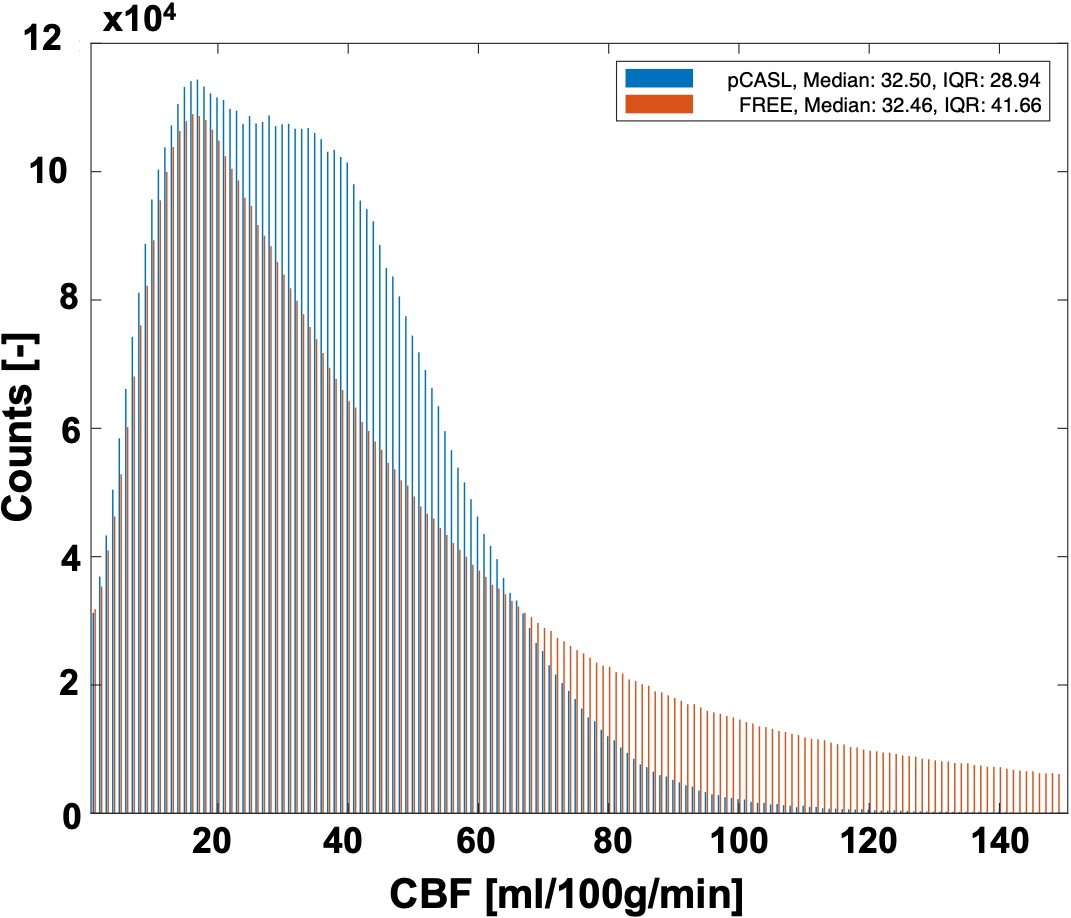
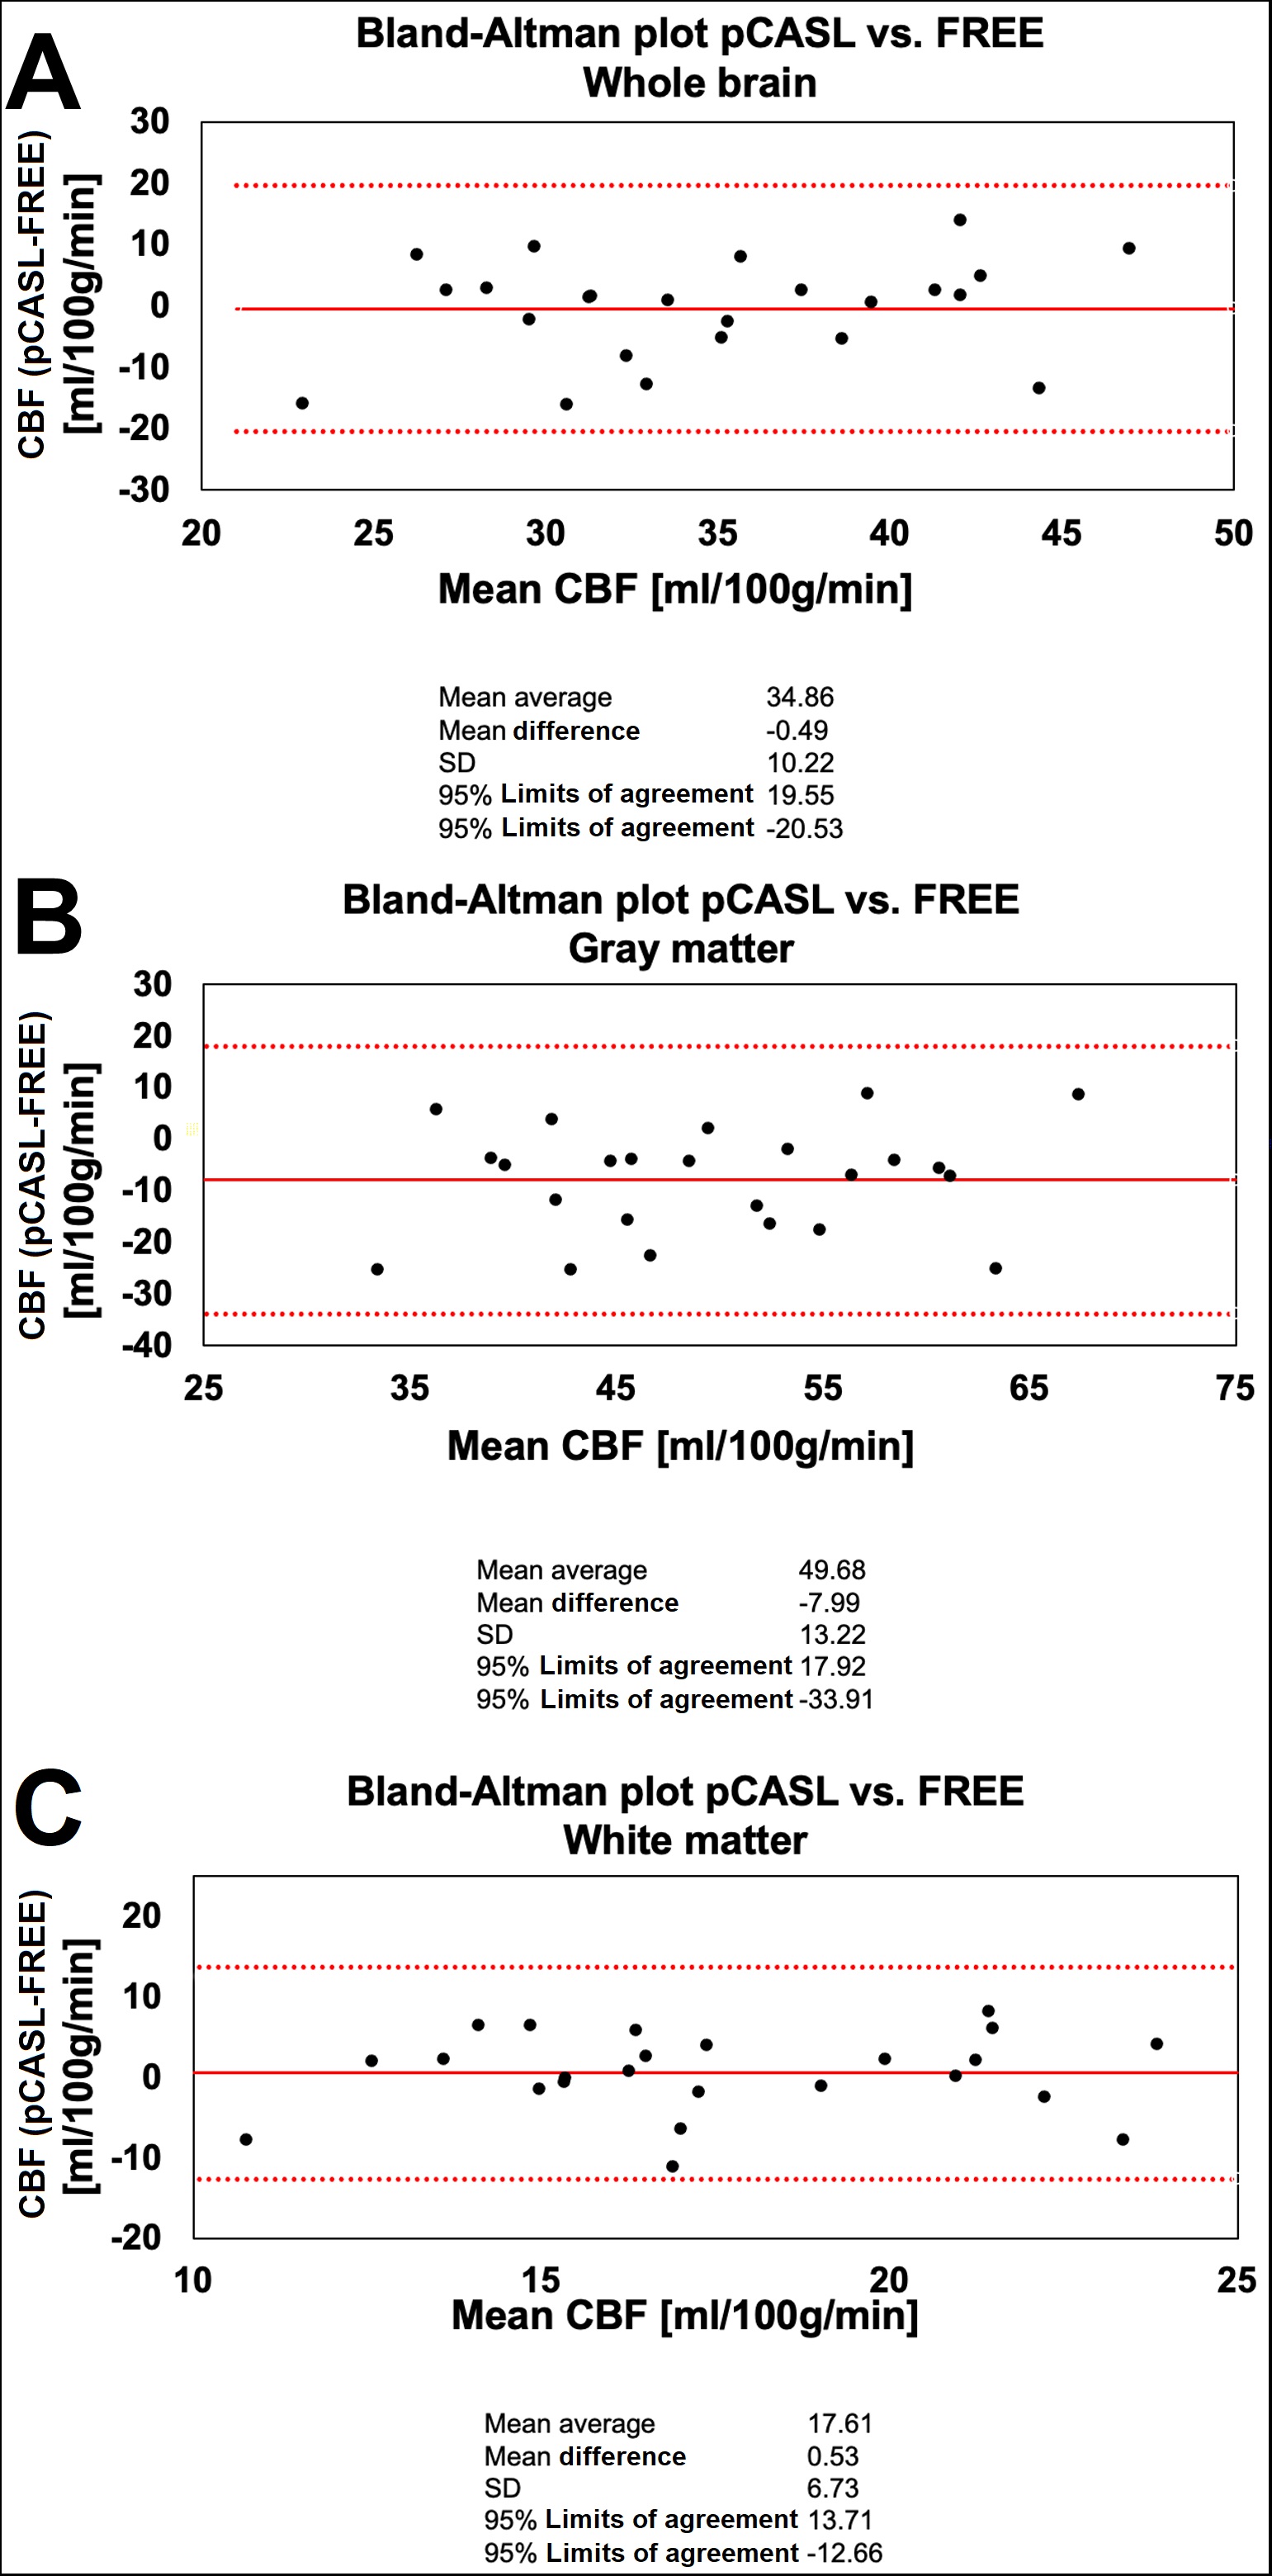
The distribution of the estimated CBF from FREE-MRI showed high overlap with pCASL-MRI in the range between 0-20 ml/100g/min (Figure 3), but with a higher frequency between 20-60 ml/100g/min using pCASL-MRI and an increased frequency >60 ml/100g/min applying FREE-MRI. The Kolmogorov-Smirnov test confirmed differing probability distributions (P = 0.62).In the Bland-Altman plot of the whole brain values of all subjects, the mean values were almost equal with a mean average of 34.86 ml/100g/min and a mean difference of -0.49 ml/100g/min,(P=0.21)(Figure 4A). For gray matter, the mean average was 49.68 ml/100g/min with a mean difference of -7.99 ml/100g/min,(P<0.01)(Figure 4B). For white matter, the mean average was 17.61 ml/100g/min with a mean difference of 0.53 ml/100g/min,(P=0.97)(Figure 4C).
The approximated CBF, perfusion contrast and the global and voxel wise correlation coefficients towards pCASL-MRI remained stable until only 50% of the data was reconstructed (Table 1). Values from using 40% of the data increased significantly compared to 90% or more (P ≤ 0.05).
Discussion
In this study, an attempt was made to estimate CBF maps using the amplitude of flow-related enhancement caused by the pulse wave and to test the redundancy of the data pursuing acceleration. Despite a high visual similarity of the CBF maps of FREE-MRI and pCASL-MRI in Figure 2, marked differences between both techniques were revealed. While pCASL-MRI indicated two peaks – representing gray and white matter voxels – FREE-MRI presented an exponential decline after a peak at around 20 ml/100g/min. These observations lead to the assumption that the CBF estimated via FREE-MRI is overestimated in highly vascularized regions and opens the question whether the pulse wave is currently detectable within the white matter. Although there is evidence of pulsatility within the microvasculature (10–12), the amplitude in the white matter might be too small. Therefore, FREE-MRI should only be interpreted as CBF through each voxel, rather than CBF within each voxel similarly to the color mode of ultrasound. Regarding speed optimization, our results indicated the potential to reduce imaging time by 50%. However, increasing noise may hamper the detection of very small signal variations and artificially increase the perfusion contrast. The limitation of our study is the relatively small cohort of exclusively healthy probands. Furthermore, no 3D FREE-MRI has been developed yet. In conclusion, FREE-MRI currently does not present a competitive alternative to measure local tissue perfusion compared to pCASL-MRI. However, it allows a rough estimation of the CBF and offers the possibility to indicate highly vascularized regions. This study was important to demonstrate the current limitations regarding the detection of lowly perfused tissue like white matter and to focus on further sequence optimization in the future.Acknowledgements
The authors would like to express their gratitude to the radiographers from the Department of Radiology for their support with the MR measurements and patient care.References
1. Handelsman H. Magnetic resonance angiography: vascular and flow imaging. Health Technol. Assess. (Rockv). 1994:1–20.
2. Bryant DJ, Payne JA, Firmin DN, Longmore DB. Measurement of Flow with NMR Imaging Using a Gradient Pulse and Phase Difference Technique. J. Comput. Assist. Tomogr. 1984;8:588–593 doi: 10.1097/00004728-198408000-00002.
3. Borogovac A, Asllani I. Arterial spin labeling (ASL) fMRI: Advantages, theoretical constrains and experimental challenges in neurosciences. Int. J. Biomed. Imaging 2012;2012:1–13 doi: 10.1155/2012/818456.
4. Voskrebenzev A, Gutberlet M, Klimeš F, et al. Feasibility of quantitative regional ventilation and perfusion mapping with phase‐resolved functional lung (PREFUL) MRI in healthy volunteers and COPD, CTEPH, and CF patients. Magn. Reson. Med. 2018;79:2306–2314 doi: 10.1002/mrm.26893.
5. Glandorf J, Klimeš F, Behrendt L, et al. Perfusion quantification using voxel-wise proton density and median signal decay in PREFUL MRI. Magn. Reson. Med. 2021;86:1482–1493 doi: 10.1002/mrm.28787.
6. Chappell MA, Groves AR, Whitcher B, Woolrich MW. Variational Bayesian Inference for a Nonlinear Forward Model. IEEE Trans. Signal Process. 2009;57:223–236 doi: 10.1109/TSP.2008.2005752.
7. Woolrich MW, Jbabdi S, Patenaude B, et al. Bayesian analysis of neuroimaging data in FSL. Neuroimage 2009;45:S173–S186 doi: 10.1016/j.neuroimage.2008.10.055.
8. Smith SM, Jenkinson M, Woolrich MW, et al. Advances in functional and structural MR image analysis and implementation as FSL. Neuroimage 2004;23:S208–S219 doi: 10.1016/j.neuroimage.2004.07.051.
9. Jenkinson M, Beckmann CF, Behrens TEJ, Woolrich MW, Smith SM. FSL. Neuroimage 2012;62:782–790 doi: 10.1016/j.neuroimage.2011.09.015.
10. Mahy IR, Shore AC, Smith DR, Tooke JE. Capillary Pulse Waveform in Aortic Stenosis. Int. J. Microcirc. 1994;14:257–261 doi: 10.1159/000178837.
11. Shore AC, Sandeman DD, Tooke JE. Capillary pressure, pulse pressure amplitude, and pressure waveform in healthy volunteers. Am. J. Physiol. Circ. Physiol. 1995;268:H147–H154 doi: 10.1152/ajpheart.1995.268.1.H147.
12. Seki J, Satomura Y, Ooi Y, Yanagida T, Seiyama A. Velocity profiles in the rat cerebral microvessels measured by optical coherence tomography. Clin. Hemorheol. Microcirc. 2006;34:233–9.
Figures