4868
Extracting Cerebral Perfusion Signal from BOLD fMRI via Deep Learning1University of Maryland School of Medicine, Baltimore, MD, United States
Synopsis
Keywords: Arterial Spin Labelling, Arterial spin labelling
Motivation: Cerebral blood flow (CBF) is a fundamental physiological measure indicating regional brain function and vascular conditions via arterial spin labeling (ASL) perfusion MRI, but ASL sequences is limited.
Goal(s): Blood-oxygen-level-dependent (BOLD) fMRI is known to be a function of CBF and other physiological sources. We try to extract CBF information from BOLD signal.
Approach: We proposed a convolutional neural network to extract CBF from BOLD fMRI signal.
Results: We confirmed the possibility of using supervised deep learning model to extract CBF from BOLD fMRI from independent sequences.
Impact: Deep learning enables the estimation of CBF signal directly from the prevalent BOLD fMRI images, offering an alternative to the ASL sequence that is not universally available across research facilities.
Introduction
Cerebral blood flow (CBF) is a fundamental physiological measure indicating regional brain function as well as brain vascular conditions [1]. CBF can be measured with arterial spin labeling (ASL) perfusion MRI [2], but many research sites do not have access to the state-of-art ASL sequences. By contrast, the blood-oxygen-level-dependent (BOLD) fMRI has been a standard neuroimaging research tool and is widely available. An important question is then whether we can extract CBF information from BOLD signal, which is known to be a function of CBF and other physiological sources. Previous strategies rely on simultaneous measurement of other BOLD constituents such as cerebral metabolism rate of oxygen (CMRO2) and cerebral blood volume (CBV) [3], [4], which however is difficult to implement in routine practice. We propose to attack this problem through supervised machine learning. We had previously demonstrated the feasibility [5] using simultaneous ASL CBF and BOLD signal from a dual-echo ASL sequence [6], but dual-echo ASL is rarely used because of the long readout and low temporal resolution. This study aims to extract CBF from BOLD images acquired with regular BOLD fMRI sequences through a deep learning (DL) based BOLD to CBF projection algorithm (B2C-Net).Methods
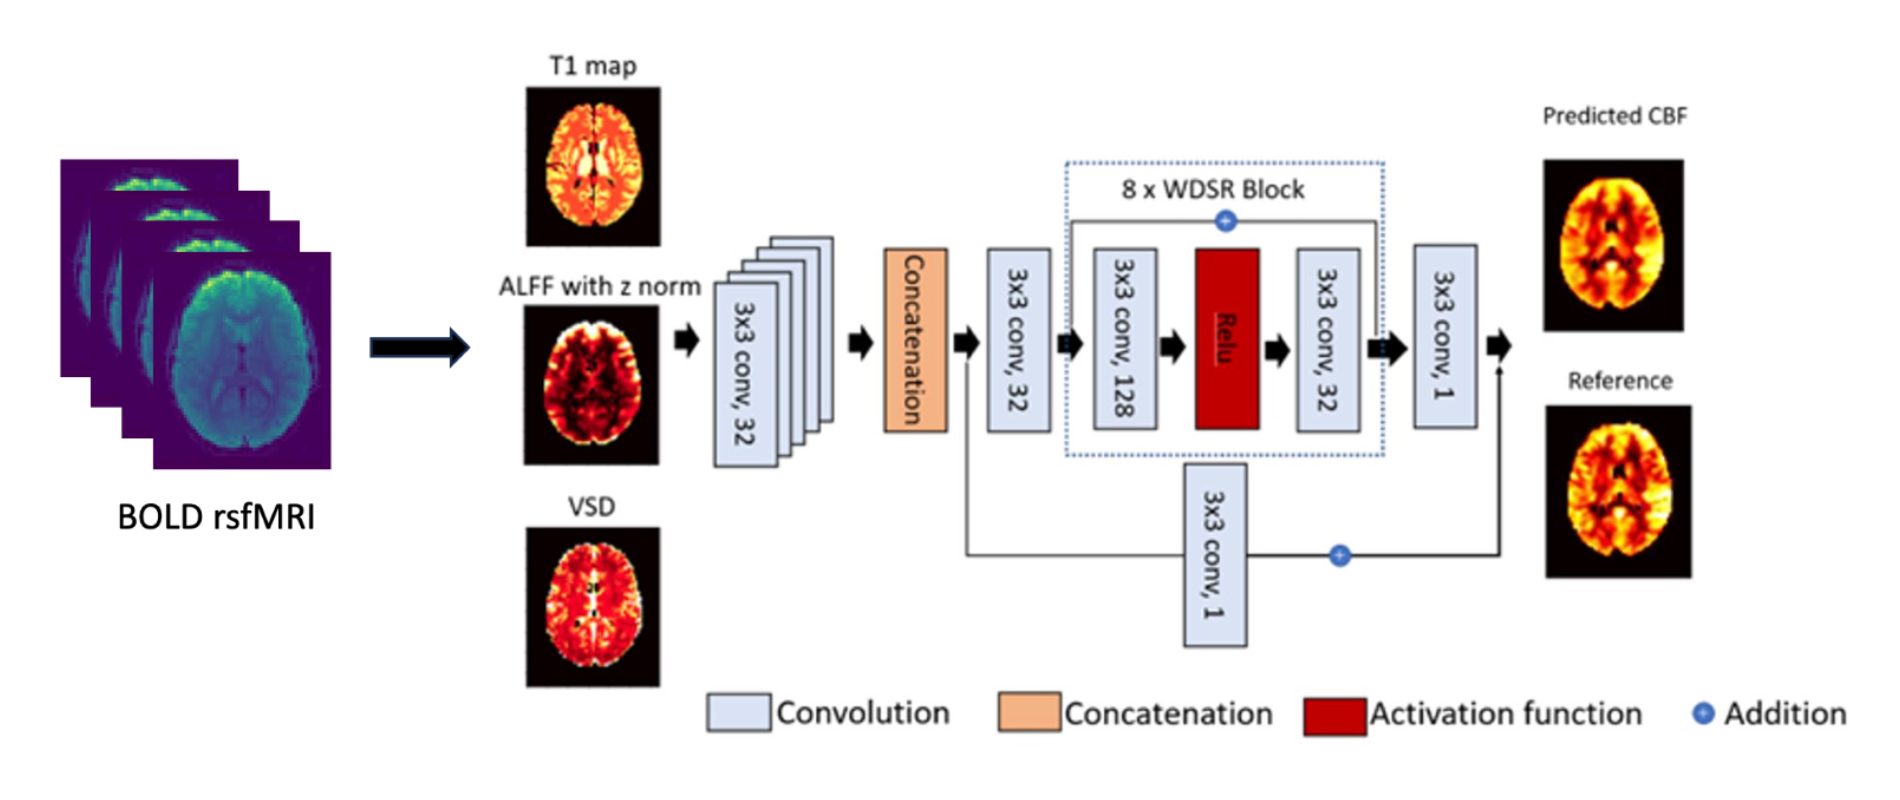
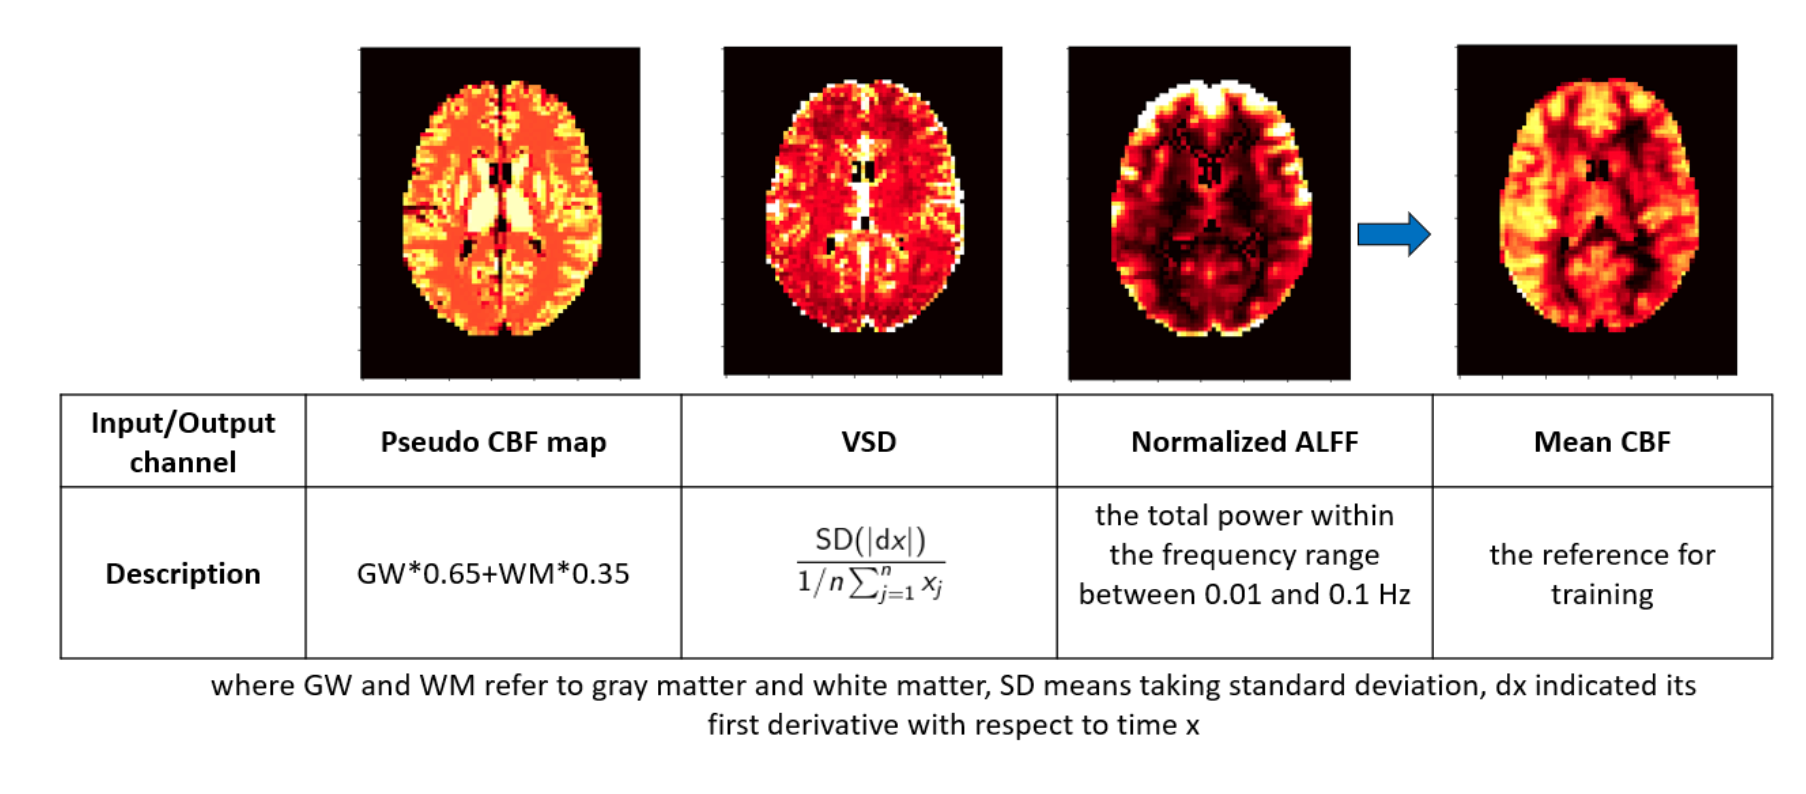
Resting state BOLD fMRI, ASL MRI, and structural MRI were acquired from the Philadelphia Neurodevelopmental Cohort (PNC) dataset [7]. 500 subjects were included. BOLD and ASL images have the same within-plane resolution of 3.44x3.44 mm2 and the same field of view but a different slice thickness (7 and 3.44 for ASL and BOLD, respectively). Other ASL MRI acquisition parameters were: labeling time/post-label delay=1.5/1.5 s, number of C/L pairs =40, 45, or 50. BOLD data contains 140 images. Image processing was performed using ASLtbx [8] following the steps used in [9]. BOLD images and ASL CBF images were registered into the MNI space.Figure 1 shows the B2C-Net architecture adopted from [10] and [11]. Input of B2C-Net contains a few feature images shown in Figure 2: a pseudo CBF map generated from the grey matter (GM) and white matter (WM) density maps segmented from the structural MRI. This map is to enhance the GM/WM contrast; the variability of the successive difference (VSD) of the BOLD images; the normalized amplitude of low-frequency fluctuation (ALFF) of the BOLD images [12]. Both VSD and ALFF are calculated from BOLD fMRI and have been shown to be related to CBF. Among 500 subjects, 300 of them were randomly selected for training, 100 for validation, and the rest 100 for testing. The size of an image is: matrix = 65×77×65. For each subject, we extracted axial slices from 26th to 45th slice as high-quality training data. The training process took 300 epochs with a batch size of 4. The adaptive moment estimation (Adam) [13] optimizer with an initial learning rate of 0.001 was used to train the network. The original model (B2C-Net-V1) employed the L2 norm for its loss function. To improve model performance, we transitioned to an L1 loss function and incorporated the Structural Similarity Index Measure (SSIM) for enhanced detail capture. Furthermore, we selected a set of qualitative training samples and normalized the inputs to optimize the second iteration of the model, dubbed B2C-Net-V2. For quantitative assessment, we utilized three metrics: the SSIM, peak signal-to-noise ratio (PSNR), and mean absolute error (MAE), to evaluate the model's efficacy.
Results
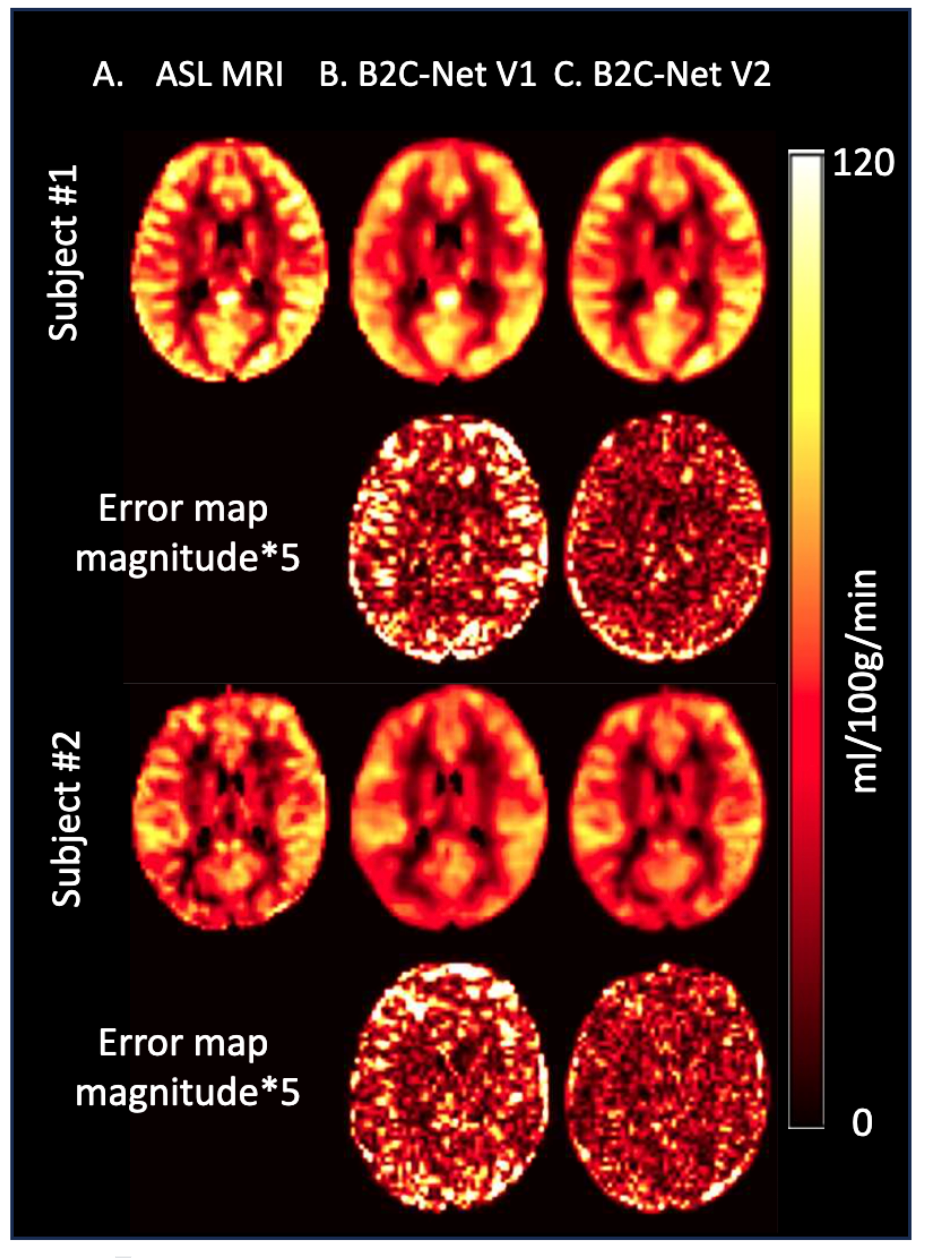
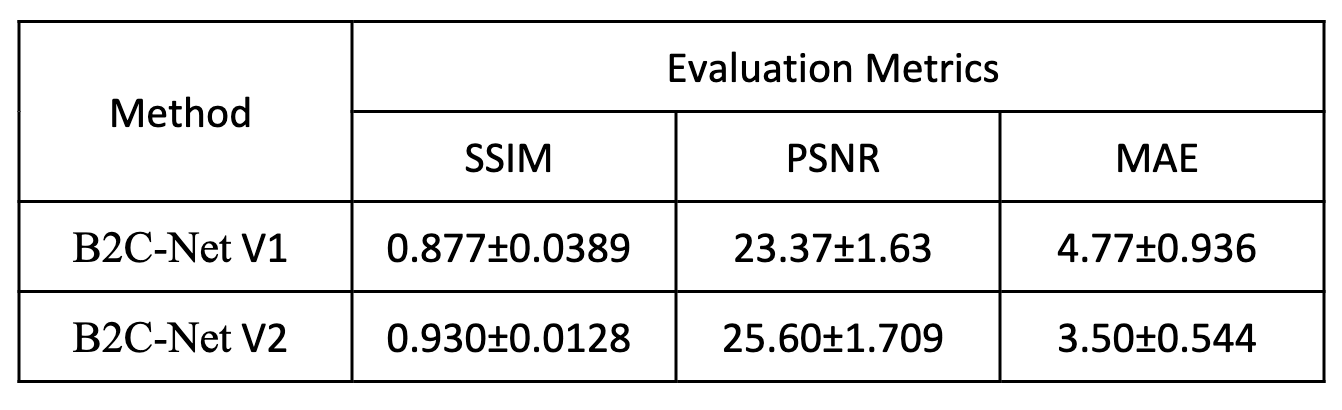
Figure 3 displays the outcomes from the B2C-Net V1 and V2 for two subjects, alongside an error map (multiplied by 5 for better visualization) from the test dataset. The reference CBF was derived from ASL MRI via a conventional processing technique [7]. Both versions of B2C-Net yielded CBF maps that generally align with the reference, albeit with some regional differences. B2C-Net V2, in particular, revealed a higher level of detail compared to its predecessor. Correspondingly, Table 1 details three evaluative metrics—SSIM, PSNR, and MAE—applied to B2C-Net's performance. Consistent with the visual observations from Figure 3, B2C-Net Version 2 demonstrated superior performance across all metrics.Discussion and Conclusion
In this pilot study, we explored the possibility of using supervised DL to extract CBF from BOLD fMRI from independent sequences. Our preliminary results showed good learning results of the proposed B2C-Net. The performance can be further improved by using larger training samples and data augmentation strategies. Nevertheless, this preliminary study serves as an initial step to demonstrate the feasibility of BOLD to CBF projection though substantial future work must be performed to establish the full reliability and generalizability of the B2C-Net.Acknowledgements
This project was supported by NIH grants: R01AG060054, R01AG070227, R01EB031080-01A1, P41EB029460-01A1, R21AG082345, 1R21AG080518-01A1, and 1UL1TR003098.References
[1] J. A. Detre, D. C. Alsop, L. R. Vives, L. Maccotta, J. W. Teener, and E. C. Raps, “Noninvasive MRI evaluation of cerebral blood flow in cerebrovascular disease,” Neurology, vol. 50, no. 3, pp. 633–641, 1998.
[2] J. A. Detre, J. S. Leigh, D. S. Williams, and A. P. Koretsky, “Perfusion imaging,” Magn Reson Med, vol. 23, no. 1, pp. 37–45, 1992.
[3] T. L. Davis, K. K. Kwong, R. M. Weisskoff, and B. R. Rosen, “Calibrated functional MRI: mapping the dynamics of oxidative metabolism,” Proceedings of the National Academy of Sciences, vol. 95, no. 4, pp. 1834–1839, 1998.
[4] N. P. Blockley, V. E. M. Griffeth, A. B. Simon, and R. B. Buxton, “A review of calibrated blood oxygenation level-dependent (BOLD) methods for the measurement of task-induced changes in brain oxygen metabolism,” NMR Biomed, vol. 26, no. 8, pp. 987–1003, 2013.
[5] D. Xie et al., “BOLD fMRI-Based Brain Perfusion Prediction Using Deep Dilated Wide Activation Networks,” Lecture Notes in Computer Science (including subseries Lecture Notes in Artificial Intelligence and Lecture Notes in Bioinformatics), vol. 11861 LNCS, pp. 373–381, 2019, doi: 10.1007/978-3-030-32692-0_43.
[6] D. D. Shin, T. T. Liu, E. C. Wong, A. Shankaranarayanan, and Y. Jung, “Pseudocontinuous arterial spin labeling with optimized tagging efficiency.,” Magn Reson Med, vol. 68, no. 4, pp. 1135–1144, Oct. 2012, doi: 10.1002/mrm.24113.
[7] T. D. Satterthwaite, M. A. Elliott, K. Ruparel, J. Loughead, K. Prabhakaran, M. E. Calkins, R. Hopson, C. Jackson, J. Keefe, M. Riley, and others, “Neuroimaging of the Philadelphia neurodevelopmental cohort,” Neuroimage, vol. 86, pp. 544–553, 2014.
[8] Z. Wang, G. K. Aguirre, H. Rao, J. Wang, M. A. Fernández-Seara, A. R. Childress, and J. A. Detre, “Empirical optimization of ASL data analysis using an ASL data processing toolbox: ASLtbx,” Magn Reson Imaging, vol. 26, no. 2, pp. 261–269, 2008.
[9] Y. Li, S. Dolui, D.-F. Xie, Z. Wang, A. D. N. Initiative, and others, “Priors-guided slice-wise adaptive outlier cleaning for arterial spin labeling perfusion MRI,” J Neurosci Methods, vol. 307, pp. 248–253, 2018.
[10] Y. Li, D. Xie, A. Cember, R. P. R. Nanga, H. Yang, D. Kumar, H. Hariharan, L. Bai, J. A. Detre, R. Reddy, and others, “Accelerating GluCEST imaging using deep learning for B0 correction,” Magn Reson Med, vol. 84, no. 4, pp. 1724–1733, 2020.
[11] D. Xie, Y. Li, H. Yang, L. Bai, T. Wang, F. Zhou, L. Zhang, and Z. Wang, “Denoising arterial spin labeling perfusion MRI with deep machine learning,” Magn Reson Imaging, vol. 68, pp. 95–105, 2020.
[12] Z. Yu-Feng, H. Yong, Z. Chao-Zhe, C. Qing-Jiu, S. Man-Qiu, L. Meng, T. Li-Xia, J. Tian-Zi, and W. Yu-Feng, “Altered baseline brain activity in children with ADHD revealed by resting-state functional MRI,” Brain Dev, vol. 29, no. 2, pp. 83–91, 2007.
[13] D. P. Kingma and J. Ba, “Adam: A method for stochastic optimization,” arXiv preprint arXiv:1412.6980, 2014.
Figures