4865
Assessing cerebral perfusion: analysis of the BOLD response to a hypoxia-induced step change in deoxyhemoglobin1Physiology, University of Toronto, Toronto, ON, Canada, 2Anaesthesiology and Pain Management, University of Toronto, Toronto, ON, Canada, 3Department of Anaesthesiology and Pain Management, University of Toronto, Toronto, ON, Canada, 4Joint Department of Medical Imaging and the Functional Neuroimaging Laboratory, University Health Network, Toronto, ON, Canada, 5Joint Department of Medical Imaging and the Functional Neuroimaging Lab, University Health Network, Toronto, ON, Canada, 6Toronto General Hospital Research Institute, University Health Network, Toronto, ON, Canada
Synopsis
Keywords: Contrast Agents, Perfusion, brain
Motivation: Provide direct measurements of cerebral perfusion metrics, relative cerebral blood flow and volume, and mean transit time.
Goal(s): Generate a known step susceptibility contrast input rather than requiring back calculation of an arterial input function
Approach: We used a step reoxygenation of previously deoxygenated lung alveoli to induce a step increase in oxyhemoglobin in arterial blood and analyzed the T2*-weighted signal for each voxel. Perfusion metrics from step deoxyhemoglobin changes were compared to those from conventional analysis using a gadolinium contrast agent in healthy volunteers.
Results: The perfusion metrics from the step deoxyhemoglobin method were similar to those from Gadolinium injection.
Impact: Perfusion metrics can be measured directly from a non-invasive test using a step decrease in deoxyhemoglobin generated by instantaneous reoxygenation from a brief hypoxia. They correspond to those calculated indirectly from an intravenously injected Gadolinium contrast agent involving complex analysis.
INTRODUCTION
Anatomical maps of perfusion metrics can be obtained from magnetic resonance imaging using gadolinium-based contrast agents (GBCA). Alternatively, hypoxia-induced deoxyhemoglobin concentration ([dOHb]) can be used as a non-invasive susceptibility contrast agent (Poublanc et al., 2021). Anatomical maps of perfusion metrics, relative cerebral blood volume (rCBV) and flow (rCBF) and mean transit time (MTT), reflect vascular health and compensations for anatomical pathologies. Conventional analyses of gadolinium-induced changes in T2* (GBCA test) require deconvolution methods to identify the arterial input function (AIF) (Meier & Zierler, 1954; McGehee et al., 2012). Here we explore a direct analysis based on the generation of a step change in [dOHb] rather than a bolus change (THx-dOHb step test). An induced baseline of hypoxic partial pressure in the lungs is instantly reversed during a single breath containing oxygen providing a step T2*-weighted signal response from which perfusion metrics can be calculated.METHODS
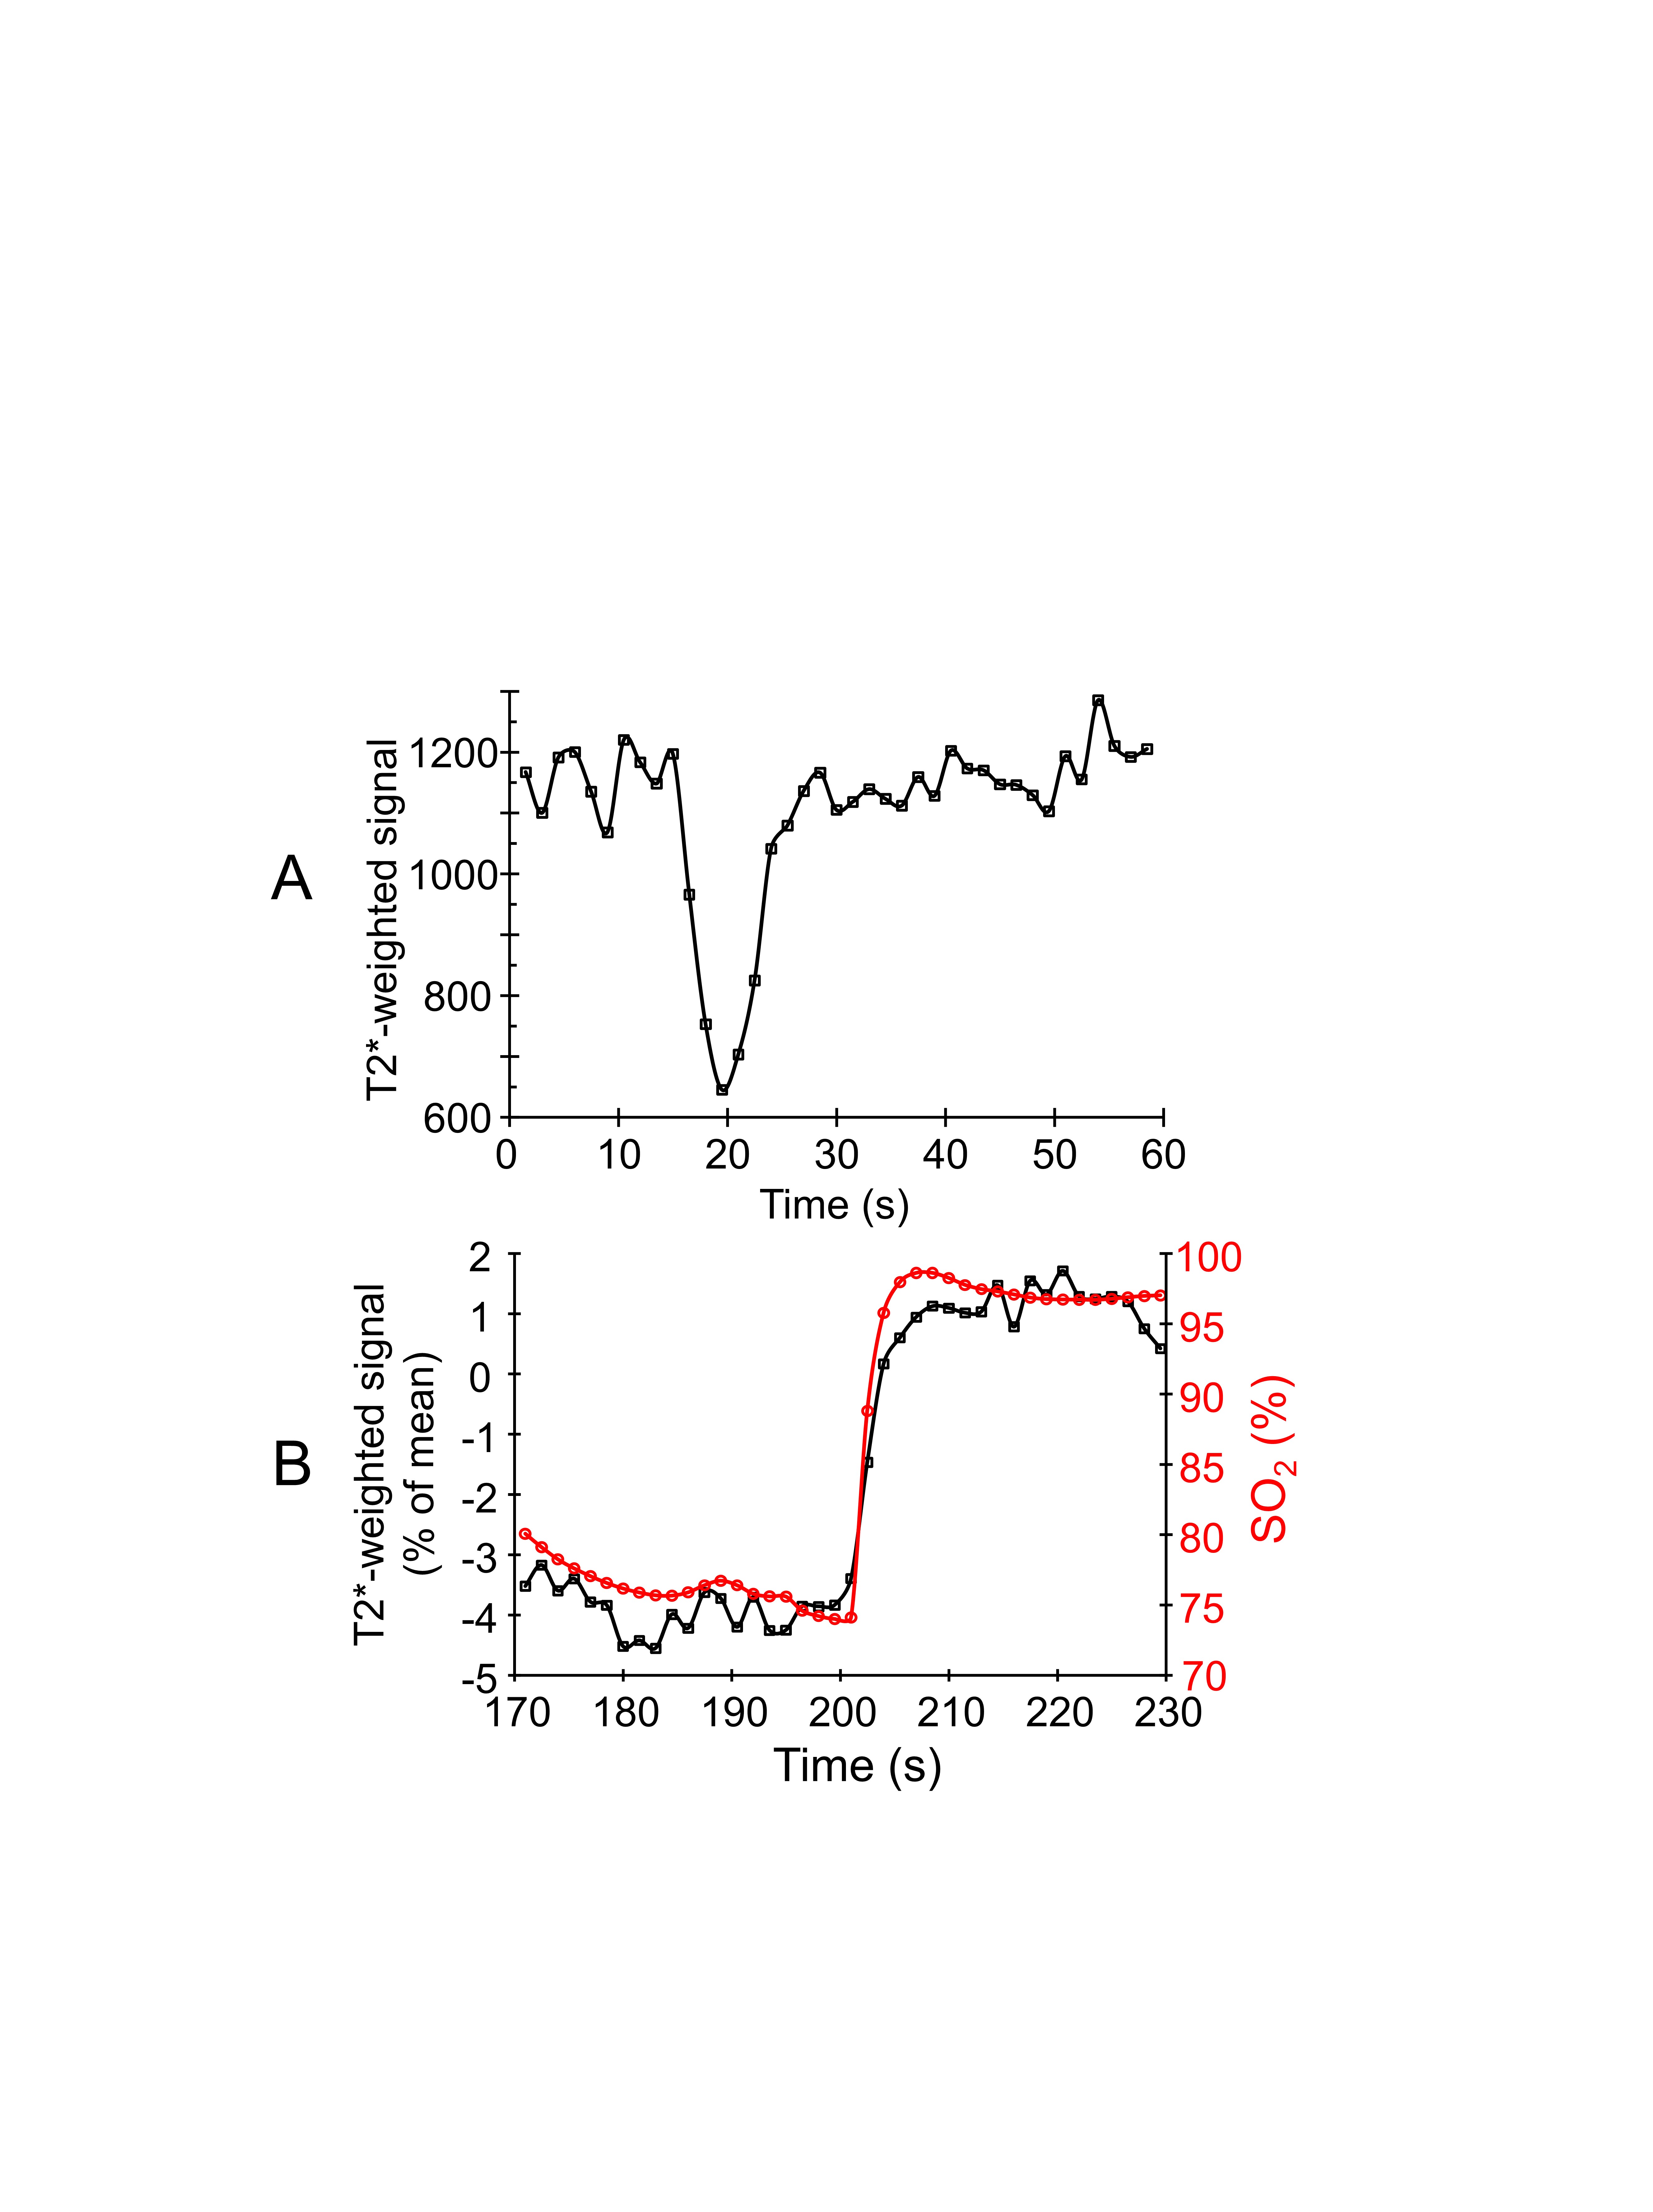
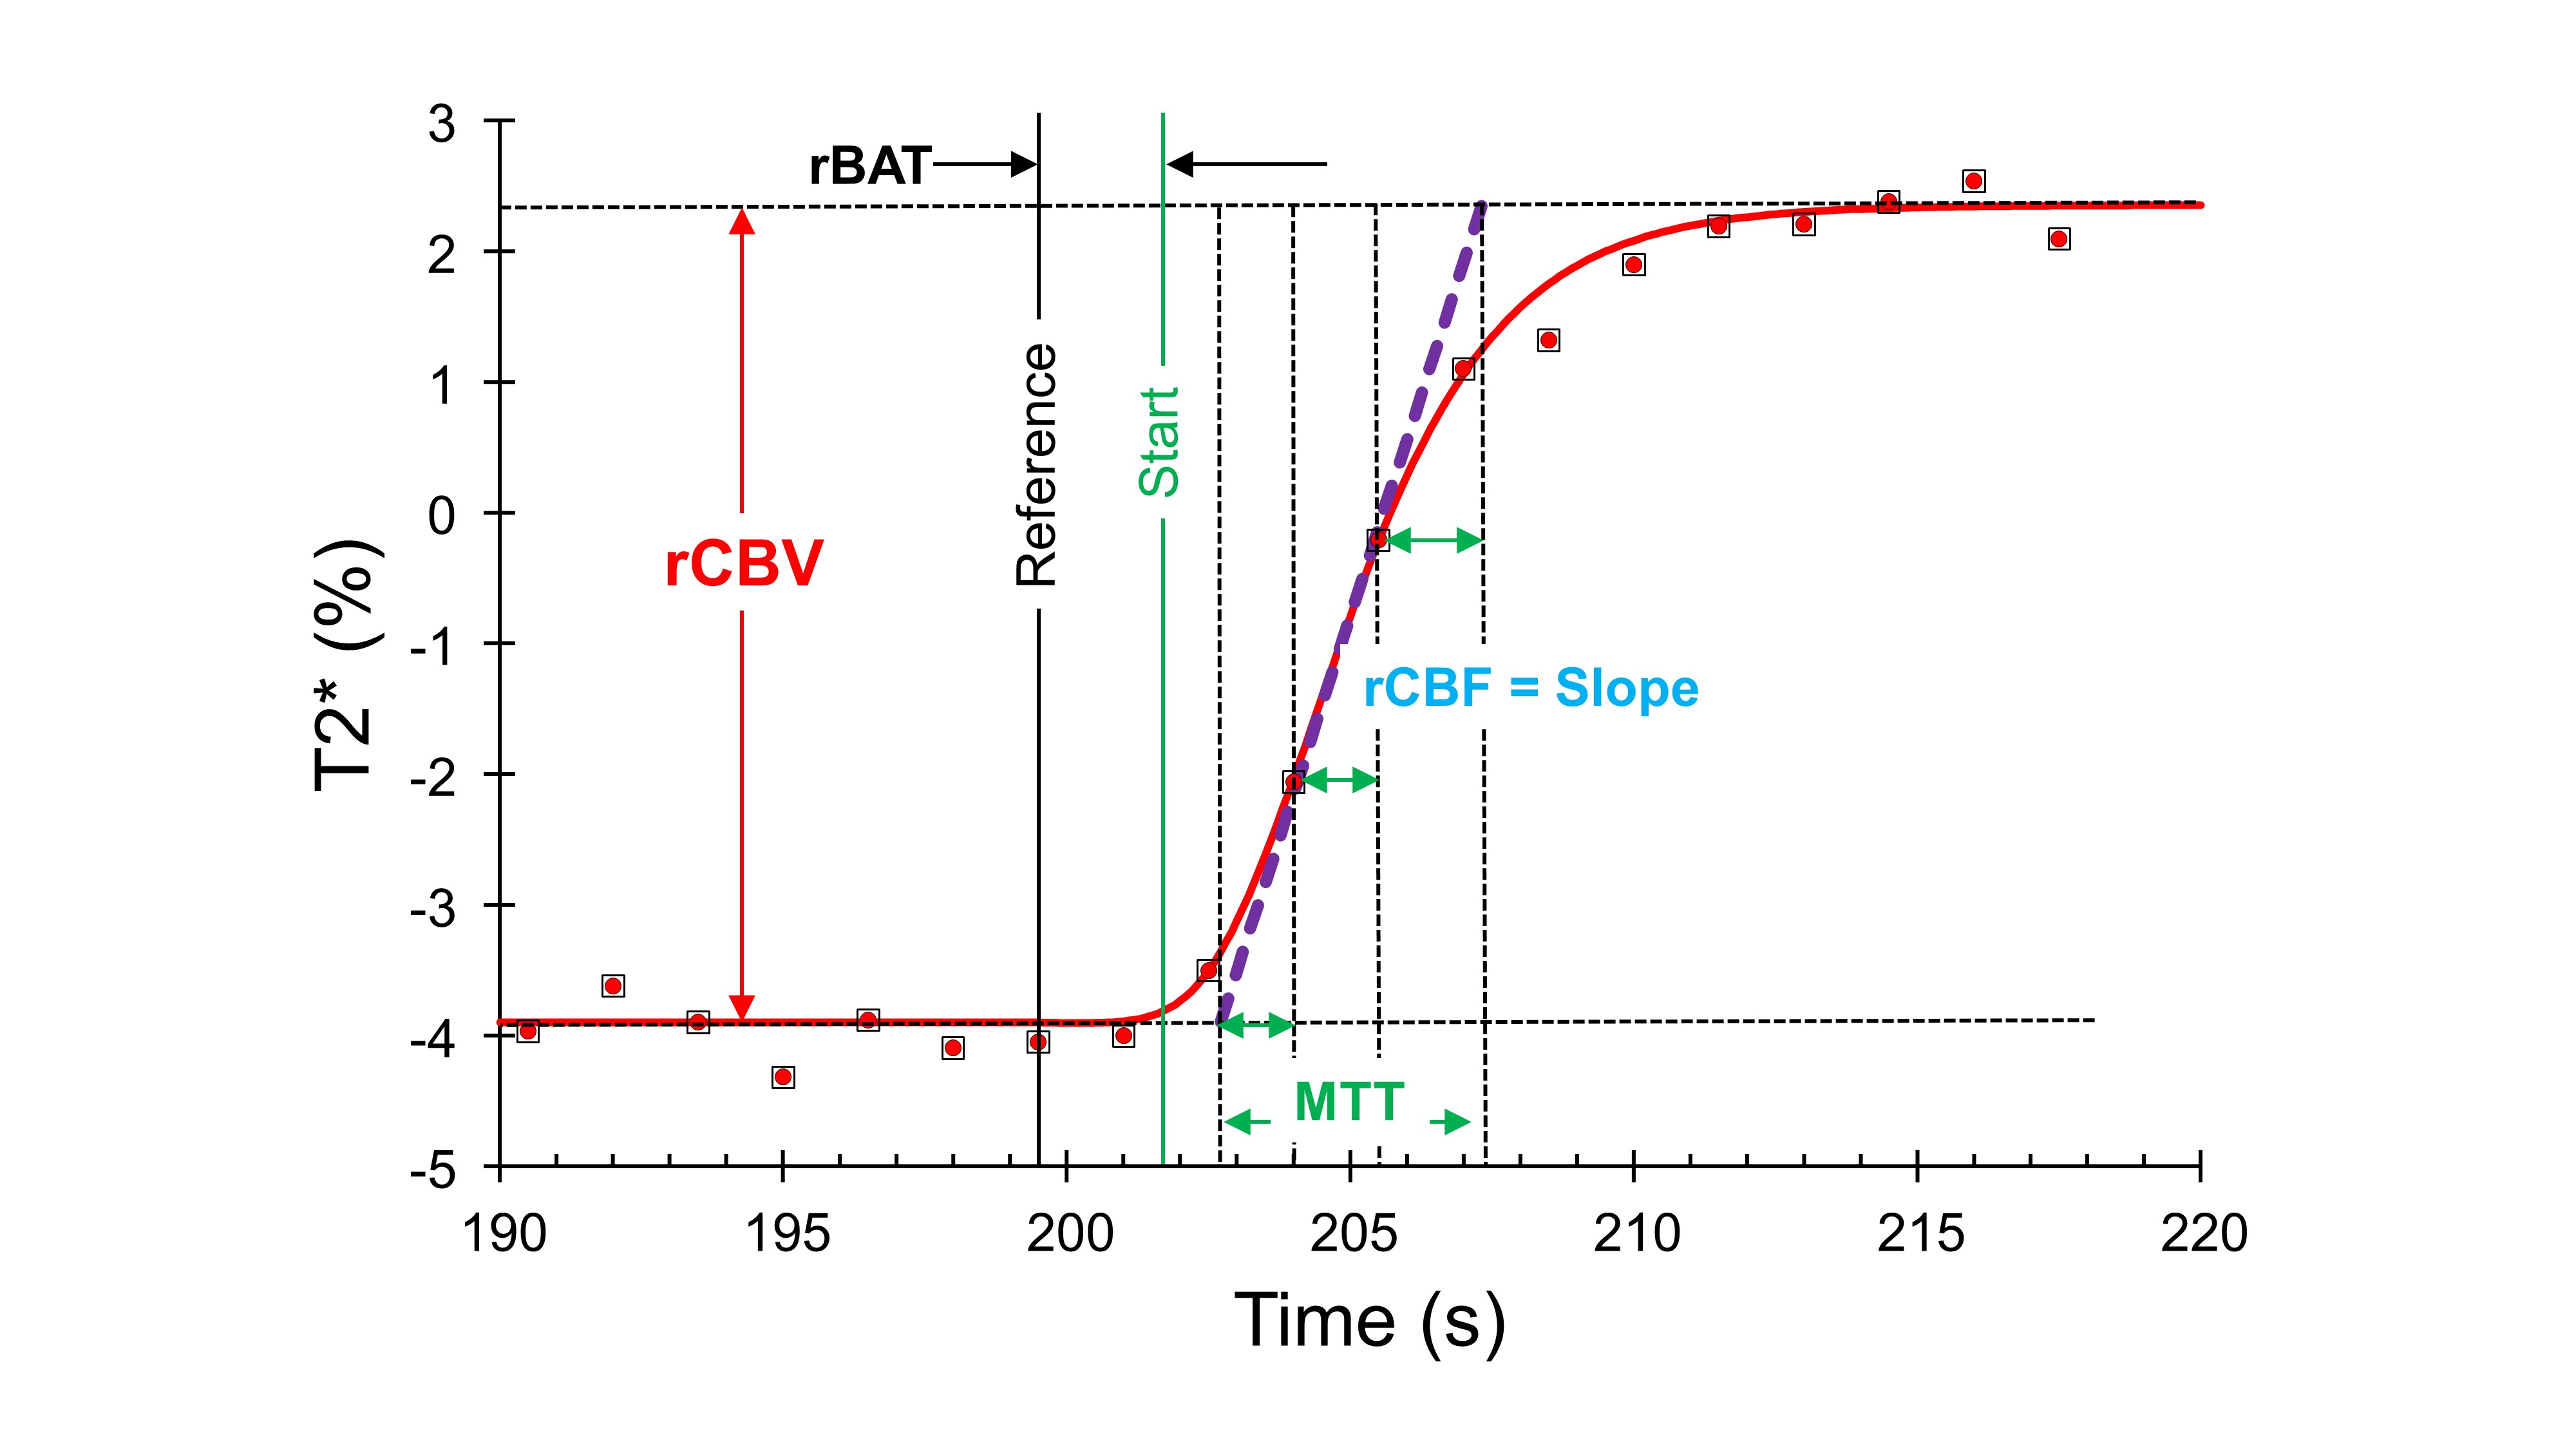
Five healthy participants (3M) between the ages of 24 and 55 (mean ± SD = 31.6 ± 13.3 y) were imaged on a 3T MR scanner. The participants underwent a two T2*-weighted sequence and a high-resolution T1-weighted scan. The following T2*-weighted sequence parameters were used: TR/TE = 1500/30 ms, flip angle = 73 deg, 29 slices, voxel size of 3 mm isotropic and matrix size of 64 x64. A computer-controlled gas blender targeted the partial pressures of end-tidal oxygen (PetO2) and carbon dioxide (PetCO2) administered via a sequential gas delivery circuit (RespirAct™, Thornhill Medical, Toronto, Canada). During the first T2*-weighted acquisition, the PetO2 was manipulated while maintaining normocapnia as shown in Figure 1. Participants returned to free breathing of room air for at least 5 min before acquiring the second T2*-weighted acquisition during an intravenous injection of 5 ml of Gadovist (Bayer, Canada), with a baseline delay of 20 s prior to injection, and flushed with 30 ml of saline. GBCA test: The gadolinium T2*-weighted signal response to an injection of Gadovist was analyzed using an AIF and a deconvolution-based kinetic model to calculate voxel-wise maps of MTT and rCBV (Poublanc et al., 2021). Maps of rCBF were then calculated as the ratio rCBV/MTT using the central volume theorem. THx-dOHb step test: The T2*-weighted signal response to a step change in dOHb was analyzed using custom software (LabVIEW 2022, National Instruments, Texas U.S.A.), which fitted a Gompertz function (Equation 1) using the Levenburg-Marquardt algorithm. Perfusion metrics were calculated as shown in Figure 2. The reference time (Figure 2, black vertical line) is set for all voxels from the whole brain average T2*-weighted signal. From equation 1, parameter “a” measures rCBV, and rCBF is measured as the maximum rate of change calculated as “a × c/e”. MTT is the sum of the linear transit time and the arrival and departure time constants, which equals the ratio rCBV/rCBF. T2*fit(t) = T2*baseline + a × exp(-b × exp(-c × t)) 1 Maps obtained from each analysis were transformed into MNI space, overlayed onto their respective anatomical images, and compiled to form group average maps for each method.RESULTS
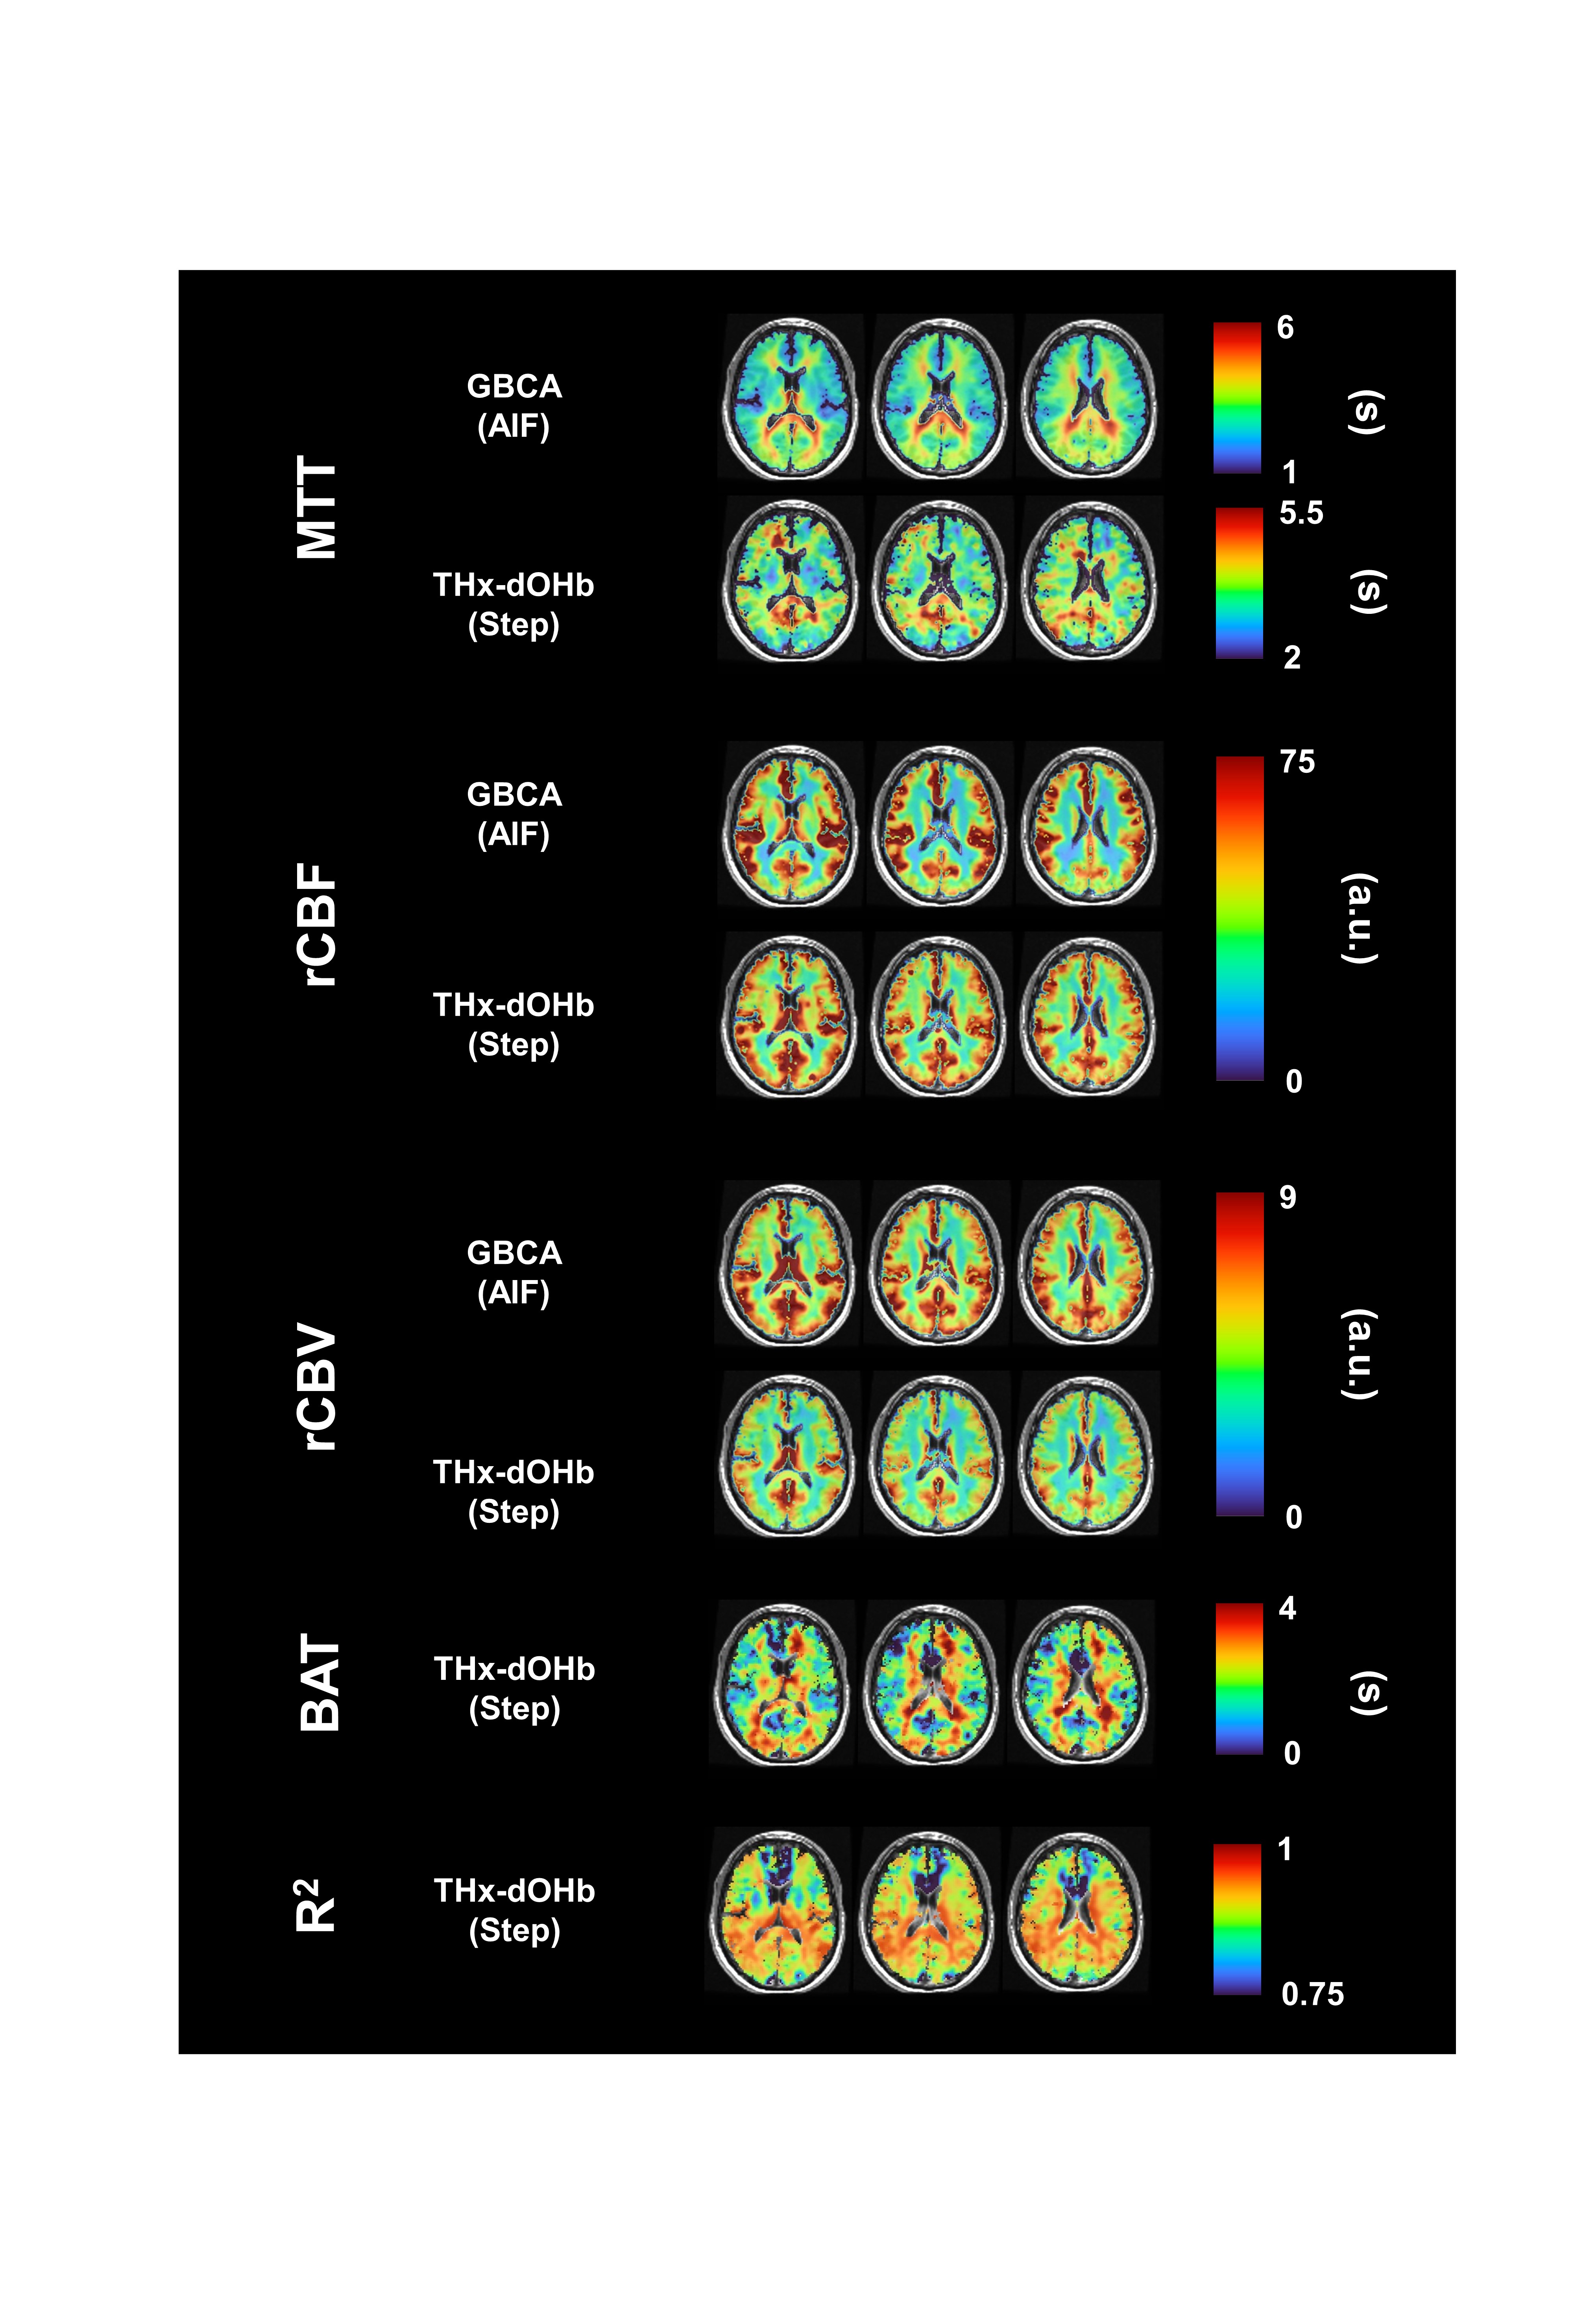
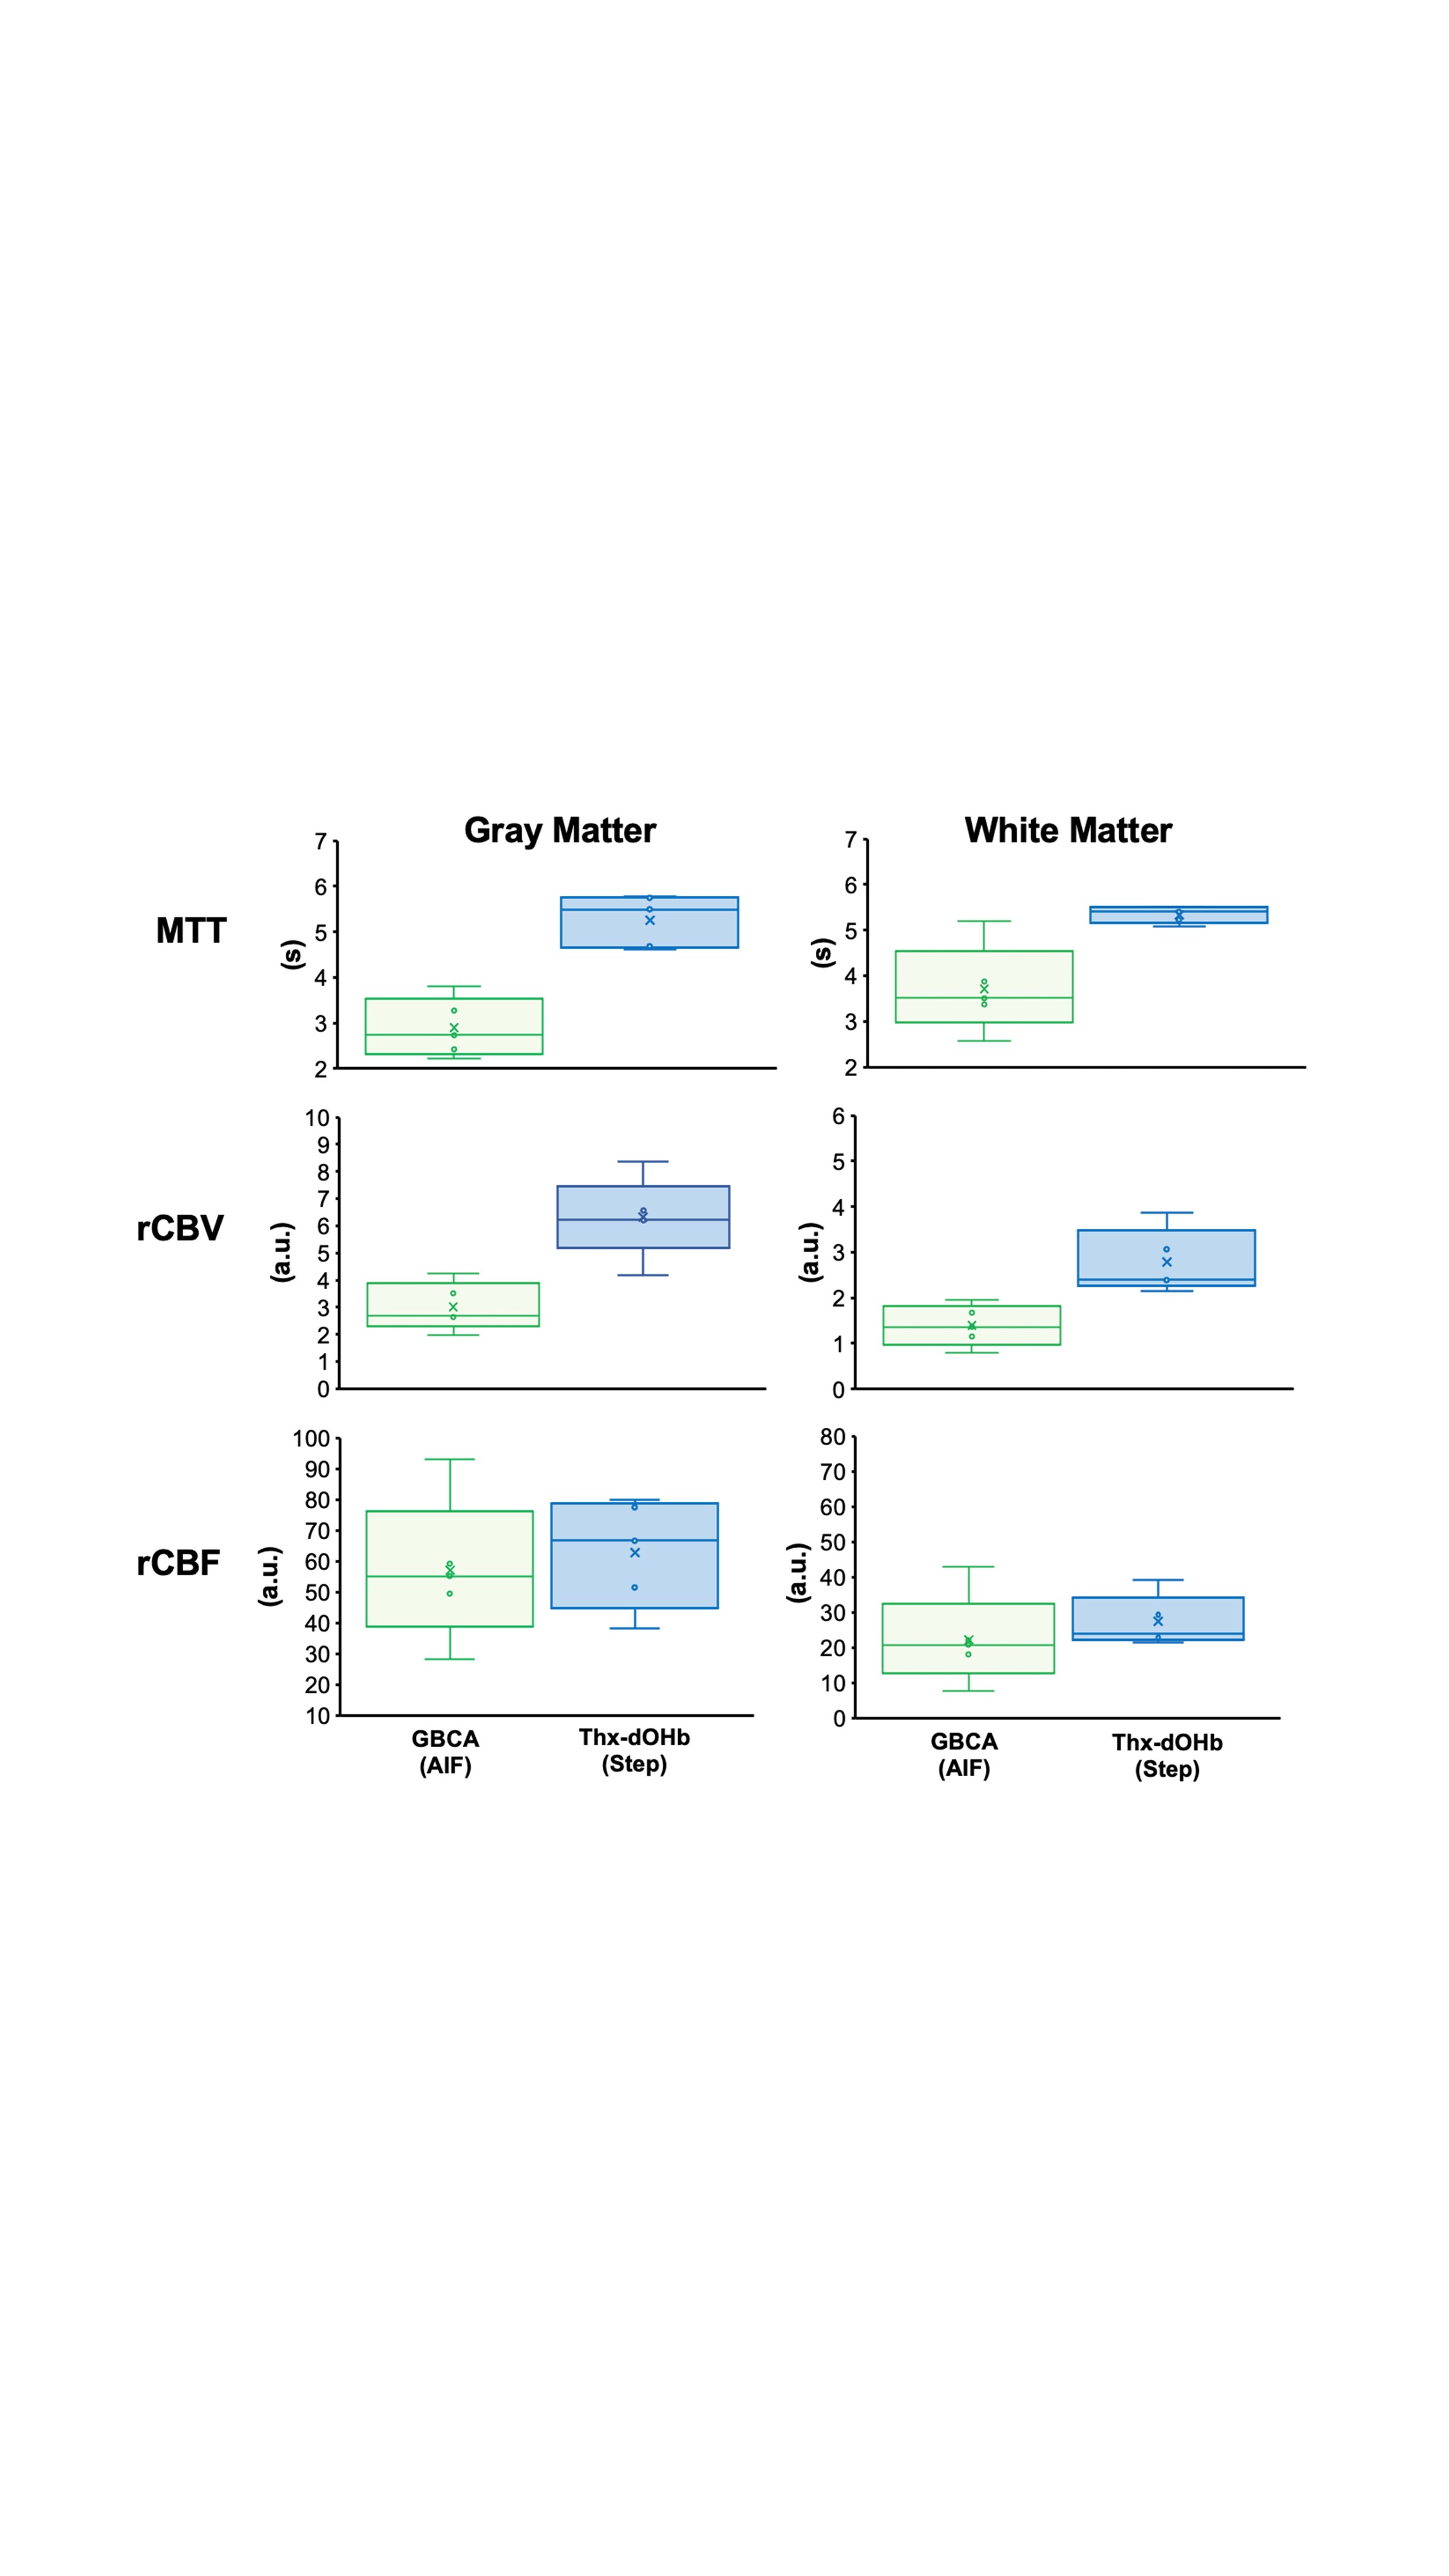
Figure 3 shows group average maps of metrics in representative axial slices, comparing the two analysis methods, and Figure 4 shows boxplot comparisons. A two-way ANOVA comparison of MTT average values in gray and white matter (GM and WM) found no significant difference between GM and WM (P = 0.15), but the THx-dOHb step test MTT was higher than that for the GBCA test (P <0.001). A one-way ANOVA comparing GM/WM ratios between methods found no significant differences for rCBV and rCBF, but the MTT GM/WM ratio for the THx-dOHb step test was less than that for the GBCA test (P = 0.01).DISCUSSION
Voxel-wise maps of MTT, rCBF and rCBV, had a high spatial congruence between the GBCA test metrics and the THx-dOHb step test metrics. Other aspects also demonstrated equivalence between the analyses; the GM/WM ratios, a measure of contrast, were not significantly different for rCBV and rCBF. However, THx-dOHb step test MTT values were significantly greater than those for GBCA test. We note that Gadolinium generates a greater signal response than deoxyhemoglobin and so is less susceptible to noise. However, the step deoxyhemoglobin test is non-invasive and serially repeatable to allow averaging.CONCLUSION
The step deoxyhemoglobin test and its analysis yields perfusion metrics that directly correspond to those made using an intravenously injected Gadolinium contrast agent, meriting further investigation.Acknowledgements
The authors thank the MR technologists at Toronto Western Hospital and Vepeson Wijeya for experimental setup and troubleshooting. We also thank John Wood and his laboratory for his insightful comments on this methodology. This work was supported by the Holt-Hornsby and Andreae Vascular Dementia Research Unit in the Joint Department of Medical Imaging at the Toronto Western Hospital and the University Health Network.References
McGehee BE, Pollock JM & Maldjian JA. (2012). Brain perfusion imaging: How does it work and what should I use? J Magn Reson Imaging 36, 1257-1272.
Meier P & Zierler KL. (1954). On the Theory of the Indicator-Dilution Method for Measurement of Blood Flow and Volume. Journal of Applied Physiology 6, 731-744.
Poublanc J, Sobczyk O, Shafi R, Sayin ES, Schulman J, Duffin J, Uludag K, Wood JC, Vu C, Dharmakumar R, Fisher JA & Mikulis DJ. (2021). Perfusion MRI using endogenous deoxyhemoglobin as a contrast agent: Preliminary data. Magn Reson Med 86, 3012-3021.
Figures