4864
A comparative study to assess the flow of meningeal lymphatic vessels in healthy volunteers and brain disorders using the IR-ALADDIN technique1Korea Advanced Institute of Science and Technology, Daejeon, Korea, Republic of, 2Department of Radiology, Seoul National University College of Medicine, Seoul, Korea, Republic of, 3Seoul National University Hospital, Seoul, Korea, Republic of
Synopsis
Keywords: Neurofluids, Neurofluids
Motivation: The difference in mLVs outflow between healthy control (HC) and brain disorder patients may contribute to toxic protein aggregation and cognitive decline.
Goal(s): To demonstrate mLVs structure and flow information of brain disorder patients and compare quantitative flow metrics between HC and patient
Approach: We applied IR-ALADDIN to acquire mLVs images around superior sagittal sinus in 20 HCs and 9 patients with various brain disorders such as meningioma, hydrocephalus.
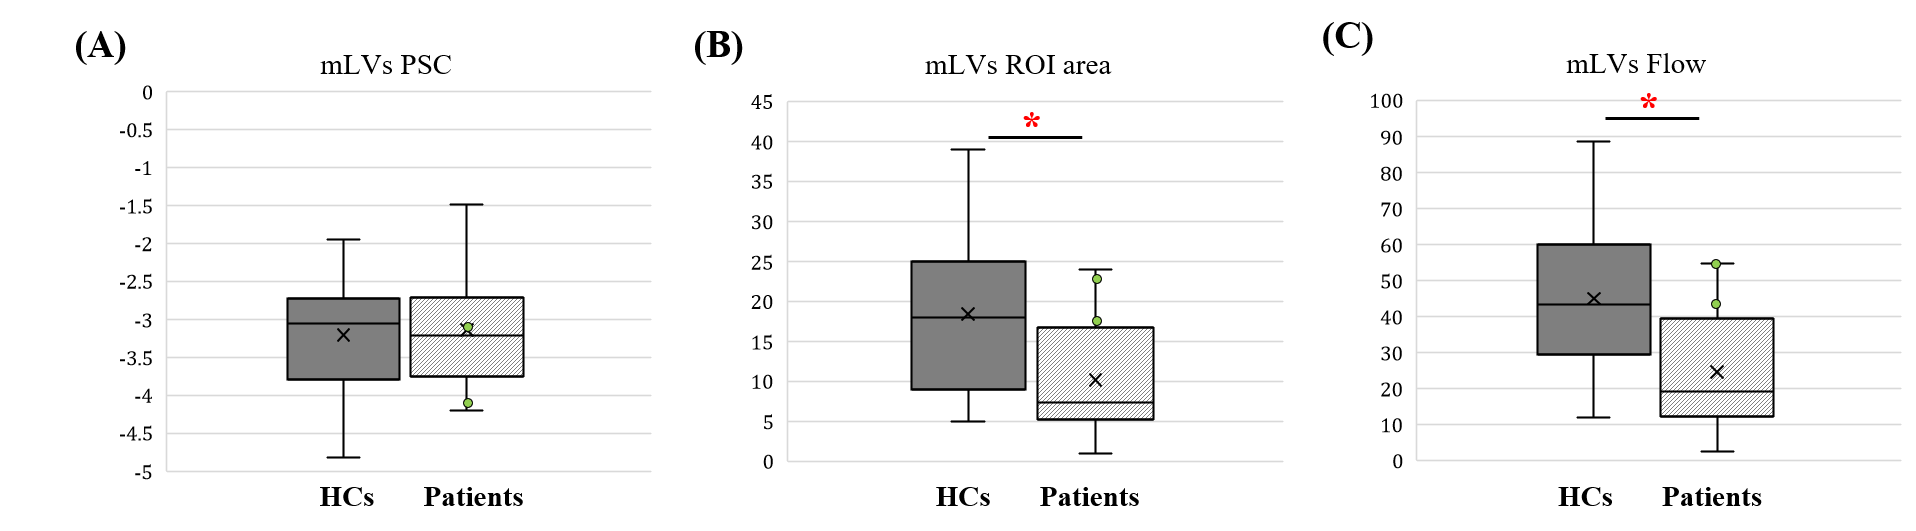
Results: The mLVs size was reduced in patients compared to HC with no significant difference in mLVs velocity, leading to overall mLVs flow reduction in patients.
Impact: The reduced mLVs flow in brain disorder patients was confirmed using a non-invasive technique. This suggests the possibility to study relationship between brain disorders and waste clearance through the mLVs flow in further studies.
Introduction
The mechanisms of waste clearance from the central nervous system (CNS) have gained attention due to the emerging significance of the glymphatic system and meningeal lymphatic vessels (mLVs) [1, 2]. Recent investigations highlight the pivotal role of mLVs as one of the major pathways for CNS waste outflow [3, 4]. Notably, these vessels are implicated in facilitating the outflow of immune cells, tumor cells, and macromolecules into cervical lymph nodes. Moreover, previous studies revealed a correlation between impaired mLVs function and the onset or progression of neurodegenerative diseases, notably Parkinson’s and Alzheimer’s diseases [5-9].A noninvasive imaging technique, inversion-recovery ALADDIN (IR-ALADDIN), has been introduced to specifically visualize mLVs [10]. This method was designed to enhance the detection of slow-flowing small mLVs and distinguish the signal within mLVs from those in surrounding structures. As mLVs are mainly located within the dorsal meninges around the superior sagittal sinus and the base of the skull, we focused on the mLVs in the parasagittal dura mater [11, 12]. In this study, we applied IR-ALADDIN to visualize mLVs' structural features and flow dynamics in normal volunteers and patients with brain disorders. This study may offer a basis for comparative quantitative flow analysis between healthy individuals and brain disorder patients.
Methods
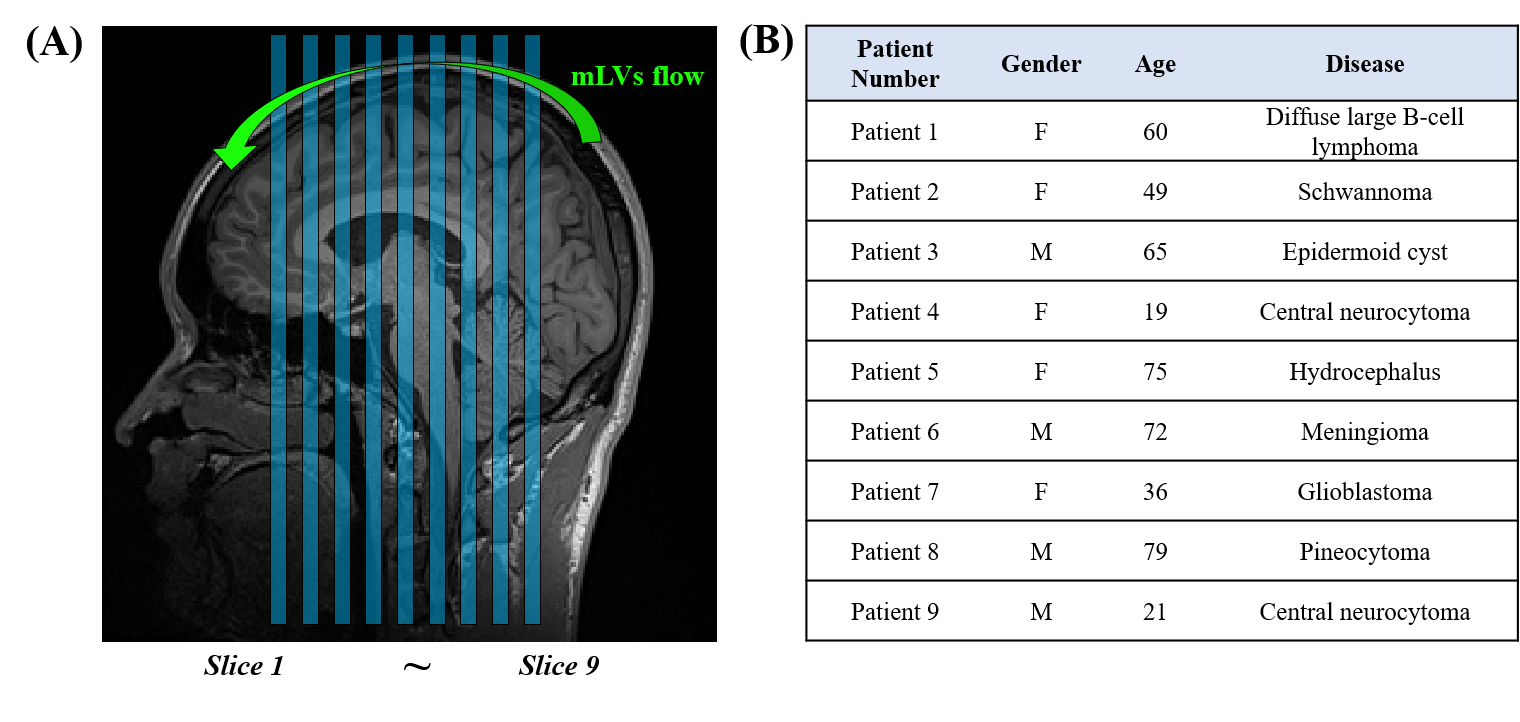
The IR-ALADDIN bSSFP imaging parameters were TR/TE=4.84/2.42ms, flip angle=60°, matrix size=256×256, field-of- view = 250×250mm2, thickness=5 mm, gap=5 mm (100% of thickness), scan direction = coronal, PE order=centric, slice-selective TI=2300ms, and PE direction = left–right. Each slice took 3.539 secs for acquisition. Ascending/descending directional full sets (8 measurements) were acquired with number of slices = 9 and the total scan time = 4 min 29 sec (Fig.1.A).All the data analyses were performed using Matlab R2020a (Mathworks, Natick, MA). For IR-ALADDIN data processing, four ascending (Asc) and four descending (Dsc) acquisitions were averaged separately and then subtracted from each other to maximize the flow signals, which have directionality. To visualize the mLVs, the images were displayed as percent signal changes (PSC) (Asc-Dsc)/S*100, where S represents the average of Asc and Dsc.
To segment mLVs ROIs from IR-ALADDIN, we utilized P-A directional perfusion images and applied a threshold filter of PSC range from 1% to 9%, which included most of the lymphatic flow [10]. Lastly, we segmented the mLVs signals adjacent to the superior sagittal sinus (distance from SSS less than 3mm) to focus on parasagittal dura mater (PSD) mLVs.
The mLVs flow was obtained by multiplying the flow velocity and ROI area. The flow velocity was derived from PSC by based on the PSC-velocity relationship graph from the previous study [10].
All the experiments were performed on a 3T scanner (Trio, Siemens). This study was approved by Institutional Review Board and written informed consent was obtained before the experiment. The total number of volunteers was 29, with 9 subjects having different brain disorders and 20 subjects in the healthy control group (HC) (Fig.1.B).
Results
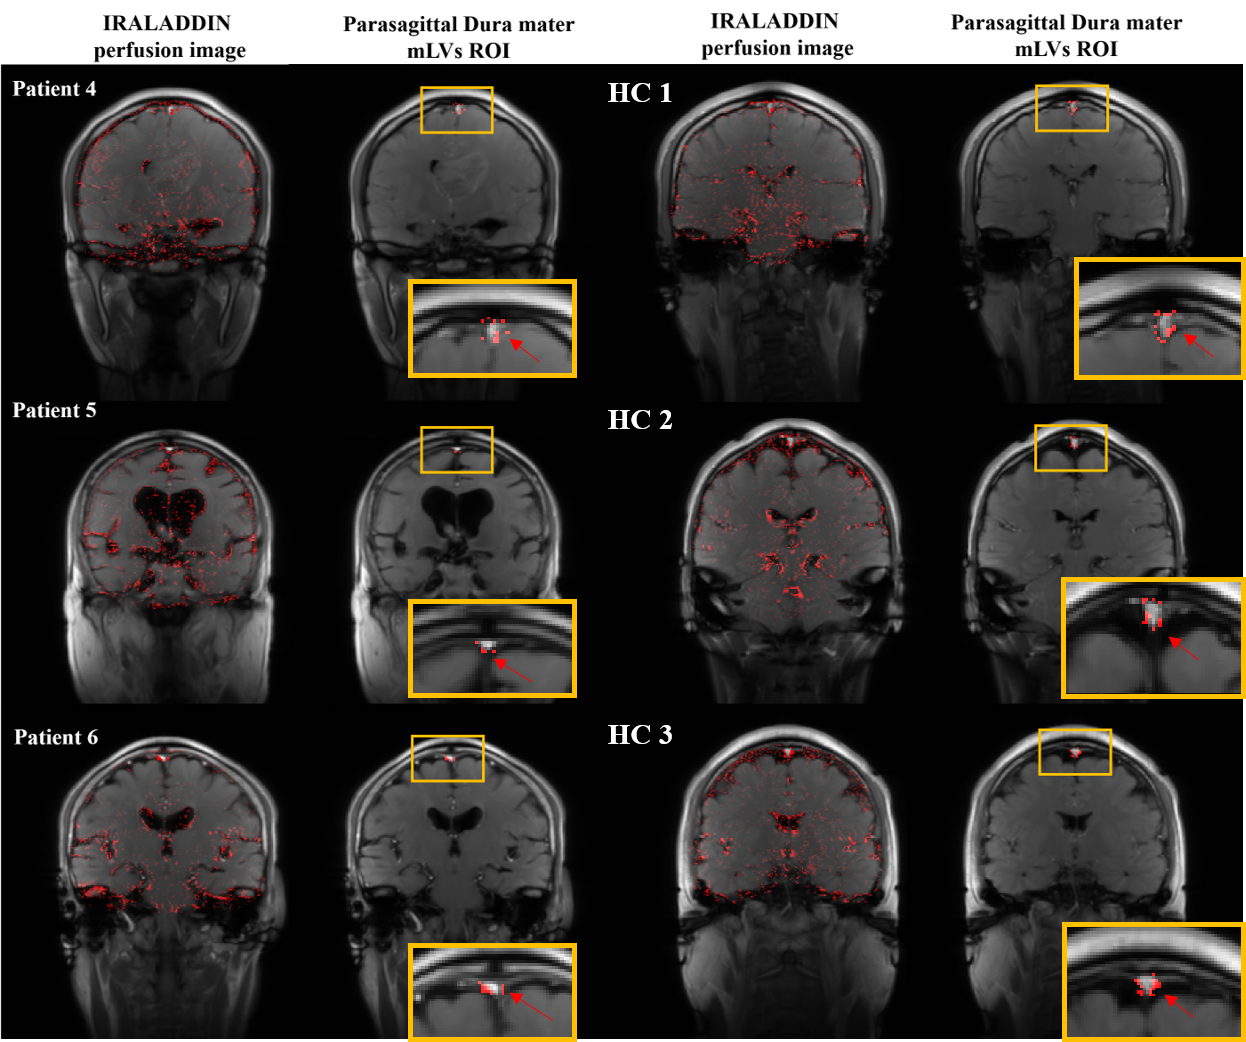
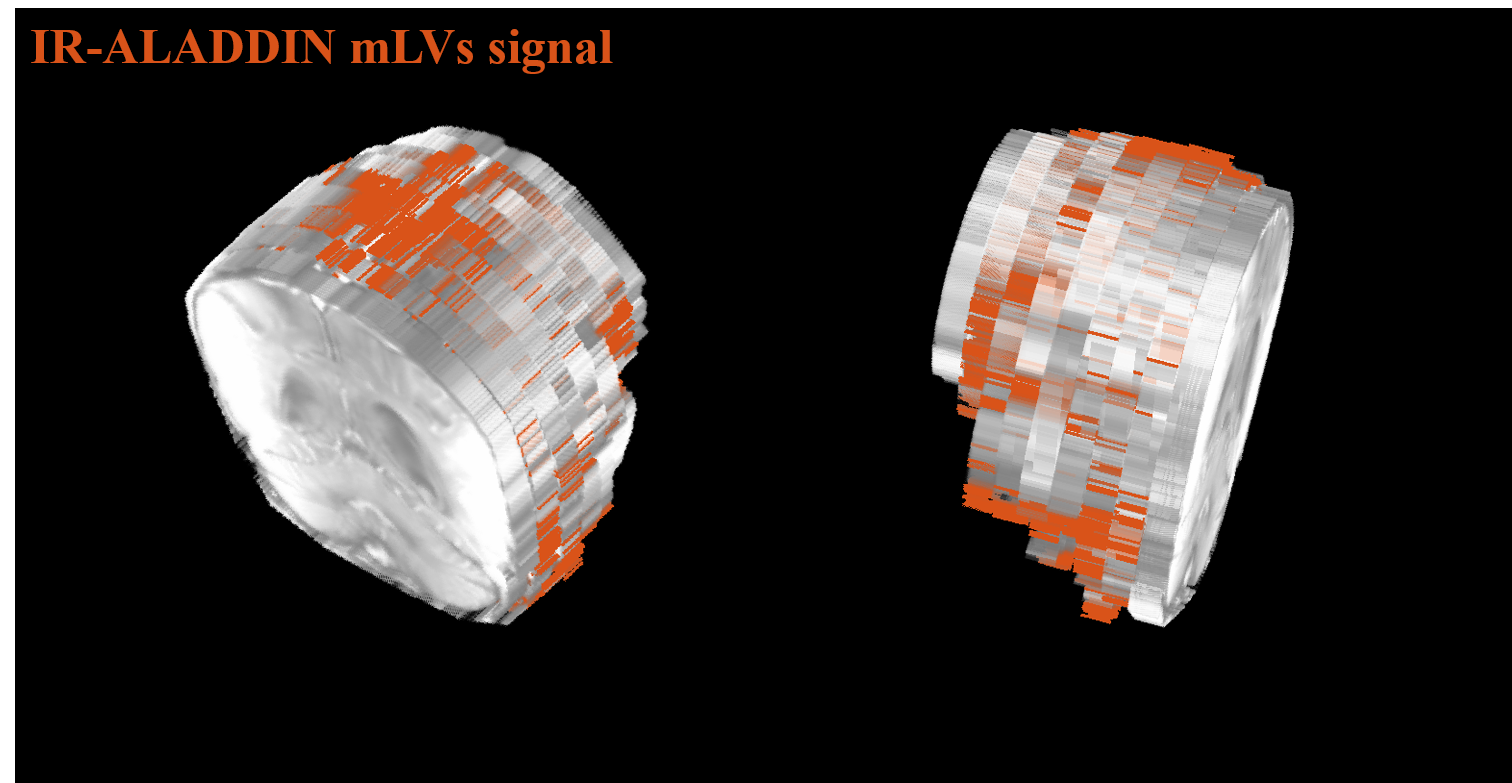
Patient’s perfusion images with PSC filtering and the PSD-mLVs ROI around the SSS are shown in Fig.2. The representative perfusion images (patient5) are demonstrated in multiple slices in Fig.3. The mLVs flow signals were mainly found around dorsal SSS, para-sinus area and brain basal regions (Fig.3). The mLVs image outcomes from the patients exhibited variability in both structural and quantitative flow metrics.Through comparison of quantitative flow metrics from IR-ALADDIN, no significant difference was observed in PSD-mLVs PSC values (which can be converted into the mLVs flow velocities) between the patients and the HC group (Fig.4.A). However, the PSD-mLVs ROI size was significantly reduced in the patient group compared to the HC group (Wilcoxon-ranksum test; p<0.05) (Fig.4.B). Thus, the PSD-mLVs flow across the mLVs ROIs was also significantly reduced in the patient group than HC group (Wilcoxon-ranksum test; p<0.05) (Fig.4.C).
Discussion and Conclusion
In this study, we demonstrated PSD-mLVs images and its flow measurements in brain disorder patients using IR-ALADDIN [10]. IR-ALADDIN showed the potential to be applied to imaging mLVs of brain disorder patients (Fig.2,3). The captured mLVs distribution coincided with that of the previous studies[11, 12]. The comparison of PSD-mLVs flow metrics between HC group and patients suggests a potential reduction in brain waste clearance ability in the brain disease group, possibly due to the reduced cross-sectional area of mLVs. However, some ambiguity remains in the interpretation, influenced by the heterogeneity within the disease group and the age difference between the HC and patient groups. This study highlights the potential application of IR-ALADDIN for measuring mLVs in brain disorders.Acknowledgements
No acknowledgement found.References
1. Louveau, A., et al., Understanding the functions and relationships of the glymphatic system and meningeal lymphatics. J Clin Invest, 2017. 127(9): p. 3210-3219.
2. Da Mesquita, S., Z. Fu, and J. Kipnis, The Meningeal Lymphatic System: A New Player in Neurophysiology. Neuron, 2018. 100(2): p. 375-388.
3. Louveau, A., et al., Structural and functional features of central nervous system lymphatic vessels. Nature, 2015. 523(7560): p. 337-41.
4. Aspelund, A., et al., A dural lymphatic vascular system that drains brain interstitial fluid and macromolecules. J Exp Med, 2015. 212(7): p. 991-9.
5. Ahn, J.H., et al., Meningeal lymphatic vessels at the skull base drain cerebrospinal fluid. Nature, 2019. 572(7767): p. 62-66.
6. Hu, X., et al., Meningeal lymphatic vessels regulate brain tumor drainage and immunity. Cell Res, 2020. 30(3): p. 229-243.
7. Tavares, G.A. and A. Louveau, Meningeal Lymphatics: An Immune Gateway for the Central Nervous System. Cells, 2021. 10(12).
8. das Neves, S.P., N. Delivanoglou, and S. Da Mesquita, CNS-Draining Meningeal Lymphatic Vasculature: Roles, Conundrums and Future Challenges. Front Pharmacol, 2021. 12: p. 655052.
9. Tian, Y., et al., The Underlying Role of the Glymphatic System and Meningeal Lymphatic Vessels in Cerebral Small Vessel Disease. Biomolecules, 2022. 12(6).
10. Kim, J.-H., et al., Non-invasive flow mapping of parasagittal meningeal lymphatics using 2D interslice flow saturation MRI. Fluids and Barriers of the CNS, 2023. 20(1): p. 37.
11. Absinta, M., et al., Human and nonhuman primate meninges harbor lymphatic vessels that can be visualized noninvasively by MRI. Elife, 2017. 6.
12. Albayram, M.S., et al., Non-invasive MR imaging of human brain lymphatic networks with connections to cervical lymph nodes. Nat Commun, 2022. 13(1): p. 203.
Figures