4862
Non-Invasive Perfusion MR Imaging of the Human Brain via Breath-Holding1Department of Medical Biophysics, University of Toronto, Toronto, ON, Canada, 2Krembil Brain Institute, University Health Network, Toronto, ON, Canada, 3Center for Neuroscience Imaging Research, Suwon, Korea, Republic of
Synopsis
Keywords: Perfusion, Perfusion
Motivation: DSC is the leading methodology for MR-based perfusion imaging. However, the technique's reliance on invasive gadolinium injections poses a major limitation.
Goal(s): Can breath-holding induce perfusion contrast that is exploitable using DSC MRI?
Approach: Ten healthy subjects underwent MRI at both 3T and 7T, while performing eight 16 s breath-holds. Breath-hold-induced signal changes were fed into a DSC MRI analysis pipeline, and perfusion was quantified.
Results: Calculated cerebral perfusion values were within the physiological range of literature values; the breath-hold task yielded significantly higher contrast-to-noise and GM-to-WM contrast with higher field strength and increased scan time, although this plateaued at roughly 6 min.
Impact: For the first time, we show that DSC-MRI using breath-holding allows for the quantification of perfusion parameters. This may have broad implications for neurovascular disease, either circumventing the need for invasive gadolinium injections or shedding additional light into pathology.
Introduction
Cerebral perfusion imaging, which allows clinicians to investigate diseases characterized by vascular abnormality, is often performed using dynamic susceptibility contrast (DSC) MRI.1,2 Here, traditionally, a bolus of paramagnetic gadolinium (Gd) is injected and tracked as it passes through the cerebral vasculature, revealing the underlying perfusion properties of the tissue.2 However, Gd-DSC has limitations—it is invasive, expensive, and exhibits toxicity in certain patient populations.3,4,5 Like Gd, deoxyhemoglobin (dOHb) is paramagnetic, but it is an endogenous substance whose concentration can be adjusted via either a gas-control system or voluntary changes in respiration, such as breath-holding.6,7,8 There is no study that has developed and/or applied a DSC analysis pipeline to obtain perfusion information from signal changes induced by breath-holding.Methods
We acquired T2*-weighted gradient-echo 2D-EPI (GRE-EPI) MRI data from the same ten healthy subjects (age: 30.4±9.4 years, 3 female) at both 3T and 7T, who performed eight breath-holds (16 s each separated by 44 s of rest). The GRE-EPI data had 2.0 mm isotropic spatial resolution (64 interleaved axial slices; GRAPPA = 2; Ref lines PE = 46; SMS = 2; FoVread = 192 mm; phase-encoding = P-A; ɑ = 70°; TR/TE = 2000/30 ms; bandwidth = 2312 Hz/px; echo-spacing = 0.53 ms; EPI factor = 94; 260 TRs, TA = 8:53 min). First, we temporally averaged the eight breath-hold-induced signal boluses and converted signal to relaxation (∆R2*). We then selected an arterial input function (AIF) from the middle cerebral artery and scaled this by the venous output function (VOF) integral from the superior sagittal sinus.9 Finally, we used a standard DSC MRI framework to quantify perfusion.10Results
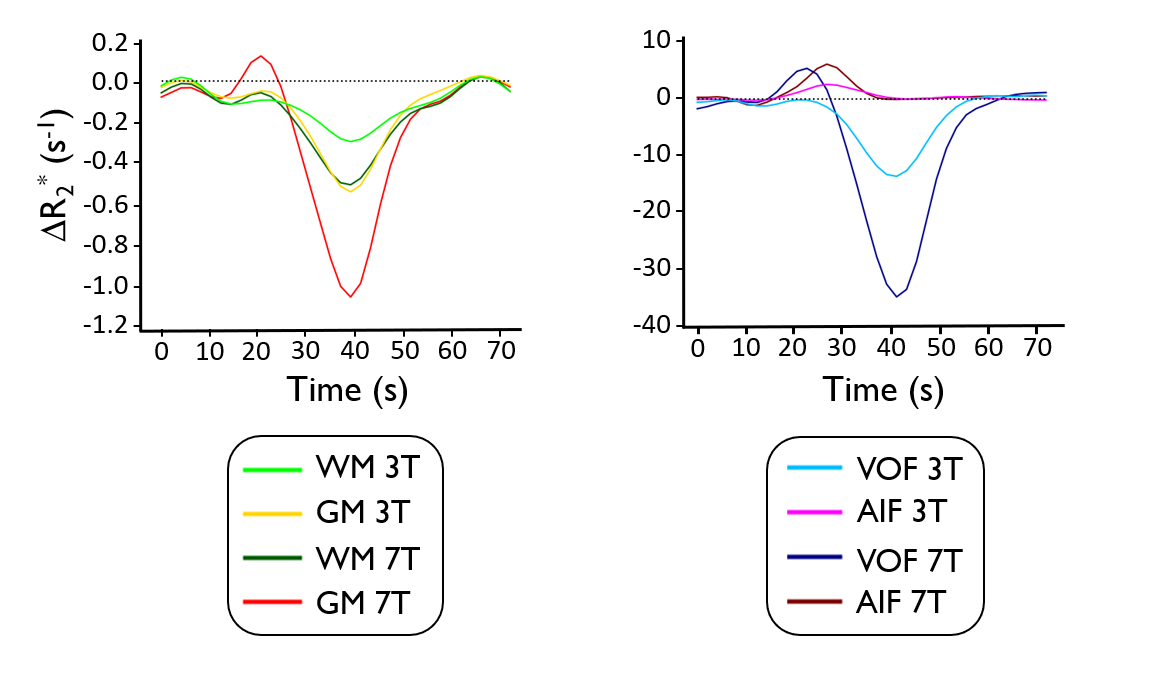
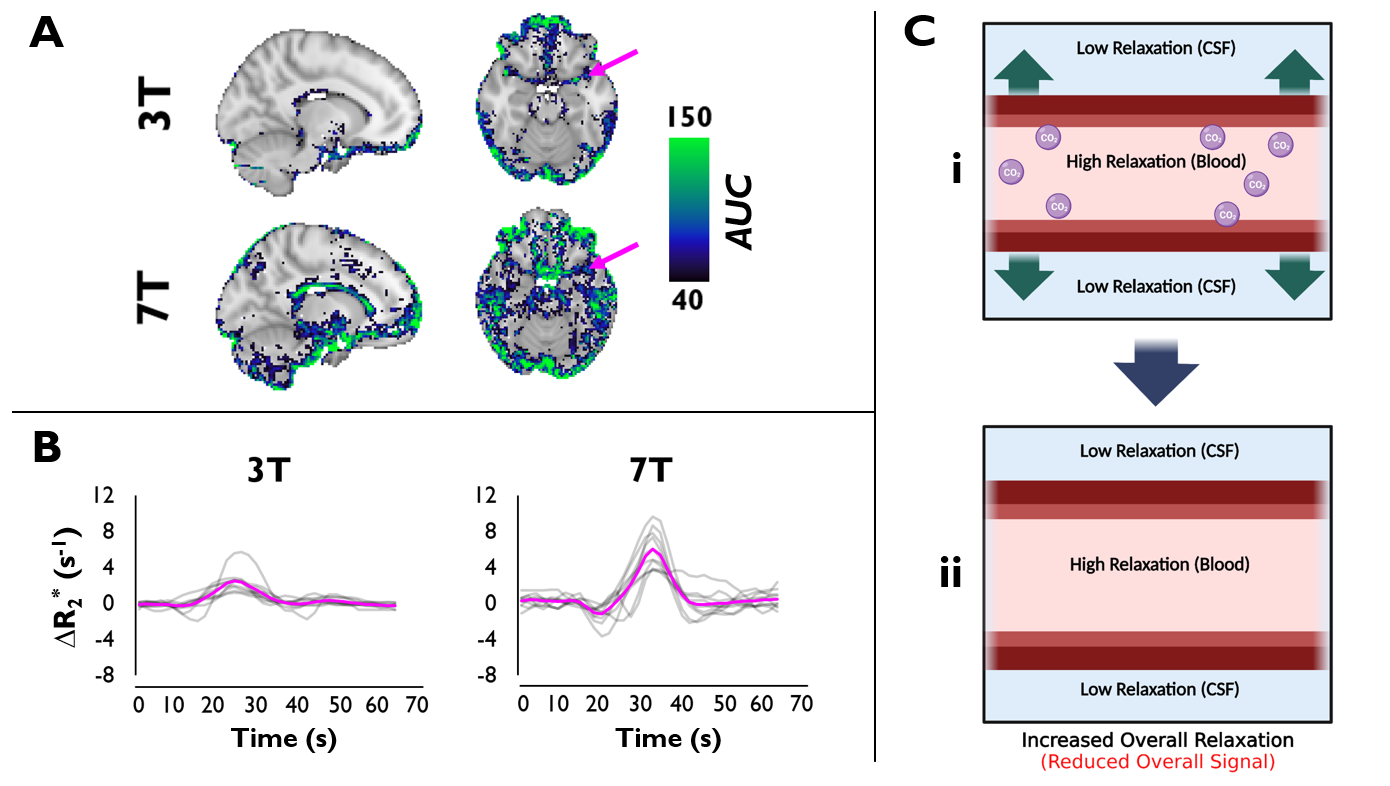
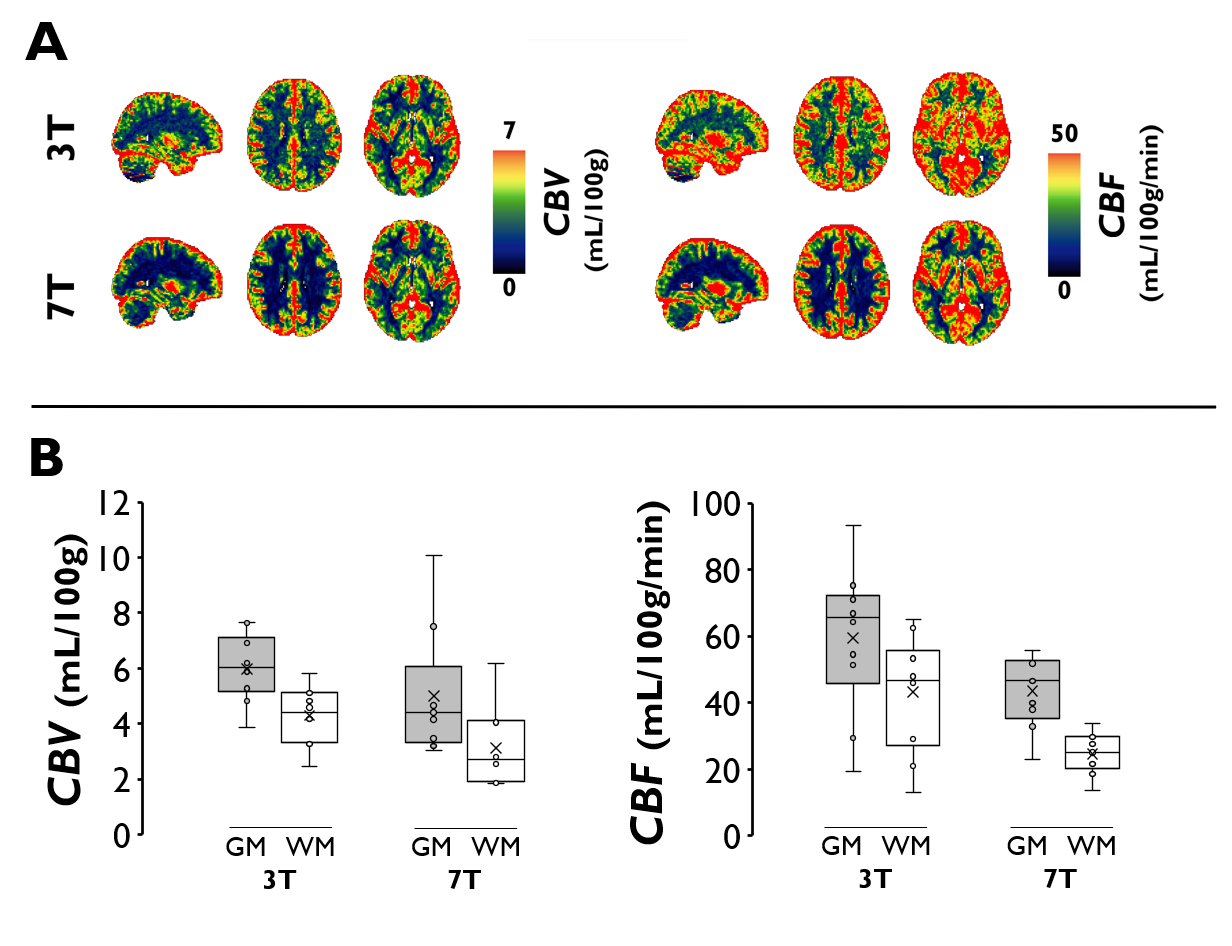
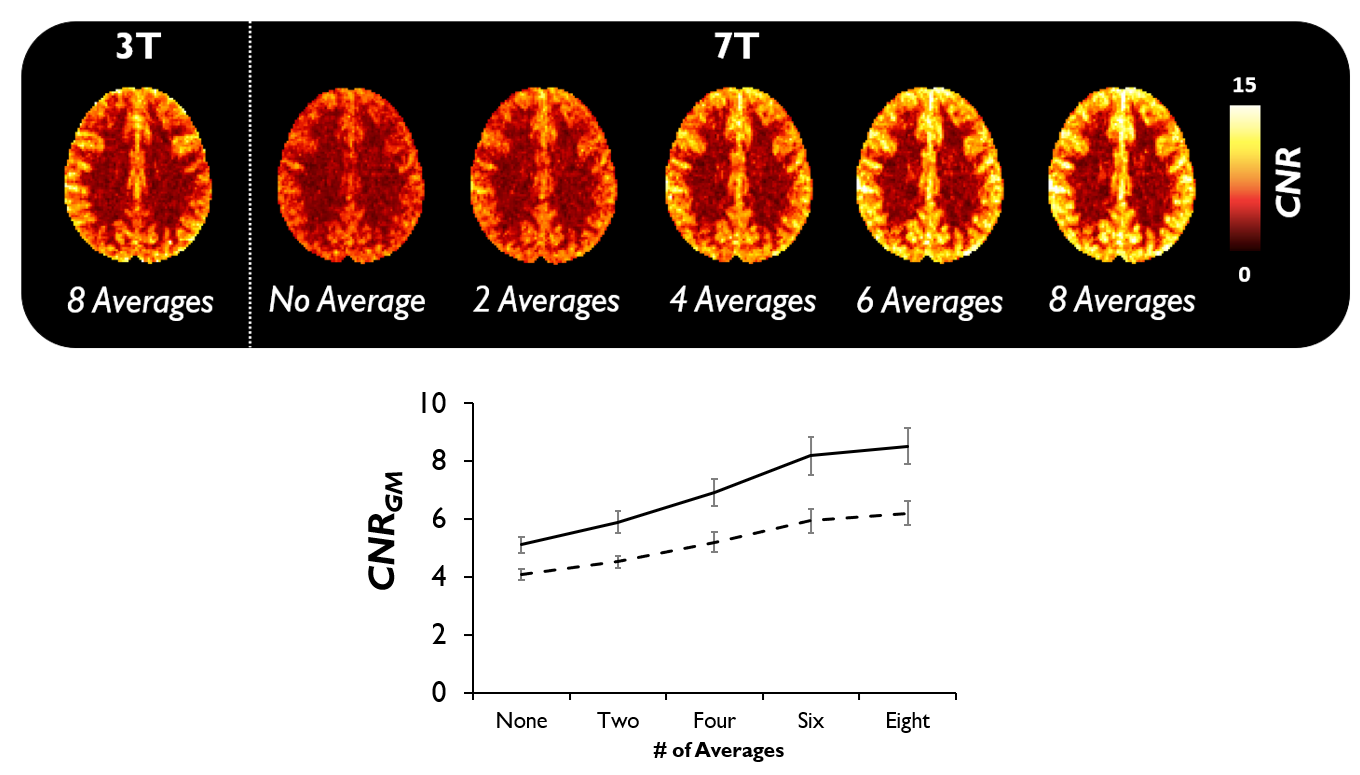
Whereas the tissue time-courses were characterized by a negative relaxation change (Figure 1), we found that the AIF during a breath-hold was characterized by a positive relaxation change, likely representing vasodilation, as supported by both simulations and the literature (Figure 2).11 Breath-hold DSC (bhDSC)-calculated CBV (CBV3T = 6.0 mL/100g; CBV7T = 5.2 mL/100g) and CBF (CBF3T = 59.3 mL/100g/min; CBF7T = 44.3 mL/100g/min) were generally within the physiological range of values reported in the literature using Gd-DSC MRI (Figure 3).12,13,14 At 7T, the breath-hold task yielded significantly higher contrast-to-noise (CNR) (p = 0.0012) and GM-to-WM contrast (p = 0.00075) relative to 3T. Although CNR increased with scan time, we found CNR gains roughly plateaued following approximately 6 min of scan time (after averaging 6 breath-holds) at both 3T and 7T (Figure 4).Discussion
Unlike gas-control-system-induced hypoxia, a breath-hold primarily results in hypercapnia.7 Through vasodilation, hypercapnia results in tissue hyperoxia, and thus, signal gain in correspondence with ΔCO2.7 The initially counter-intuitive finding of AIF relaxation change being anti-correlated with the negative relaxation change in tissue is supported by the fact that breath-hold-induced vasodilation, particularly at 7T, leads to an increase in intravascular space and a reduction in CSF, resulting in signal loss in voxels containing substantial CSF and ΔCBV (Figure 2C). Although generally within the literature range, calculated CBV and CBF differed between field-strengths—this is not unexpected given the many known DSC quantification dependencies.15 In this case, while signal change in tissue scales approximately linearly as field strength increases, this is not the case in voxels containing large intravascular contributions (i.e., VOF)—this results in an observed CBV and CBF decrease as field strength increases from 3T to 7T.Conclusion
For the first time, we used breath-hold-induced T2*-MRI signal changes to quantify perfusion parameters using a DSC framework, at both 3T and 7T. We found that CNR and GM-to-WM contrast increased with increasing field strength and found perfusion values to be within the physiological range of expected values. We expect that the methods and results presented in this study can help pave the way toward contrast-free perfusion imaging, both clinically and in research.Acknowledgements
We would like to thank Boohee Choi and Suji Jeong at the Institute for Basic Science for helping us acquire the data.References
1) Jahng, G.-H., Li, K.-L., Ostergaard, L., Calamante, F., 2014. Perfusion Magnetic Resonance Imaging: A Comprehensive Update on Principles and Techniques. Korean J Radiol 15, 554–577. https://doi.org/10.3348/kjr.2014.15.5.554
2) Rosen, B.R., Belliveau, J.W., Vevea, J.M., Brady, T.J., 1990. Perfusion imaging with NMR contrast agents. Magn Reson Med 14, 249–265. https://doi.org/10.1002/mrm.1910140211
3) Kanda, T., Fukusato, T., Matsuda, M., Toyoda, K., Oba, H., Kotoku, J., Haruyama, T., Kitajima, K., Furui, S., 2015. Gadolinium-based Contrast Agent Accumulates in the Brain Even in Subjects without Severe Renal Dysfunction: Evaluation of Autopsy Brain Specimens with Inductively Coupled Plasma Mass Spectroscopy. Radiology 276, 228–232. https://doi.org/10.1148/radiol.2015142690
4) Rogowska, J., Olkowska, E., Ratajczyk, W., Wolska, L., 2018. Gadolinium as a new emerging contaminant of aquatic environments. Environ Toxicol Chem 37, 1523–1534. https://doi.org/10.1002/etc.4116
5) Schlaudecker, J.D., Bernheisel, C.R., 2009. Gadolinium-associated nephrogenic systemic fibrosis. Am Fam Physician 80, 711–714.
6) Poublanc, J., Sobczyk, O., Shafi, R., Sayin, E.S., Schulman, J., Duffin, J., Uludag, K., Wood, J.C., Vu, C., Dharmakumar, R., Fisher, J.A., Mikulis, D.J., 2021. Perfusion MRI using endogenous deoxyhemoglobin as a contrast agent: Preliminary data. Magnetic Resonance in Medicine 86(6), 3012-3021. https://doi.org/10.1002/mrm.28974
7) Liu, P., De Vis, J.B., Lu, H., 2019. Cerebrovascular reactivity (CVR) MRI with CO2 challenge: A technical review. Neuroimage 187, 104–115. https://doi.org/10.1016/j.neuroimage.2018.03.047
8) Kastrup, A., Krüger, G., Neumann-Haefelin, T., Moseley, ME., 2001. Assessment of cerebrovascular reactivity with functional magnetic resonance imaging: comparison of CO2 and breath holding. Magn Reson Imaging 19(1), 13-20. doi: 10.1016/s0730-725x(01)00227-2. PMID: 11295341.
9) Knutsson, L., Börjesson, S., Larsson, EM., Risberg, J., Gustafson, L., Passant, U., Ståhlberg, F., Wirestam, R., 2007. Absolute quantification of cerebral blood flow in normal volunteers: correlation between Xe-133-SPECT and dynamic susceptibility contrast MRI. J Magn Reson Imaging 26, 913–920.
10) Ostergaard, L., Weisskoff, R.M., Chesler, D.A., Gyldensted, C., Rosen, B.R., 1996. High resolution measurement of cerebral blood flow using intravascular tracer bolus passages. Part I: Mathematical approach and statistical analysis. Magn Reson Med 36, 715–725. https://doi.org/10.1002/mrm.1910360510
11) Uludağ, K., 2010. To dip or not to dip: Reconciling optical imaging and fMRI data. Proceedings of the National Academy of Sciences of the United States of America 107, E23. https://doi.org/10.1073/pnas.0914194107
12) Bjørnerud, A., Emblem, K.E., 2010. A fully automated method for quantitative cerebral hemodynamic analysis using DSC–MRI. J Cereb Blood Flow Metab 30, 1066–1078. https://doi.org/10.1038/jcbfm.2010.4
13) Carroll, T.J., Horowitz, S., Shin, W., Mouannes, J., Sawlani, R., Ali, S., Raizer, J., Futterer, S., 2008. Quantification of Cerebral Perfusion Using the “Bookend Technique”: an Evaluation in CNS Tumors. Magn Reson Imaging 26, 1352–1359. https://doi.org/10.1016/j.mri.2008.04.010
14) Knutsson, L., Ståhlberg, F., Wirestam, R., 2010. Absolute quantification of perfusion using dynamic susceptibility contrast MRI: pitfalls and possibilities. Magn Reson Mater Phy 23, 1–21. https://doi.org/10.1007/s10334-009-0190-2
15) Schulman, J.B., Sayin, E.S., Manalac, A., Poublanc, J., Sobczyk, O., Duffin, J., Fisher, J.A., Mikulis, D., Uludağ, K., 2023. DSC MRI in the human brain using deoxyhemoglobin and gadolinium—Simulations and validations at 3T. Frontiers in Neuroimaging 2.
Figures